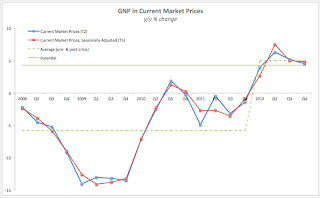
Five charts summarising Irish GDP and GNP dynamics in 2007-2012 period. The first set is of 4 charts plotting various measures of GDP and GNP in constant and current prices in terms of year-on-year changes:
In all of the above, I show two 'trend' figures: the 2% annual real growth trend as a long-term sustainability level of growth and the within-crisis (period of contracting GDP or GNP) and out-of-crisis (period of sustained positive growth) averages. These two sets of lines provide a marker for assessing as to whether or not the economy is currently running at the growth rates above or below trend.
And to summarise the state of play today:
Thus, after almost two years of 'turned corners' and 'recoveries'
- Ireland's GDP and GNP are still massively below the pre-crisis levels of 2007.
- Ireland's GDP growth in constant and current prices is running below trend levels in Q3 and Q4 2012
- Ireland's GDP growth shorter-term trend (post-crisis) is below the long-term trend levels, which is simply not consistent with normal U-shaped recovery
- Ireland's GNP growth is running at above trend levels for 3 quarters now in constant prices terms, and close to the trend levels for current prices terms
- By all measures (across current and constant prices) both GDP and GNP are posting markedly slower rates of growth in Q4 2012 compared to previous quarters.


No comments:
Post a Comment