Tuesday, April 27, 2021

26/4/21: What Low Corporate Insolvencies Figures Aren't Telling Us


One of the key features of the Covid19 pandemic to-date has been a relatively low level of corporate insolvencies. In fact, if anything, we are witnessing virtually dissipation of the insolvencies proceedings in the advanced economies, and a simultaneous investment boom in the IPOs markets. 

The problem, of course, is that official statistics - in this case - lie. And they lie to the tune of at least 50 percent. Consider two charts:

And


The chart from the IMF is pretty scary. 18 percent of companies are expected to experience liquidity-related financial distress and 16 percent are expected to experience insolvency risk. The data covers Europe and Asia-Pacific. Which omits a wide range of economies, including those with more heavily leveraged corporate sectors, and cheaper insolvency procedures e.g. the U.S. The estimates also assume that companies that run into financial distress in 2020 will exit the markets in 2020-2021. In other words, the 16 percentage insolvency risk estimate is not covering firms that run into liquidity problems in 2021. Presumably, they will go to the wall in 2022. 

The second chart puts into perspective the IPO investment boom. Vast majority of IPOs in 2020-2021 have been SPACs (aka, vehicles for swapping ownership of prior investments, as opposed to generating new investments). The remainder of IPOs include DPOs (Direct Public Offerings, e.g. Coinbase) which (1) do not raise any new investment capital and (2) swap founders and insiders equity out and retail investors' equity in. 

The data above isn't giving me a lot of hope, to be honest of a genuine investment boom. 

We are living through the period of fully financialized economy: the U.S. government monetary and fiscal injections in 2020 totaled some $12.3 trillion. That is more than 1/2 of the entire annual GDP. Since then, we've added another $2.2 trillion. Much of these money went either directly (monetary policy) or indirectly (Robinhooders' effect) into the Wall Street and the Crypto Alley. In other words, little of it went to sustain real investment in productive capital. Fewer dollars went to sustain skills upgrading or new development. Less still went to support basic or fundamental research. 

In this environment, it is hard to see how global recovery can support higher productivity growth to bring us back to pre-pandemic growth path. What the recovery will support is and accelerated transfer of wealth:

  • From lower income households that saved - so far  - their stimulus cash, and are now eager to throw it at pandemic-deferred consumption; 
  • To Wall Street (via corporate earnings and inflation) and the State (via inflation-linked taxes).
In the short run, there will be headlines screaming 'recovery boom'. In the long run, there will be more structural unemployment, less jobs creation and greater financial polarization in the society. Low - to-date - corporate insolvencies figures and booming financial markets are masking all of this in the fog of the pandemic-induced confusion. 


Monday, April 26, 2021

25/4/21: Impact of foreign shareholders on the performance of the Chinese banks

 A new paper (pre-print version): Gurdgiev, Constantin, and Jiagi, Li, The Journey of a thousand miles: a decade of impact of foreign shareholders on the performance of the Chinese commercial banks (April 25, 2021). Handbook of Banking and Finance in Emerging Markets, eds. D. K. Nguyen, Edward Elgar Publishing, August 2021, forthcoming., Available at SSRN: https://papers.ssrn.com/sol3/papers.cfm?abstract_id=3834020. 

Abstract: 

We analyze the impact of foreign shareholdings on the performance of 28 Chinese commercial banks over a period of 2010-2019, capturing the period prior to and following the reforms of 2014. Using panel data GMM with instrumental variables, we consider bank performance from three perspectives: profitability, quality of assets and liquidity. The individual performance indicators are return on equity (ROE), non-performing loan (NPL) ratio, loan-to-deposit ratio, and loan loss coverage ratio. We find that foreign shareholdings have a significant negative impact on ROE. Increase in foreign investment is coincident with growth in the size of Chinese commercial banks in terms of assets that is faster than the increases in the banks’ return on capital. These findings are intuitively justified: if foreign investors increase banks’ appetite for growth, growth in assets under management will tend to outpace growth in returns on assets in the earlier stages of new investments. From the quality perspective, we show that banks’ NPL ratio is negatively correlated with foreign shareholdings and the correlation is significant both statistically and empirically. NPL ratios fall in the banks with more foreign participation. This result stands contrasted by the fact that some foreign investors (activist and hedge funds), seek to invest in Chinese listed banks with higher NPLs. In terms of liquidity performance, foreign share ownership has a significant negative influence on banks’ loan-to-deposit ratio. Loan loss coverage ratio significantly increases, along with the increasing foreign participation in Chinese commercial banks shareholdings. Combined, these effects suggest significant positive twin effect of foreign shareholdings on Chinese commercial banks risk profiles. As the result, Chinese banks with higher foreign shareholdings are better prepared to sustain losses from bad loans and state risks and have lower risk exposures to bad loans. The combined effects of our findings strongly suggest that Chinese banks’ ROE can be expected to pick up in the near future with further financial opening in the sector and the greater involvement of foreign investors that comes along with it.


25/4/21: Impact Finance perspective of the systemic threats to blockchain applications


New paper (pre-print version): 

Gurdgiev, Constantin and Fleming, Adam, Informational efficiency and cybersecurity threats: A Social Impact Finance perspective of the systemic threats to blockchain applications (April 25, 2021). Forthcoming, Chapter 12 in Innovations in Social Finance: Transitioning Beyond Economic Value, eds. Thomas Walker, Jane McGaughey, Sherif Goubran, and Nadra Wagdy, Palgrave Macmillan, 2021, Available at SSRN: https://papers.ssrn.com/sol3/papers.cfm?abstract_id=3834032

Abstract: 

Crypto-assets and blockchain technologies hold the promise of providing more secure systems for managing public and private data, enhancing public trust in data collection, and increasing the efficiency of social impact finance transactions. However, to-date, blockchain technologies have struggled to deliver on these promises. Specifically, cybersecurity threats to blockchain technologies are accelerating and becoming more impactful over time, generating growing risk to the use of the blockchain technologies in social impact finance services provision. Our analysis data on cybersecurity breaches involving cryptocurrencies trading platforms from 2014 through 2019 shows that cryptocurrencies markets have, to-date, failed to develop informational efficiencies necessary to sustain these technologies’ deployment in impact finance. Faced with increasing cybersecurity threats permissionless blockchain systems appear to be more vulnerable to shocks, than they were in the past. Cyber breaches in the cryptocurrency markets create major risk contagion pathways, which are dramatically increasing volatility of both directly attacked currencies and other major cryptocurrencies; as well as present an increased risk of system-wide attacks that threaten not only the accounting and transactional accuracy and efficiency of the crypto-based fintech solutions, but also the data stored using public blockchain protocols. These findings lead us to conclude that, absent dramatic improvements in the regulation of cryptocurrencies and exchanges, public blockchains based on traded crypto-assets are not suitable for large scale deployment in social impact finance applications.


Friday, April 23, 2021

23/4/21: There are no 'social' winners amidst this pandemic


No one is left unscarred by the #covid19 pandemic when it comes to public approval trends for the major social stakeholders in Ireland: 

Source: Core Research. 

Broadly-speaking, the above is expected, although Core Research report contains one glaring omission: it does not survey public attitudes to media/press. Worse, the three improving stakeholder groups are also the three least impacted: own employer, citizens and large companies. Meanwhile, approval of the government is still nosediving. 

Covid pandemic is certainly testing Irish (and other countries') key institutional frameworks. The fallout from these tests is going to be long-lasting and deep. We went into the pandemic with huge deficits of trust in key institutions of our societies. And we are becoming more polarized and less enthusiastic in our support for these institutions since then.

Thursday, April 22, 2021

22/4/21: Pew Research on Public Support for Economic Reforms in the US, UK, France and Germany


Here's an interesting insight from Pew Research surveys:


Set aside France results. Look at the U.S. and UK: 50-51 percent of the countries' population feel the existent economic system needs major changes or "complete" reform. 


While U.S. Right stands out as the least supportive of economic reforms across the Right spectrum voters in all four countries, U.S. Left shares the highest propensity for reforms with the French Left. This, of course, does not mean that what the U.S. Left sees as necessary reforms is aligned with what the French Left sees, but in terms of propensity to support reforms, the U.S. Left is closer to the more 'radical' French Left than to the more 'conservative' German Left.

There are other insights from the data accessible here: https://www.pewresearch.org/global/2021/04/22/many-in-western-europe-and-u-s-want-economic-changes-as-pandemic-continues/ .

Monday, April 19, 2021

19/4/21: COVID19: BRIICS

BRIICS are now in a fully-developed Wave 4 of the pandemic, like much of the rest of the world. This is confirmed across both new case numbers and weekly deaths counts:


I highlighted in the table below two BRIICS countries with seriously questionable data quality: China and India. China has been routinely reporting numbers that simply are out of line with anything reported by other countries around the world. India's death statistics appear to be similarly out line with experience in most countries. In the past, Russia received a lot of criticism for its reporting of Covid19 deaths, but their numbers do not appear to be out of line with other countries reported statistics.

These are six largest emerging and middle income economies in the world, and their pandemic dynamics, in the end, hold the key to the global efforts on combating the spread of the disease. Not surprisingly, these countries account for three of the four main variants of the disease to-date. If anyone thinks that Europe and North America can effectively insulate themselves from what is happening in these countries, by any means other than attaining a sufficient and robust immunity through vaccinations, they really need to reflect hard on their rational thought capacity.


19/4/21: COVID19: Most impacted countries


Updated tables for world's most impacted countries and regions below. Starting with the countries with the highest recognized levels of infections:


Followed by the countries with the highest rates of mortality:
  • Andorra, Montenegro and Czechia are top three countries in the world in terms of infections rates
  • Gibraltar, Czechia and San Marino are top three countries in the world in terms of mortality rates
  • Of larger countries, with population > 100 million, the U.S. is the only country featured on both lists, while Mexico is on the list of countries with highest mortality.
A set of table for countries with more than 250,000 recorded cases:


  • There are 57 countries on the list as of Thursday last week. 
  • Across three metrics used (infections rate, deaths per capita and mortality rate per case), Hungary is rated the worst, followed by Belgium and Bulgaria. Czechia and Slovakia share the 4th and 5th places.
  • The U.S. is ranked 3rd highest in the number of infections, in the 8th place in terms of highest deaths per 1 million of population and in the 32nd place in terms of deaths per 1,000 infections. Overall, the U.S. is ranked 8th worst country in terms of pandemic performance across the three metrics.
Table next shows comparatives by the same metrics across regions, treating regions as if they were countries (ranks):

Finally, looking at the major countries and groupings in terms of their cases and deaths counts within the context of their shares of global population:

Notably, majority of the most impacted countries are, currently, in the process of developing, or already experiencing, a new wave of the pandemic.

Sunday, April 18, 2021

17/4/21: COVID19: Europe and EU27


Looking at Europe and EU27 data for Covid19 pandemic through Week 14 of 2021 (week ending Thursday, April 15):

Since Week 7, the EU27 are in Wave 3, although it appears that this wave might have peaked around Week 12. Latest weekly case counts are below week 12 reading and are lowest in three consecutive weeks. Nonetheless, latest weekly counts rank 10th highest in the history of the pandemic.


EU27 weekly death counts are currently (week 14, 2021) rank 16th highest in the entire 67 weeks-long history of the pandemic.

As summarized in the table below, EU27 new cases are this week down 9% on 4 weeks average, while death counts are up 6%


17/4/21: COVID19: Worldwide Data

 
Despite the ongoing efforts to accelerate vaccinations, we can now, sadly, confirm that globally, we are in the fourth wave of the pandemic:

As reminder,  we exited Wave 3 that started Week 34, 2020, peaked in Week 1, 2021, and bottomed out in Week 7 of 2021. Since Week 8 of 2021, we are seeing growth of a new wave, Wave 4 which has now reaching the peak of Wave 3. The latest level of new infections is now second highest weekly count in the history of the pandemic, at 4,833,991 cases compared to 5,284,581 cases at the peak of Wave 3 in week 1 of 2021.


There is a two weeks lag in the dynamics of deaths counts compared to the dynamics of new cases registrations. Nonetheless, we can now confirm Wave 4 development based on weekly deaths as well as on weekly new case counts. The latest weekly death counts as of Week 14, 2021, ranks 5th highest in the history of the pandemic.

Mortality rates remain subdued, as through the Wave 3 of the pandemic. Which is the only decent news from the recent data.


A summary table by region:


In summary: the pandemic is not abating, despite significant inroads made in terms of vaccinations, especially in the advanced economies. It is a loud and clear reminder to us all that vaccinations in the advanced economies are not enough to cut global rates of infections, and every day lost to lower rates of vaccinations in the emerging economies is another day left to virus to potentially mutate and produce yet another more contagious and deadly variant.


Saturday, April 17, 2021

17/4/21: Collapsing Labor Force Participation: A Secular Trend


For those of you following this blog this would be a familiar sight: I have been worrying about the underlying structure of the U.S. labor markets for some time now. The ongoing recovery appears to be relatively robust in terms of headline figures, e.g. GDP growth rates and declining continued unemployment claims. But in reality, it has been nothing but the return to trends that persisted before the pandemic - trends that are extremely worrying.

I covered the fact that longer term unemployment has now gone through the roof: https://trueeconomics.blogspot.com/2021/04/14421-share-of-those-in-unemployment-27.html. And beyond this, there is a bigger problem of historically low levels of labor force participation. We are witnessing a massive pull-away within the skills distribution in the U.S. economy: there are shortages of skilled labor, including in manufacturing, and there is massive outflow of people from the labor markets in lower skills groups.


Just look at the absolute disaster of the 'recovery' when it comes to people who have left the workforce alltogether:


And consider the gender mix in this: 

1. Women labor force participation is down:

2. Men participation has collapsed:

The above appears to show more benign trend in female labor force participation trend than in male, and... here comes the kicker: women labor force participation currently sits around the levels comparable to 1987; men - at around ... well... never.


The above table puts matters into perspective: the gap between the pandemic period and prior high participation period is almost 5 times larger for men than for women. But... the gap between women and men participation rates in the pandemic period and pre-pandemic period is much smaller: at roughly 48% higher for men than for women. For the latest data point (March 2021) the latter gap is roughly 80%. In other words, the dynamics in terms of labor force participation for women are becoming much less benign, relative to men. than they were during the pre-pandemic period.

To put this into a different perspective: secular pre-pandemic trend for men were woeful. They were less so for women. But pandemic is accelerating longer term pressures on both men and women in pushing them out of the labor force.

If you think this is a 'robust' recovery, you really need to think a bit harder: we are having a secular stagnation in the female labor force and we are having a long term depression in the male labor force. And these trends are not subject to demographics of aging. 

Wednesday, April 14, 2021

14/4/21: The share of those in unemployment > 27 weeks is rising


One way to look at the state of the real (as opposed to financialized and corporate-value focused) economy is to look at unemployment. And one of the strongest indicators of longer term changes in the structure of the real economy is the fate of the longer term unemployed. Here is an interesting snapshot of data: the percentage of those unemployed for 27 week or longer in the total pool of the unemployed. The higher the number, the more structural is the unemployment problem. 


If the above is not clear enough, here is the same data expressed in the form of the range for each 12 months period (rolling) between maximum share of the longer term unemployed in the overall pool of unemployment and the minimum share:


All of the above suggests we are in deep trouble. And this trouble has been persistent since the Great Recession: we are witnessing a dramatic increase in the duration of unemployment spells. Part of this is due to the impact of Covid19 pandemic concentrated in specific sectors. Part of this is down to the generosity of unemployment benefits supplements and direct subsidies during the pandemic. Part of it is also down to the longer term changes in the U.S. labor markets and changes in households' composition and investment/consumption patterns.

Irrespective of the causes, the problem is obvious: the longer the person remains unemployed, the sharper is the depreciation of skills and their employability. If this (post-2008) experience is the 'new normal', America is developing a massive class of disillusioned and human capital poor workers. 


Thursday, April 8, 2021

8/4/21: BRIC Composite PMIs 1Q 2021: A Mixed Bag for Recovery Votes


I covered BRIC Manufacturing PMIs for 1Q 2021 (https://trueeconomics.blogspot.com/2021/04/5421-brics-manufacturing-pmis-1q-2021.html) and BRIC Services PMIs (https://trueeconomics.blogspot.com/2021/04/8421-bric-services-pmi-1q-2021-slowing.html) in the two posts earlier.  Now, the round up analysis based on Composite PMIs:

  • Brazil Composite PMI fell from 54.4 in 4Q 2020 to 52.1 in 1Q 2021, marking a slowdown in growth conditions in the economy. Quarterly activity in 1Q 2021 is still ahead of where it was in 3Q 2020 (51.6) and marks third consecutive quarter of growth. But, for the first time during this recovery period, Brazil Composite PMI is now below Global Composite PMI (53.43 in 1Q 2021).
  • Russia Composite PMI increased from recessionary 47.7 in 4Q 2020 to still negative-growth (albeit statistically, indistinguishable from zero growth) 49.5 in 1Q 2021. Russian economy has now posted four quarters of contracting economic growth PMIs out of five quarters of the pandemic. Needless to say, Russian Composite PMIs are remaining well below Global Composite PMI as the did in 4Q 2020 as well.
  • India Composite PMI slipped from 56.4 in 4Q 2020 to 55.7 in 1Q 2021 signaling slower, but still robust growth in the economy. India outperformed Global Composite PMIs in 4Q 2020 and 1Q 2021, the only two quarters of > 50 readings in India's case.
  • China Composite PMI fell from 56.3 in 4Q 2020 to still robust 55.2 in 1Q 2021. Thus, China, like India, managed to outperform Global Composite PMIs in both of the last two quarters. Unlike India, China also beat Global Composite PMIs in 1Q and 2Q 2020 as well. Since Chinese economy was the only BRIC economy to regain its 2019 levels of activity back in 3Q 2020, the last two quarters of PMIs suggest strong rebound in the world's largest economy (or second largest one, depending on how one counts economic output).


8/4/21: BRIC Services PMI 1Q 2021: Slowing Growth Momentum

 Earlier this week, I posted on the latest PMI reports for BRIC economies for Manufacturing sector (https://trueeconomics.blogspot.com/2021/04/5421-brics-manufacturing-pmis-1q-2021.html).  Now, let's cover Services Sector 1Q 2021 PMIs. Remember, Markit - source of data - cover only monthly PMIs.

As reminder, Manufacturing PMIs fell in all BRIC economies except for Russia in 1Q 2021 compared to 4Q 2020. As the result, overall, BRIC Manufacturing Activity Index (GDP-weighted average of PMIs) fell from 54.8 to 52.8 between 4Q 2020 and 1Q 2021.

In services sector:

  • Brazil Services PMI slipped into a recessionary territory in 1Q 2021, falling from 4Q 2020 reading of 51.4 to 46.1 in 1Q 20201. This marks the lowest reading since 2Q 2020.
  • Russia Services PMI rebounded robustly from 4Q 2020 reading of 47.7 to 1Q 2021 reading of 53.6. Russian Services PMIs have been very volatile during the pandemic period, hitting the low of 32.0 in 2Q 2020 and the high of 56.8 in 3Q 2020.
  • India Services PMI improved from growth-signaling 53.4 in 4Q 2020 to even faster growth-consistent 54.2 in 1Q 2021. India and Russia were the two BRIC economies posting improvements in services sector in 1Q 2021.
  • China Services PMI fell from 'very high growth' signaling reading of 57.0 in 4Q 2020 to moderate growth-signaling 52.6 in 1Q 2021.
  • Overall, BRIC Services Sector Activity Index - a measure I calculate based on Markit PMI data inputs - fell from 54.8 in. 4Q 2020 to 52.6 in 1Q 2021, virtually matching the decline in Manufacturing Sector Activity Index over the same period of time. 
  • BRIC Services Activity Index also underperformed Global Services PMI which average 53.3 in 1Q 2021. In 4Q 2020, BRIC Services Activity Index was ahead of Global Services PMI (54.8 to 52.3).


8/4/21: No Inflation Cometh?


Having written about strengthening signals of rising inflation globally and in the U.S. in particular before, here is today's note from Markit on the matter: https://ihsmarkit.com/research-analysis/global-price-gauge-hits-new-high-as-input-cost-inflation-accelerates-sharply-Apr21.html 

To quote: global inputs inflation pressures are at their highest since 2008:


By sector:


Factory gate prices are scaling up:

Manufacturing supply shortages at nearly historical highs:
Prices of all, but financial services and consumer services are up through the roof:

Profit margins are being demolished:

And consumer goods prices are going through the roof:

Which means that targeting 2-3% inflation at current monetary policies is plain bonkers. Unless Central Banks are willing to entertain inflation at +5-10 percent above current, the rates must go up. Keep leveraging, everyone. Credit cards, margin trades and mortgages are about to get 'uncertain'... 

Wednesday, April 7, 2021

7/4/21: Ireland PMIs for March: Growth and Inflation Pressures


Ireland PMIs for 1Q 2021 are out this week, so let's take a closer look at monthly activity data. 

  • March services PMI came in at a surprising 54.6 - up on 41.2 in February and 36.2 in January. Given the country is in a phase 5 lockdown, and there has been little change on that in recent months, the new reading is a bizarre one. Per Markit: "Three out of four monitored sub-sectors registered higher business activity in March. The strongest rate of expansion was in Financial Services, followed by Business Services and Technology, Media & Telecoms respectively. Activity in Transport, Tourism & Leisure declined for the eighth month running, but at the slowest rate since last August." A lot of hope-for vaccines and 'getting back to normal' as well as exports rise behind these figures. Services PMI is now at its highest reading since February 2020.
  • March Manufacturing PMI also performed well, rising to 57.1 from 52.0 in February. Manufacturing index has been more volatile in the pandemic than Services, so this rise is less of a surprise, given the global economic recovery and demand for Irish exports.
  • We do not have full March data for construction sector PMI, which is reported mid-month, so all we do have is mid-March reading of 27.0. 
Official Composite PMI published by Markit was pretty upbeat in march 2021, rising to 54.5 - signaling strong growth, having previously posted 47.2 in February and 40.2 in January 2021. My own, Three Sectors Activity index - a weighted average of three sectors PMIs based on their share of gross value added - rose even more sharply: from 41.8 in January and 45.0 in February to 55.0 in March. If Construction sector PMI were to come in on-trend mid-April, the Three Sectors Index will be closer to 55.1-55.2 range.


As an aside, it is worth noting that Irish economic activity is showing similar trend to global activity when it comes to inflationary pressures (see: https://trueeconomics.blogspot.com/2021/04/5421-heating-up-inflationary-risks.html). Per Markit: "March data indicated soaring cost pressures. The Composite Input Prices Index posted a record one-month gain and signalled the fastest rate of inflation since July 2008. Cost pressures were much stronger at manufacturers than service providers." In other words, even small open economies with massive distortions coming from the multinationals' financial and tax engineering sides are now showing signs of heating up inflation. 

Tuesday, April 6, 2021

6/4/21: Edelman Trust Barometer: the Age of Cognitive Dissonance?

Some shocking, genuinely shocking data from the Edelman Global Trust Barometer for 2021. Let's take a look. 

Start with this: 

Welcome to the world where sociopaths like Jeff Bezos are both trusted to be competent and perceived to be ethical. 

Meanwhile, at least w are catching up with what is happening in the tech sector:

And with the Social Media...


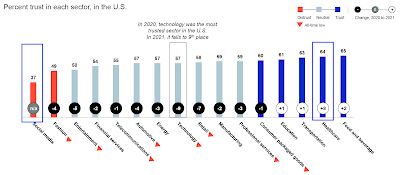
But we can't be human without some serious cognitive dissonance... Healthcare is now the second most trusted sector of business in America. Yep, the same private healthcare that had to rely on public / State / Federal money and logistics to distribute vaccines. The same private healthcare that could not organize vaccinations. The same private healthcare that, effectively, bankrupted and overcharged millions of Americans for emergency treatments during the pandemic. 

Back to Social Media:

I am not quite sure what people 'trust' in terms of information delivered via 'search engines', exactly. A search engine provides access to information, but it does not provide  or produce information. So drop this daft category from the analysis and what you have? Traditional Media is barely above the water, when it comes to trust. Owned Media and Social Media are below the waterline. If you control for the partisanship divide in the U.S. political landscape, most likely the vast majority of those trusting Traditional Media are... well, Democrats. The vast majority of those who distrust Social Media are... well, Democrats. Converse holds for the Republicans. One way or the other, massive shares of American population do not have trust in anything relating to quality control or verifiability of information sources.

This year's barometer is a scary reading. In most basic terms, NGOs and Business are the only two sets of institutions that are perceived ethical. Business' perception in this area is dangerously close to being marginal. Perceived incompetency of the Government is vastly greater than perceived competency of Business.  Media is virtually the exact mirror reflection of business. We trust no one in terms of information we receive. And we love those who are making money by not caring for us - American Healthcare. We lap up anything our employers communicate, but we believe they are telling us bullshit when it comes to their social and environmental sustainability efforts or to the risks of us being displaced by them with AI and technology. 

Is there much 'social fabric' left that hasn't been torn up, yet?.. 

5/4/21: Heating up inflationary risks


No, hyperinflation and, in fact, high inflation, ain't coming, yet. But the concerns with both are rising... 


Both, input prices and output prices have accelerated in March, compared to February in Markit's Manufacturing PMIs. 

Headline Markit statement says: "Conditions in the global manufacturing sector continued to brighten at the end of the first quarter, despite the potential for growth to be stymied by rising cost inflationary pressures and supply-chain disruptions." (Emphasis is mine).  And more: "Demand outstripping supply also contributed to a marked increase in purchasing costs during March. Input price inflation surged to a near-decade high, the pass-through of which led to the steepest rise in output charges since data on selling prices were first tracked in October 2009."

The same is happening in the U.S.: "Supplier lead times lengthened to the greatest extent on record. At the same time, inflationary pressures intensified, with cost burdens rising at the quickest rate for a decade. Firms partially passed on higher input costs to clients through the sharpest increase in charges in the survey's history."


5/4/21: BRIC's Manufacturing PMIs: 1Q 2021


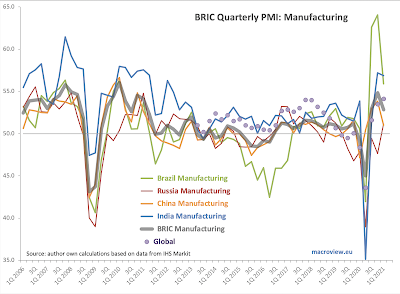
Given a lot of noise about economic re-opening and abatement of the late 2020 wave of the pandemic, we expected BRIC countries PMIs to improve significantly in 1Q 2021 compared to 4Q 2020. Alas, the opposite took place:


  • Brazil Manufacturing PMI fell from 64.1 in 4Q 2020 to 55.9 in 1Q 2021. All three months of 1Q 2021 came in sub-60 (all three months of 4Q 2020 were above 60) and March 2021 was the lowest monthly reading since June 2020.
  • Russia Manufacturing PMI slipped from 51.5 in February to 51.1 in March. On quarterly basis, Russia Manufacturing PMI actually managed to rise from a recessionary reading of 47.6 in 4Q 2020 to a weak recovery reading of 51.2 in 1Q 2021. This is the highest reading since 1Q 2019 and the first above-50 reading since the end of 2Q 2019. Russia was the only BRIC economy posting increasing PMI in Manufacturing sector in 1Q 2021, and at that, the improvement went to anaemic growth from pretty steep contraction.
  • China Manufacturing PMI disappointed, falling from 53.8 in 4Q 2020 to 51.0 in 1Q 2021. Given structural importance of Chinese manufacturing globally, this implies a further build up in orders backlogs in the global supply chains, signaling more inflationary pressures down the line. On a monthly basis, March 2021 posted fourth consecutive decline in monthly PMIs, with March reading of just 50.6 - statistically, basically indistinguishable from zero growth conditions in the sector.
  • India Manufacturing PMI fell from 57.7 and 57.5 in January and February 2021 to 55.4 in March 2021, marking the slowest monthly rate of growth since August 2020. On a quarterly basis, India Manufacturing PMI fell from a hard-to-believe rate of expansion of 57.2 in 4Q 2020 to still robust growth of 56.9 in 1Q 2021.
Brazil and India were the two BRIC economies that managed to outperform global manufacturing sector growth in 1Q 2021 which came in at 54.1, up on 53.5 in 4Q 2020.

Global GDP-weighted BRIC group Index of Manufacturing Activity that I calculate based on Markit data fell from from 54.8 in 4Q 2020 to 52.8 in 1Q 2021, reaching the lowest reading since 2Q 2020 when it was at 45.0. Whilst BRIC group Index of Manufacturing Activity outperformed Global Manufacturing PMI in every quarter between 1Q 2019 and 4Q 2020, it fell below the global measure in 1Q 2021.

Monday, April 5, 2021

5/4/21: The Coming Wave of Financial Repression


In a recent article for The Currency, I covered the topic of the forthcoming wave of financial repression, as Governments worldwide pursue non-conventional fiscal tightening in years to come: Make no mistake, financial repression is coming in the UShttps://thecurrency.news/articles/36547/make-no-mistake-financial-repression-is-coming-in-the-us/


5/4/21: The Entrepreneurship Boom: Forced, Voluntary and Funded


My recent article for The Currency covering the ongoing global developments in entrepreneurship: The US is experiencing an entrepreneurship boom. So, what is going wrong in Ireland?https://thecurrency.news/articles/40790/the-us-is-experiencing-an-entrepreneurship-boom-so-what-is-going-wrong-in-ireland/


Friday, April 2, 2021

2/4/21: America's Scariest Chart: U.S. Employment Situation

Now, the last of the series of posts on U.S. labor markets, concluding with America's Scariest Chart, plotting the index of employment (jobs) in the U.S. based on each recession-recovery cycle:


Despite some positive headline numbers on some labor market metrics, jobs creation in the U.S. is not  progressing well-enough to claim any end in sight for the Covid19-induced recession. Current reading for jobs index, relative to pre-recession highs is woeful. So woeful, today's state of U.S. markets ranks as the second worst jobs recession in modern history, so far, worse than the Great Recession. 

Good news is that in March, pace of recovery accelerated from a major slowdown experienced in the first two months of 2021. The bad news is, unless this pace is sustained, we are risking a scenario where unprecedented policy (fiscal and monetary) supports unleashed since the start of 2Q 2020 will be associated with a jobs recovery that is second-third worst in the modern history of U.S. recessions. Time will tell.


Note: