Showing posts with label #recession. Show all posts

Tuesday, April 6, 2021

5/4/21: BRIC's Manufacturing PMIs: 1Q 2021


Given a lot of noise about economic re-opening and abatement of the late 2020 wave of the pandemic, we expected BRIC countries PMIs to improve significantly in 1Q 2021 compared to 4Q 2020. Alas, the opposite took place:


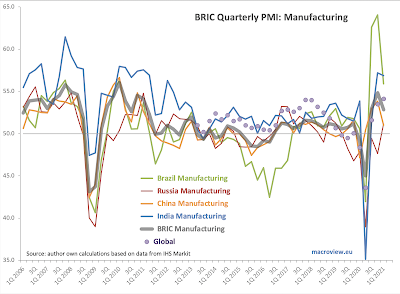
  • Brazil Manufacturing PMI fell from 64.1 in 4Q 2020 to 55.9 in 1Q 2021. All three months of 1Q 2021 came in sub-60 (all three months of 4Q 2020 were above 60) and March 2021 was the lowest monthly reading since June 2020.
  • Russia Manufacturing PMI slipped from 51.5 in February to 51.1 in March. On quarterly basis, Russia Manufacturing PMI actually managed to rise from a recessionary reading of 47.6 in 4Q 2020 to a weak recovery reading of 51.2 in 1Q 2021. This is the highest reading since 1Q 2019 and the first above-50 reading since the end of 2Q 2019. Russia was the only BRIC economy posting increasing PMI in Manufacturing sector in 1Q 2021, and at that, the improvement went to anaemic growth from pretty steep contraction.
  • China Manufacturing PMI disappointed, falling from 53.8 in 4Q 2020 to 51.0 in 1Q 2021. Given structural importance of Chinese manufacturing globally, this implies a further build up in orders backlogs in the global supply chains, signaling more inflationary pressures down the line. On a monthly basis, March 2021 posted fourth consecutive decline in monthly PMIs, with March reading of just 50.6 - statistically, basically indistinguishable from zero growth conditions in the sector.
  • India Manufacturing PMI fell from 57.7 and 57.5 in January and February 2021 to 55.4 in March 2021, marking the slowest monthly rate of growth since August 2020. On a quarterly basis, India Manufacturing PMI fell from a hard-to-believe rate of expansion of 57.2 in 4Q 2020 to still robust growth of 56.9 in 1Q 2021.
Brazil and India were the two BRIC economies that managed to outperform global manufacturing sector growth in 1Q 2021 which came in at 54.1, up on 53.5 in 4Q 2020.

Global GDP-weighted BRIC group Index of Manufacturing Activity that I calculate based on Markit data fell from from 54.8 in 4Q 2020 to 52.8 in 1Q 2021, reaching the lowest reading since 2Q 2020 when it was at 45.0. Whilst BRIC group Index of Manufacturing Activity outperformed Global Manufacturing PMI in every quarter between 1Q 2019 and 4Q 2020, it fell below the global measure in 1Q 2021.

Friday, April 2, 2021

2/4/21: America's Scariest Chart: U.S. Employment Situation

Now, the last of the series of posts on U.S. labor markets, concluding with America's Scariest Chart, plotting the index of employment (jobs) in the U.S. based on each recession-recovery cycle:


Despite some positive headline numbers on some labor market metrics, jobs creation in the U.S. is not  progressing well-enough to claim any end in sight for the Covid19-induced recession. Current reading for jobs index, relative to pre-recession highs is woeful. So woeful, today's state of U.S. markets ranks as the second worst jobs recession in modern history, so far, worse than the Great Recession. 

Good news is that in March, pace of recovery accelerated from a major slowdown experienced in the first two months of 2021. The bad news is, unless this pace is sustained, we are risking a scenario where unprecedented policy (fiscal and monetary) supports unleashed since the start of 2Q 2020 will be associated with a jobs recovery that is second-third worst in the modern history of U.S. recessions. Time will tell.


Note: 


2/4/21: U.S. Duration of Unemployment

One of the America's Scariest Charts - a long-term running issue I have been highlighting for a number of years now - is roaring back to prominence as Covid19 pandemic crisis continues to impact U.S. labor markets across virtually all possible metrics of health.


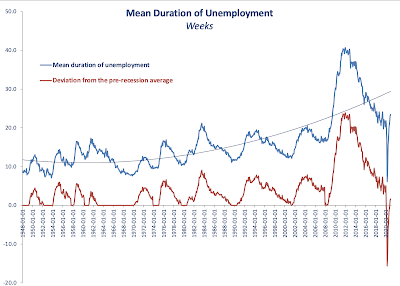
Here it is: the average duration of unemployment spells:


Unemployment spells become short at the start of the recession as new vintage unemployed join the ranks of long term unemployed. As the recovery sets in, unemployment duration starts to take into the account a different and changing mix of those on unemployment: the share of total unemployed who are short-term unemployed shrinks, the share of the longer term unemployed rises. Secularly, however, virtually every past recession since 1970s on has resulted in a longterm increase in average duration of unemployment during the recovery phase of the business cycle. In other words, the longer term unemployed became even longer-term unemployed. And now, the Covid19 pandemic joins the line of past recessions with continuing on this trend. 

Chart next compares each recession and subsequent recovery period since the end of the WW2 through current:


Based on the average duration of unemployment, we are now (in the Covid19 pandemic recession) are tracking the worst recession on record: the Great Recession. Weeks ahead will tell us, if indeed this will be a new record-breaking recession, beating the length of average unemployment spell established in the Great Recession. But for now, with all the recovery going around, the unemployed are becoming longer and longer-term unemployed.

Not exactly a picture of robust health being restored in the U.S. labor markets.

2/4/21: U.S. New Unemployment Claims

Continuing with the coverage of core statistics for the U.S. labor markets performance. This post covers new unemployment claims through March 20, 2021, with the last two weeks of data being preliminary estimates.

In the week through March 20, 2021, new unemployment claims fell to 656,789, or four weeks running total of 2,892,799 dipping below the peak of the Great Recession levels of 4 weeks total of 3,313,000. This is the good news.


The bad news is that latest reading would rank 58th worst in the history of the weekly series, if we are to exclude the Covid19 period. Another part of the bad news is that last week's weekly rate of decline of 100,412, the fastest rate of decline in four weeks, is actually slower than average weekly rate of decline for the pandemic period. 


4 weeks running average rate of improvement in new unemployment claims is just 14,943. Which means that at this rate of labor market improvements, it will take 30.6 weeks to regain pre-Covid lows of new claims.

Things are improving. But they are improving at less than impressive rates.


Note:


2/4/21: U.S. Non-Farm Payrolls

 In the first part of the series of updates on the U.S. labor markets, I covered continued unemployment claims (https://trueeconomics.blogspot.com/2021/04/2421-us-continued-unemployment-claims.html), followed by the second post covering labor force participation and employment-to-population ratio (https://trueeconomics.blogspot.com/2021/04/2421-us-labor-force-participation-and.html).

Now, consider total non-farm payrolls - a measure of jobs present in the economy:


Total non-farm payrolls rose in march 2021 to 143,400,000, up on 142,077,000 in February. However, the increase still leaves the payrolls 9,777,000 short of the pre-Covid19 highs. The rate of jobs addition rose in March to 1,323,000 from February growth rate of 1,097,000. Combined jobs expansions of February and March, however, are not sufficient to cover the jobs losses of 2,622,000 sustained in January 2021. Average monthly jobs recovery during the pandemic period is 1,195,000, which means that it will take ca 8 months at the average rate of jobs creation for the economy to regain its pre-Covid19 highs in jobs numbers.


Thursday, February 4, 2021

4/2/21: U.S. Labor Markets: America's Scariest Charts, Part 6

 Having covered some core stats relating to the U.S. labor markets in previous 5 posts:

  1. Continued Unemployment Claims (https://trueeconomics.blogspot.com/2021/02/4221-us-labor-markets-americas-scariest.html);
  2. Labor force participation rate and Employment-to-Population ratio (https://trueeconomics.blogspot.com/2021/02/4221-us-labor-markets-americas-scariest_4.html); 
  3. Non-farms payrolls (https://trueeconomics.blogspot.com/2021/02/4221-us-labor-markets-americas-scariest_16.html); 
  4. New (initial) unemployment claims data through January 30, 2021 (https://trueeconomics.blogspot.com/2021/02/4221-us-labor-markets-americas-scariest_57.html); and
  5. Average duration of unemployment (https://trueeconomics.blogspot.com/2021/02/4221-us-labor-markets-americas-scariest_41.html),
in this last post, we will focus on the overall employment index for the current recessionary cycle:


Currently, into month 10 data of the recession (December 2020), and employment index is reading close to the conditions in the recession of 1945, but better than the recession of 1953. We are still trending worse than any recession in modern period (post-Gold Standard), and that is quite an achievement (in negative terms). Dynamically, improvements in employment conditions have been flattening out from month 5 of the recession through month 8 and index improvements have slowed down to almost nil in months 9 and 10. Unless there is a significant reversal in this trend, by the end of 2021 we are likely to be around the same labor markets conditions as at the same time during the Great Recession. 

4/2/21: U.S. Labor Markets: America's Scariest Charts, Part 5

 The first four posts on the state of the U.S. labor markets have covered:

  1. Continued Unemployment Claims (https://trueeconomics.blogspot.com/2021/02/4221-us-labor-markets-americas-scariest.html);
  2. Labor force participation rate and Employment-to-Population ratio (https://trueeconomics.blogspot.com/2021/02/4221-us-labor-markets-americas-scariest_4.html); 
  3. Non-farms payrolls (https://trueeconomics.blogspot.com/2021/02/4221-us-labor-markets-americas-scariest_16.html); and
  4. New (initial) unemployment claims data through January 30, 2021 (https://trueeconomics.blogspot.com/2021/02/4221-us-labor-markets-americas-scariest_57.html)
In this post, let's take a look at the latest data on average duration of unemployment through December 2020:


As the chart above clearly shows, current average duration of unemployment spell is already higher than the peak of any prior recession other than the Great Recession. However, the duration remains relatively benign when we control for the business cycle (red line and the chart next).


Dynamically, it is hard to imagine average duration of unemployment to be staying around its current levels. Something to watch in months to come as an indicator of the direction of structural (as opposed to cyclical) unemployment. 


4/2/21: U.S. Labor Markets: America's Scariest Charts, Part 4

 The first three posts on the state of the U.S. labor markets have covered:

  1. Continued Unemployment Claims (https://trueeconomics.blogspot.com/2021/02/4221-us-labor-markets-americas-scariest.html);
  2. Labor force participation rate and Employment-to-Population ratio (https://trueeconomics.blogspot.com/2021/02/4221-us-labor-markets-americas-scariest_4.html); and
  3. Non-farms payrolls (https://trueeconomics.blogspot.com/2021/02/4221-us-labor-markets-americas-scariest_16.html)
In this post, let's take a look at new unemployment claims data through the week of January 30, 2021:


The data confirms the worrying trends cited in reference to continued unemployment claims. In the last week of January 2021, based on preliminary estimates published today, initial unemployment claims stood at 816,247 - a decline of just 23,525 on prior week reading. The 4-weeks cumulative initial unemployment claims are at 3,744,581, which only 103.433 down on prior 4 weeks period. Net, over the last 5 weeks, the reduction in initial unemployment claims stands at a miserly 19,725. 

Despite little media coverage, the U.S. labor markets remain stricken by the pandemic effects on economic activity. If we strip out data for the pandemic period-to-date, the latest weekly reading for initial unemployment claim ranks as the 10th highest in the history of the series. 


4/2/21: U.S. Labor Markets: America's Scariest Charts, Part 3

 In two prior posts, I covered two of America's Scariest Charts:

  1. Continued Unemployment Claims (https://trueeconomics.blogspot.com/2021/02/4221-us-labor-markets-americas-scariest.html) and 
  2. Labor force participation rate and Employment-to-Population ratio (https://trueeconomics.blogspot.com/2021/02/4221-us-labor-markets-americas-scariest_4.html)
Here, let's take a look at non-farm payrolls that measure employment levels in the economy.


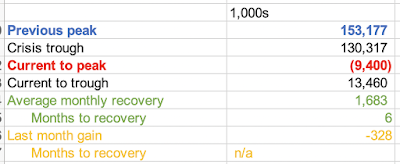
In December 202, employment growth stalled. In fact, non-farm payrolls fell 328,000 in the last month of 2020 to 143,777,000, or 9,400,000 below pre-pandemic peak. December was the first month of declines in employment since April 2020, but employment growth was relatively slow already in November when the U.S. economy added 603,000 jobs, the slowest pace of recovery after July for the entire period of recovery of May-November 2020.

This evidence further reinforces the argument that labor markets conditions in the U.S. remain abysmal, prompting American workers to slip out of the labor force. 

Wednesday, January 6, 2021

6/1/21: BRIC: Composite Economic Indicators: 4Q 2020

Now, Composite PMIs:
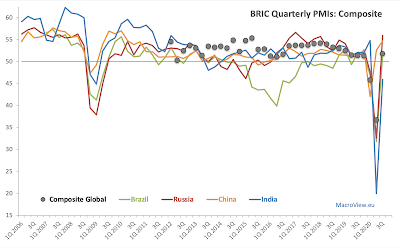
  • Brazil Composite PMI rose from 51.6 in 3Q 2020 to 54.4 in 4Q 2020, marking second consecutive quarter of > 50.0 readings. Average 4 quarters PMI stands at 46.2, suggesting that Brazil's economy has not, yet, recovered fully from the Covid19 pandemic impact. Nonetheless, statistically, both 3Q and 4Q readings are signaling economic expansion and 4Q growth in Brazil's economy appears to be faster-paced than global (global composite PMI was at 53.3 in 4Q 2020).
  • Russia Composite PMI is in a contraction territory, with 4Q 2020 reading of 47.7, down from 55.9 in 3Q 2020. Over the course of 2020, Russia Composite PMI averaged 46.0, the second weakest in the BRICs group. At 47.7, 4Q 2020 PMI is exactly in line with 1Q 2020 PMI.
  • India Composite PMI rose from 45.9 in 3Q 2020 to 56.4 in 4Q 2020, signaling rapid bounce back in the economy, that, nonetheless continues to suffer from the pandemic-induced economic crisis. Full year 2020, Composite PMI average is at 44.3, by a distance, the lowest in the BRICs group. 
  • China Composite PMI rose from 54.7 in 3Q 2020 to 56.3 in 4Q 2020, marking third consecutive quarter of economic growth, with full year PMI averaging 51.4, suggesting that the Chinese economy has now recovered fully from the Covid19 pandemic impact. 

Overall, three out of four BRIC economies posted 4Q 2020 Composite PMI above Global Composite PMI: Brazil, India and China, with Russia being the only BRIC economy posting both sub-Global and sub-50 Composite PMI reading at the end of 2020. Only one BRIC economy has, so far, signaled full recovery from the Covid19 crisis shock: China, with all other BRICs still recovering from the pandemic.

Given that both BRIC Manufacturing Sector Activity Index (54.9 in 4Q 2020) and BRIC Services Sector Activity Index (54.8 in 4Q 2020) are above Global Manufacturing (53.5) and Services (52.3) PMIs, BRIC economies as a group have supported global economic growth to the upside in 4Q 2020. In contrast, BRIC Manufacturing Activity Index outperformed Global Manufacturing PMI in 3Q 2020 (53.0 to 51.6), while BRIC Services Activity Index (51.0) underperformed Global Services PMI (51.4). 

6/1/21: BRIC: Services PMIs: 4Q 2020


BRIC's manufacturing PMIs for 4Q 2020 were covered here: https://trueeconomics.blogspot.com/2021/01/4121-bric-manufacturing-pmis-4q-2020.html. Now, to Services PMIs:

  • Brazil Services PMI rose from 47.5 in 3Q 2020 to 51.4 in 4Q 2020, with aggregate 2020 levels of activity still significantly below 2019 levels. At 51.4, the index is barely statistically above 50.0 (95% confidence bound is 51.3). However, the latest quarterly reading is the first nominally above 50.0 after three consecutive quarters of sub-50 readings. 
  • Russia Services PMI crashed in 4Q 2020 from 56.8 in 3Q to 47.7. Statistically, Russian services sector is contracting and it is contracting rapidly. In the entire 2020, there were three quarters of deeply sub-50 readings against one quarter of above 50.0 expansion. Services sector reading is basically identical to 47.6 recorded in Manufacturing sector, which means that in 4Q 2020 there was no 'comfort zone' in the Russian economy in terms of growth.
  • India Services PMI rose significantly in 4Q 2020 compared to 3Q 2020, from 41.9 to 53.4.  However, this growth is unlikely to bring India's services activity anywhere near pre-Covid19 levels. 
  • China Services PMI rose for the third consecutive quarter in 4Q 2020. In 2Q 2020, China's Services PMI was at 52.6, which increased to 54.3 in 3Q 2020 and to 57.0 in 4Q 2020. Nonetheless, it is still doubtful that Chinese services activities have fully recovered from the pandemic as of the end of 2020.
  • Overall, BRIC Services Activity Index based on PMIs and respective GDP shares in the global economy rose for the second quarter in a row from 51.0 in 3Q 2020 to 54.8 in 4Q 2020. This marks some recovery from the Covid19 pandemic impact, although this recovery remains incomplete. BRICs have - as a group - outperformed Global Services PMI which rose from 51.4 in 3Q 2020 to 52.3 in 4Q 2020.

Monday, January 4, 2021

4/1/21: BRIC: Manufacturing PMIs 4Q 2020

Latest data for BRIC Manufacturing PMIs indicates three countries outperforming global rate of recovery in manufacturing sector, against one country (Russia) remaining in contraction territory and well below global growth mark.


On a quarterly basis,

  • Brazil's Manufacturing PMI stood at 64.1 in 4Q 2020, up on 62.6 in 3Q 2020, marking the second highest and the highest reading on record. The contraction in 2Q 2020 (with PMI at 42.0) was sharp, but not as sharp as in 1Q 2009. By these comparatives, GFC-related contraction of 2008-2009 resulted in 4 quarters average reading of 45.1 and saw three consecutive sub-50 readings. The Covid-19 related contraction was stretched only across one quarter, with 4 quarters average of 54.8 in 2020. It is, genuinely, hard to reconcile these numbers with reality of the Covid-19 crisis.
  • Russia Manufacturing PMI slipped to 47.6 in 4Q 2020 from 49.5 in 3Q 2020, marking sixth consecutive quarter of sub-50 readings. Statistically, Russian Manufacturing posted no growth (> 50 readings) in seven consecutive quarters. Over 2020 as a whole, Russian PMIs averaged abysmal 46.0, compared to the GFC and the Great Recession average of 2008-2009 of 44.7.
  • India Manufacturing PMI was at 57.2 in 4Q 2020, up on 51.6 in 3Q 2020, and averaging 49.5 for the year as a whole. During the GFC and the Great Recession period, India's PMI averaged at 51.1. Unlike Brazil, India is yet to recover to pre-Covid-19 levels of activity.
  • China Manufacturing PMI finished 2020 with a reading of 53.9, averaging 51.1 over 2020 as a whole, with overall PMIs performance suggesting that Chinese industrial producers have recovered from the Covid-19 pandemic by the end of 2020. China's Covid-19 experience has been more benign than the country contraction during the GFC and the Great Recession (46.9 average).
Global Manufacturing PMI stood at 53.5 in 4Q 2020 and an average of 49.3 over 2020 as a whole, against BRIC's Manufacturing Index (weighted by relative global GDP shares of the four economies) at 54.9 in 4Q 2020 and 50.5 for 2020 as a whole. In other words, BRICs have supported global growth to the upside during the Covid-19 pandemic. 

Saturday, November 7, 2020

7/11/20: BRIC: Composite Economic Indicators for October

 I covered BRIC Manufacturing and Services PMIs for October in two earlier posts (see here https://trueeconomics.blogspot.com/2020/11/51120-bric-services-pmis-october.html), so now, Composite PMIs:


  • Brazil Composite PMI rose to 55.9 in October, compared to 51.6 in 3Q 2020, and currently sits above Global Composite PMI of 53.3. The latest increase in PMI is a robust signal of partial recovery, marking the third consecutive month of > 50.0 readings that followed five consecutive months of contraction. 
  • Russia Composite PMI was the weakest of all BRIC PMIs, falling to 47.1 in October, compared to 55.9 in 3Q 2020, and marking the first sub-50 reading in four months.
  • India Composite PMI was the strongest amongst the BRIC PMIs rising to 58.0 in October against 45.9 in 3Q 2020. Overall, Indian economy is only starting to inch out of the recession that was marked by two consecutive quarters of sharply contractionary PMIs.
  • China Composite PMI posted an increase to 55.7 in October relative to 54.7 in 3Q 2020, marking the start of the third quarter of growth. Overall, the latest reading indicates that Chinese economy has completed its recovery from 1Q 2020 recession.
Overall, BRIC Manufacturing indicator (55.2 in October, compared to 53.0 in 3Q 2020) and Services indicator (54.9 in October, compared to 51.0 in 3Q 2020) have posted better performance than their Global counterparts (53.0 and 52.9, respectively for October). BRIC Manufacturing indicator is now outperforming Global Manufacturing PMI in 8th consecutive quarters, and BRIC Services indicators is running above Global Services PMI for the first time after posting poorer performance in 3Q 2020.

Thursday, November 5, 2020

5/11/20: BRIC: Services PMIs October

In the earlier post, I covered BRIC economies manufacturing PMIs for October: https://trueeconomics.blogspot.com/2020/11/31120-bric-manufacturing-pmis-october.html. Now, leet's take a look at Services PMI.


As the chart above illustrates:
  • Brazil Services PMI rose from 47.5 in 3Q 2020 to 52.3 in October. Prior to October, Brazil's services sector was in a contractionary territory for three consecutive quarters. October marks the second month of above 50.0 readings, although statistically-speaking, September reading was indistinguishable from 50.0 stagnation / zero growth level.
  • Russian Services PMI posted a sharp contraction, falling from 56.8 in 3Q 2020 to 46.9 in October. Russia enjoyed just three months of > 50.0 readings in July-September 2020, implying that the economy is nowhere near a V-shaped recovery from the pandemic and that things are getting worse, not better in the services sectors. Even worse dynamics apply to Manufacturing where Russia has not seen sustained > 50 readings since March 2019.
  • India Services PMI rose to 54.1 in October, marking the first month of above 50.0 readings since February 2020. Given cumulative nature of the PMIs, October rebound is nowhere near being sizeable enough to start closing the pandemic-induced drop-off in economic activity. India's services have now posted seven months of contraction in 2020, compared to four months for Manufacturing. October marks the first month since February with both indices above 50.0.
  • Chinese Services PMI rose to 56.8 in October, compared to 54.8 in September, marking 6th consecutive month of both Manufacturing and Services PMIs above 50.0 line. 
Overall, BRIC Services Activity Index (a measure of Services sectors activity calculated by me based on monthly Markit PMI data and country-specific share of the world GDP, PPP-adjusted) rose to 54.9 in October compared to 51.0 in 3Q 2020, marking a second month of > 50.0 readings and accelerating growth momentum. October BRIC reading is in excess of the Global Services PMI reading of 52.9, implying that as a group, BRIC economies are contributing positively to global economic growth momentum, although both Brazil and Russia are pushing BRIC reading down, compared to Global Services PMI.

Tuesday, November 3, 2020

3/11/20: BRIC: Manufacturing PMIs October

 BRIC's manufacturing PMIs are out for October, marking the start of Q4 2020. Overall, the results reinforce Q3 2020 trends highlighted here: https://trueeconomics.blogspot.com/2020/10/141020-bric-manufacturing-pmis-q3.html


  • Brazil posted further acceleration in the recovery momentum with Manufacturing PMI rising to 66.7 from 3Q 2020 62.6. 3Q 2020 was the historical record quarter for Brazil's Manufacturing PMI readings. Brazil's Manufacturing PMIs have now strengthened every month since May 2020, the last month of sub-50 readings.
  • In contrast to Brazil, Russia Manufacturing PMI slipped again in October, hitting a 5-months low at 46.9, down from 48.9 in September and well below already poor 49.5 reading for 3Q 2020. Prior to 4Q 2020, Russia clocked five consecutive quarters of Manufacturing PMIs below 50.0 mark.
  • China Manufacturing PMI rose from 53.0 in 3Q 2020 to 53.6 in October. China's latest reading is on-trend, with rising PMIs for the third quarter in a row. 
  • India Manufacturing PMI stood at 51.6 in 3Q 2020 and this improved to 58.9 in October, marking a major acceleration in growth conditions. 
  • Three of the BRIC economies have posted October Manufacturing PMI readings more robust than Global PMI reading of 53.0. Thus, overall BRIC Manufacturing activity index stood at 55.2 in October, well ahead of 53.0 reading for 3Q 2020. The last time BRIC Manufacturing activity index was below that of the Global Manufacturing PMI was 4Q 2018.
  • Russia was the only BRIC economy to continue posting recessionary PMI reading in its manufacturing sector. 

Saturday, October 24, 2020

24/10/20: America's Scariest Charts: Duration of Unemployment & Employment Index

Two previous posts covered some core labor markets data for the U.S.:

Here, let's take a look at the weekly (higher frequency) data unemployment claims.

First, initial unemployment claims, with data coverage through the week of October 17th:


The above chart shows 1-month cumulative initial unemployment claims, smoothing some of weekly volatility in the series.

Current reading stands at 3,194,750 which is above the 2008-2011 crisis peak of 3,169,786 and only slightly below all-time pre-COVID19 high of 3,313,000 attained in January 1975.

In absolute level numbers, preliminary first-time claims for the week of October 17, 2020 stand at 756,617 which is still 3 times the rate of first-time claims filings in the last week before COVID19 pandemic onset (March 14, 2020). The good news is, preliminary estimate for the new claims for the week of October 17 suggest a decline in new claims filings of 73,125 on week prior - the fastest rate of reductions in 10 weeks. However, overall average weekly decline in first-time claims over the last 10 weeks has been rather unimpressive at 8,212. At this rate of improvement, it will take almost 62 weeks to draw current first-time claims down to the levels seen in the last pre-COVID19 week.


In line with the crisis timing, average duration of unemployment is climbing up, too:


Based on monthly data through September 2020, average duration of unemployment is about to hit pre-crisis average in October. This sounds like a good thing, until you realise that the duration of unemployment fell to historically low levels as COVID19 crisis unfolded because of the unprecedented rate of jobs losses and unemployment claims increases (see net chart below). It remains to be seen how it will behave in months ahead. 

Past three recessions have been associated with increasing average duration of unemployment through recovery periods. They have also been associated with longer periods of elevated duration. In fact, in the last three recessions, average duration of unemployment never reached pre-recession levels, implying that long-term unemployment got worse in every recovery period since 1990 on. If this trend is consistent with the COVID19 recession, U.S. long term unemployment duration will rise once again. 


For the last chart, consider employment index dynamics though September 2020:


Despite the headline 'historically fast' recovery, actual employment remains in dire state, with current dynamics through September 2020 indicating the third worst employment performance in the history of the modern economy. Based on the 3-months average gains in seasonally-adjusted employment, it will take us another 8 moths before we regain pre-crisis peak employment levels, implying the 5th fastest recovery in employment in history. Based on September rate of improvement, the process will take another 16 months, which would make the current recovery the fifth slowest on record. Based on the dynamics of change in the jobs recovery since May 2020, we can expect the jobs recession to last 45 months, which would make it the 3rd worst recession in history. So far, the average rate of decline in the jobs gained per month during the recovery is 15% per month. 

In the Great Recession, it took the economy 76 weeks to recover from trough of the recession to pre-recession peak employment. The average monthly rate of recovery from the trough until regaining pre-recession peak was 0.128% per month. This would put the month when we would recover from the COVID19 pandemic to July 2025, making the COVID19 pandemic a second worst recession in history after the Great Recession.

24/10/20: America's Scariest Charts: Non-farm Payrolls

In the previous post, I covered data for the U.S. Labor Force Participation and Employment to Population Ratios (see https://trueeconomics.blogspot.com/2020/10/241020-us-labor-force-participation.html). Now, let's update the data for Total Nonfarm Payrolls through September:


At the end of September, total non-farm payrolls stood at 141,855,000 - up 1,137,000 on August, and still down 11,322,000 on pre-COVID19 peak. We are now just over half-way to the recovery from COVID19 trough of 130,317,000 reached in April 2020. Since reaching trough, non-farm payrolls rose, on average, at a monthly rate of 2,308,000, which means that the latest increase over the month of September has been substantially slower than the average rate of recovery. 

At September rate of jobs recovery, it will take us almost 10 months to regain pre-COVID19 peak. 

Current levels of payrolls are consistent with February 2016 levels, implying that even after we are still missing some 4.5 years worth of jobs creation. 

Here is a genuinely scary table, highlighting the fact that in the COVID19 pandemic, the U.S. sustained jobs losses of the combined magnitude equivalent to those suffered in all recessions from 1980 through the Great Recession:


And while the recovery is clearly under way, broader indicators of the jobs markets trends are still pointing to a horrific aftermath of the first of this pandemic, with the second wave now in full swing (see more on this here: https://trueeconomics.blogspot.com/2020/10/231020-covid19-update-us-vs-eu27.html


Wednesday, October 14, 2020

14/10/20: BRIC: Composite economic activity indicators Q3 results


We covered in detail strong recovery in BRIC Manufacturing PMIs (https://trueeconomics.blogspot.com/2020/10/141020-bric-manufacturing-pmis-q3.html) and fragile recovery in Services PMIs (https://trueeconomics.blogspot.com/2020/10/141020-bric-services-pmis-q3-results.html). Here is a summary chart:


Now, let's take a look at BRIC Composite PMIs for 3Q 2020:

Brazil Composite PMI ended Q3 2020 on a reading of 51.6 - an improvement on 31.8 in 2Q 2020. Brazil's Composite PMIs have run sub-50 recessionary reading in 1Q and 2Q 2020, returning to growth in 3Q 2020, albeit at the levels not consistent with a V-shaped recovery.

Russia Composite PMI stood at a strong 55.9 reading in 3Q 2020, up on 32.6 in 2Q 2020 and signaling an end to 2 consecutive quarters of sub-50 readings. This marks the fastest pace of growth since 1Q 2017, but is also consistent with the levels of current activity being still below pre-COVID19 pandemic period. 

India Composite PMI remained in recessionary territory in 3Q 2020 at 45.9, an improvement on 19.9 in 2Q 2020. Overall, Indian economy has suffered the sharpest hit from the pandemic, compared to all other BRICs. It is continuing to exhibit recessionary dynamics to-date. 

China Composite PMI ended 3Q 2020 at 54.7, marking the second consecutive quarter of recover (2Q 2020 reading was 52.6). 3Q 2020 reading is the highest since 1Q 2020, and suggests that the Chinese economy is getting close to recovery in its activity levels to pre-pandemic position. 

Overall, BRIC block activity indices imply lagging momentum in the recovery in services, and faster than global pace of recovery in manufacturing. Statistically, BRIC growth momentum in 3Q 2020 is within historical average, however, growth dynamics in 1Q and 2Q 2020 were significantly below historical averages, which implies that 3Q 2020 PMIs indicate incomplete or only partial recovery in the BRIC economies post-pandemic so far.


14/10/20: BRIC: Services PMIs Q3 results


BRIC Manufacturing has rebounded strongly from thee pandemic lows, as covered in this post here: https://trueeconomics.blogspot.com/2020/10/141020-bric-manufacturing-pmis-q3.html. Services PMI for the BRIC economies signal similar, albeit weaker rebound in July-September:


Brazil Services PMI stayed in the recession territory in 3Q 2020, with index reading coming in at 47.5, up on 30.3 in 2Q 2020, but still marking a third consecutive quarter of sub-50 readings. Put simply, unlike manufacturing that is showing rather incredible signs of the recovery, Brazil's services sectors continue to show ongoing contraction, building on 6 consecutive months of contracting activity through August 2020. September monthly reading at 50.4 is statistically indistinguishable from zero growth line of 50.0. In summary, Brazil's services sector is not in a recovery so far.

Russia Services PMI posted very strong recovery signals in 3Q 2020, although September reading slipped to 53.7 (fast growth) from blistering 58.5 and 58.2 in July and August, respectively. 3Q 2020 Russia Services PMI was at 56.8 marking a sharp turnaround from 36.0 in 2Q 2020. This is the fastest pace of quarterly expansion since 1Q 2017.

India Services PMI remains in contraction, with 3Q 2020 reading of 41.9, an improvement on sharper rates of deterioration in 2Q 2020 at 17.2. September marked seventh consecutive month of sub-50 readings in Services sector in India.

China Services PMI came in at 54.3 in 3Q 2020, up on 52.6 in 2Q 2020, marking second consecutive quarter of recovery from the pandemic lows of 1Q 2020 when the index fell to 40.4. 

Overall, BRIC Services Activity Index - an index compiled by me based on GDP shares and Markit monthly PMI data - rose from 40.4 in 2Q 2020 to 51.0 in 3Q 2020. Given the nature of PMIs as signals of monthly changes in activity, 3Q 2020 reading is consistent with the BRIC block services sectors recovering only partially from the pandemic lows. BRIC Services Activity Index ended 3Q 2020 at the levels slightly below the Global Services PMI which stood at 51.4. Global services sectors are also showing more rapid rate of quarterly recovery, rising from 35.6 in 2Q 2020 to 51.4 in 3Q 2020.


14/10/20: BRIC: Manufacturing PMIs Q3 results


BRIC - Brazil, Russia, India and China - economies have posted a significant improvement in Q3 Purchasing Managers Indices in Manufacturing sector:


Brazil Manufacturing PMI rose to 62.6 - the highest on record in 3Q 2020 following 42.0 recessionary reading in 2Q 2020. This is a massive rebound from pandemic lows, and the level of 3Q reading puts into question validity or accuracy of the surveys. On a monthly basis, the index was at 64.7 and 64.9 in August and September. Brazil's manufacturing index was at sub-50 readings in March-May 2020, with a reasonably credible rebound in June and July. August and September readings are literally out of the ball park, both in terms of historical comparatives and in terms of past turning points from recessions to expansions. 

Russia Manufacturing PMI treaded water in 3Q 2020, swinging from 48.4 in July to 51.1 in August and back to 48.9 in September. As the result, Russia posted sub-50 reading for 3Q 2020 at 49.5, the only BRIC economy in this position. This marks 5th consecutive quarter of sub-50 PMIs. Statistically,  the last time Russian manufacturing was in the expansion territory was in 1Q 2019. 

India Manufacturing PMI rose strongly in Q3 2020 to 51.6, well above 35.1 recession trough in Q2 2020. However, statistically, current reading signals relatively weak recovery. September monthly index came in at more robust 56.8, suggesting that the economy may be gathering some momentum and recovery may be accelerating. 

China Manufacturing PMI was basically unchanged at 53.0 in September compared with 53.1 in August. 3Q 2020 PMI is at 53.0, which is an improvement on statistically zero growth reading of 50.4 in 2Q 2020. China's Manufacturing PMI numbers are historically less volatile, so 53.0 marks the fastest pace of expansion since 4Q 2010.

Overall, GDP-weighted BRIC Manufacturing Activity Index stood at 53.0 in 3Q 2020, above the Global Manufacturing Index (51.6) and up on 45.0 in 2Q 2020.