Showing posts with label #economics. Show all posts

Sunday, June 6, 2021

5/6/21: Ireland PMIs for May: Booming Growth and Inflation Signals

 Both inflationary pressures and economic activity indicators are going through the roof in May, signaling a roaring run for 2Q 2021 growth. 

  • Manufacturing PMI for Ireland is up at 64.1 in May, compared to 60.8 in April. This is a historical high for the series, for the second month in a row.
  • Services PMI for Ireland moved up from April's 57.7 to May reading of 62.1. This marks third consecutive month of above 50 readings, with all of these being statistically above 50.0 line. 
  • Construction Sector PMI (data through mid-May) improved, but remains (at 49.3) still in the contracting activity territory. 
  • Markit's Composite PMI, based on Manufacturing and Services sectors activity indices, rose from 58.1 in April 2021 to 63.5 in May, setting a new all time high. Again, this is the third consecutive month of above 50.0 readings for the Composite PMI.
The chart above plots my own 3-Sectors Activity Index which is based on all three indices reported by Mrkit and uses Value Added contributions by each sector as weights. 3-Sectors Activity Index rose from 58.69 in April to 62.58 in May, setting an all time high. 

In line with robust economic growth, we are witnessing - just as is the case around the world - continued build up of inflationary pressures. Per Markit release: "Input price inflation accelerated for the fifth successive month in May, reaching the highest since July 2008. Manufacturers continued to see much steeper increases in input prices than service providers, although the differential narrowed in the latest period. Companies passed on higher costs to customers, with output prices increasing at a record pace in May (since September 2002)." Emphasis is mine.


Monday, February 1, 2021

1/2/21: The Unbearable Lightness of Winning?

My recent article for The Currency on some tight corners to be navigated by the Biden-Harris Administration as the Democrats grapple with controlling the two branches of the State: https://thecurrency.news/articles/33887/biden-harris-and-the-unbearable-lightness-of-winning/ 


Wednesday, January 6, 2021

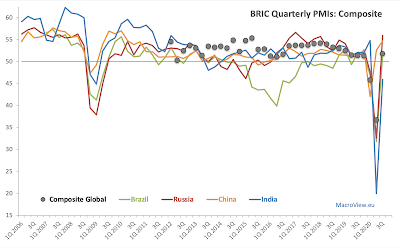
6/1/21: BRIC: Composite Economic Indicators: 4Q 2020

Now, Composite PMIs:
  • Brazil Composite PMI rose from 51.6 in 3Q 2020 to 54.4 in 4Q 2020, marking second consecutive quarter of > 50.0 readings. Average 4 quarters PMI stands at 46.2, suggesting that Brazil's economy has not, yet, recovered fully from the Covid19 pandemic impact. Nonetheless, statistically, both 3Q and 4Q readings are signaling economic expansion and 4Q growth in Brazil's economy appears to be faster-paced than global (global composite PMI was at 53.3 in 4Q 2020).
  • Russia Composite PMI is in a contraction territory, with 4Q 2020 reading of 47.7, down from 55.9 in 3Q 2020. Over the course of 2020, Russia Composite PMI averaged 46.0, the second weakest in the BRICs group. At 47.7, 4Q 2020 PMI is exactly in line with 1Q 2020 PMI.
  • India Composite PMI rose from 45.9 in 3Q 2020 to 56.4 in 4Q 2020, signaling rapid bounce back in the economy, that, nonetheless continues to suffer from the pandemic-induced economic crisis. Full year 2020, Composite PMI average is at 44.3, by a distance, the lowest in the BRICs group. 
  • China Composite PMI rose from 54.7 in 3Q 2020 to 56.3 in 4Q 2020, marking third consecutive quarter of economic growth, with full year PMI averaging 51.4, suggesting that the Chinese economy has now recovered fully from the Covid19 pandemic impact. 

Overall, three out of four BRIC economies posted 4Q 2020 Composite PMI above Global Composite PMI: Brazil, India and China, with Russia being the only BRIC economy posting both sub-Global and sub-50 Composite PMI reading at the end of 2020. Only one BRIC economy has, so far, signaled full recovery from the Covid19 crisis shock: China, with all other BRICs still recovering from the pandemic.

Given that both BRIC Manufacturing Sector Activity Index (54.9 in 4Q 2020) and BRIC Services Sector Activity Index (54.8 in 4Q 2020) are above Global Manufacturing (53.5) and Services (52.3) PMIs, BRIC economies as a group have supported global economic growth to the upside in 4Q 2020. In contrast, BRIC Manufacturing Activity Index outperformed Global Manufacturing PMI in 3Q 2020 (53.0 to 51.6), while BRIC Services Activity Index (51.0) underperformed Global Services PMI (51.4). 

6/1/21: BRIC: Services PMIs: 4Q 2020


BRIC's manufacturing PMIs for 4Q 2020 were covered here: https://trueeconomics.blogspot.com/2021/01/4121-bric-manufacturing-pmis-4q-2020.html. Now, to Services PMIs:

  • Brazil Services PMI rose from 47.5 in 3Q 2020 to 51.4 in 4Q 2020, with aggregate 2020 levels of activity still significantly below 2019 levels. At 51.4, the index is barely statistically above 50.0 (95% confidence bound is 51.3). However, the latest quarterly reading is the first nominally above 50.0 after three consecutive quarters of sub-50 readings. 
  • Russia Services PMI crashed in 4Q 2020 from 56.8 in 3Q to 47.7. Statistically, Russian services sector is contracting and it is contracting rapidly. In the entire 2020, there were three quarters of deeply sub-50 readings against one quarter of above 50.0 expansion. Services sector reading is basically identical to 47.6 recorded in Manufacturing sector, which means that in 4Q 2020 there was no 'comfort zone' in the Russian economy in terms of growth.
  • India Services PMI rose significantly in 4Q 2020 compared to 3Q 2020, from 41.9 to 53.4.  However, this growth is unlikely to bring India's services activity anywhere near pre-Covid19 levels. 
  • China Services PMI rose for the third consecutive quarter in 4Q 2020. In 2Q 2020, China's Services PMI was at 52.6, which increased to 54.3 in 3Q 2020 and to 57.0 in 4Q 2020. Nonetheless, it is still doubtful that Chinese services activities have fully recovered from the pandemic as of the end of 2020.
  • Overall, BRIC Services Activity Index based on PMIs and respective GDP shares in the global economy rose for the second quarter in a row from 51.0 in 3Q 2020 to 54.8 in 4Q 2020. This marks some recovery from the Covid19 pandemic impact, although this recovery remains incomplete. BRICs have - as a group - outperformed Global Services PMI which rose from 51.4 in 3Q 2020 to 52.3 in 4Q 2020.

5/1/21: Ireland PMIs: 4Q 2020

Ireland's economic activity improved significantly in December, and the improvements were marked across all three sectors:

  • Ireland's Manufacturing PMI rose 52.2 in November to 57.2 in December, marking the third consecutive month of > 50 readings, the second consecutive month of indicator being statistically above 50.0 line. The last three months average (53.23) is on 2Q 2020 average (53.30) and this is pretty encouraging, given the weakness in the indicator over 1H 2020. 
  • Ireland's Services PMI also rose in December, reaching 50.1 from recessionary 45.4 in November. 4Q average is still weak at 47.9 (contractionary) after being effectively stagnant at 50.03 over 3Q 2020. Monthly increase in December, however, is a brighter spot.
  • Ireland's Construction sector PMI (data through mid-December) is at 53.5, which is strong compared to month prior (48.6) and the first time the index is above 50 line since July 2020. 
  • Official Composite PMI that accounts only for two sectors of activity (Manufacturing and Services) is now at 53.4, having broken above the 50.0 line for the first time since August 2020.

As you know,  I calculate my own index of economic activity based on all three sectors PMIs and using relative weights of each sector in Irish Gross Value Added, based on the latest National Accounts data. This is plotted against Markit's Composite PMI in the following chart:

Just as Composite PMI, my index of economic activity also rose in December (to 52.9) from 48.2 in November. This marks the first month of above-50 readings after 3 consecutive months of contraction. Nonetheless, 4Q 2020 index is at 50.03 - signaling zero growth q/q and this stands contrasted to 3Q 2020 reading of 51.2 (statistically zero growth, nominally, weak positive growth).

Thursday, December 3, 2020

3/12/20: Ireland PMIs: November


Ireland PMIs are out for November and they show the impact of the re-amplification of COVID19 impacts on the economy.

Services PMI fell from 48.3 in October to 45.4 in November, the lowest reading in 5 months and the third consecutive monthly reading sub-50. The pandemic period average is now at 39.3.

Meanwhile, Manufacturing PMI rose from 50.3 in October to 52.2 in November, marking the second consecutive month of readings above 50.0 mark. Pandemic period average is now at 48.2. 

Construction sector PMI (through mid-November) is at 48.6 - marking third consecutive month of sub-50 readings.

As the chart below illustrates, Manufacturing is the only sector that is providing growth momentum in the economy and much of that is down to multinationals. In services sector, activity of multinationals (which are doing well) is more than offset by continued declines in activities of domestic enterprises. 


Composite PMI posted a third consecutive month of sub-50 readings at 47.7 down from 49.0 in October. Markit's Composite PMI is calculated based on manufacturing and services indices. To rebalance the overall activity measure to include construction PMIs, I calculate my own 3-sectors index which is based on each sector contribution to Ireland's gross value added. With economic activity shifting toward manufacturing during the Covid19 pandemic, this index is becoming more weighted to reflect manufacturing sector PMI, hence the 3-sectors index rose in November to 50.2 from 49.7 in October.


Overall, the PMIs and my 3-sectors index are all pointing to entrenchment of the Covid19 pandemic headwinds in the Irish economic activity in November. 


Tuesday, November 17, 2020

17/11/20: U.S. households: Debt Hostages to the Washington

Massive stimulus deployed in Q2 2020 has lifted substantially aggregate household incomes. Meanwhile, lower interest rates have boosted debt affordability, while new demand for credit collapsed. All of which means that, at least through 2Q 2020, U.S. households enjoyed some really dramatic reduction in the burden of debt:


Income boost from Government transfers in 2Q 2020 was so large, it took household debt to income ratio down by a whooping 3 years in just one quarter, with the ratio currently at the levels last seen in the second half of 1998, moving exactly 3 years from Q3 2001 levels where they stood at the end of Q1 2020. meanwhile, actual debt levels, in US$ terms were down just $52 billion in 2Q 2020 compared to Q1 2020, a decline of only 0.26%. 

Of course, 2Q 2020 boost to incomes was a temporary measure, not related to any real economic growth and not sustainable in the longer run. A return to the pre-COVID19 levels of total debt burden relative to disposable income will shave off 1.455-1.626 percentage points off the households' disposable income net of debt servicing costs, washing out USD295-329 billion from households' budgets. Worse, following normalization of the credit markets, built up debt insolvencies delayed by the pandemic emergency measures will likely push debt to much higher levels as accumulated loans arrears get refinanced and rolled up. Assuming 5% of the loans in forbearance today, this would lead to the household income hit of USD310-346 billion. 

The twin effects of exhausted income supports and rising debt burden can see U.S. household debt burden rising to 135-136 percent of disposable income within the next 12 months.
 
All of which simply goes to show that the U.S. economy is now a complete and total hostage to monetary policy accommodation that is sustaining massive debt subsidies to the households, plus the one-off and non-sustainable income supplements.

Saturday, November 7, 2020

7/11/20: BRIC: Composite Economic Indicators for October

 I covered BRIC Manufacturing and Services PMIs for October in two earlier posts (see here https://trueeconomics.blogspot.com/2020/11/51120-bric-services-pmis-october.html), so now, Composite PMIs:


  • Brazil Composite PMI rose to 55.9 in October, compared to 51.6 in 3Q 2020, and currently sits above Global Composite PMI of 53.3. The latest increase in PMI is a robust signal of partial recovery, marking the third consecutive month of > 50.0 readings that followed five consecutive months of contraction. 
  • Russia Composite PMI was the weakest of all BRIC PMIs, falling to 47.1 in October, compared to 55.9 in 3Q 2020, and marking the first sub-50 reading in four months.
  • India Composite PMI was the strongest amongst the BRIC PMIs rising to 58.0 in October against 45.9 in 3Q 2020. Overall, Indian economy is only starting to inch out of the recession that was marked by two consecutive quarters of sharply contractionary PMIs.
  • China Composite PMI posted an increase to 55.7 in October relative to 54.7 in 3Q 2020, marking the start of the third quarter of growth. Overall, the latest reading indicates that Chinese economy has completed its recovery from 1Q 2020 recession.
Overall, BRIC Manufacturing indicator (55.2 in October, compared to 53.0 in 3Q 2020) and Services indicator (54.9 in October, compared to 51.0 in 3Q 2020) have posted better performance than their Global counterparts (53.0 and 52.9, respectively for October). BRIC Manufacturing indicator is now outperforming Global Manufacturing PMI in 8th consecutive quarters, and BRIC Services indicators is running above Global Services PMI for the first time after posting poorer performance in 3Q 2020.

Thursday, November 5, 2020

5/11/20: BRIC: Services PMIs October

In the earlier post, I covered BRIC economies manufacturing PMIs for October: https://trueeconomics.blogspot.com/2020/11/31120-bric-manufacturing-pmis-october.html. Now, leet's take a look at Services PMI.


As the chart above illustrates:
  • Brazil Services PMI rose from 47.5 in 3Q 2020 to 52.3 in October. Prior to October, Brazil's services sector was in a contractionary territory for three consecutive quarters. October marks the second month of above 50.0 readings, although statistically-speaking, September reading was indistinguishable from 50.0 stagnation / zero growth level.
  • Russian Services PMI posted a sharp contraction, falling from 56.8 in 3Q 2020 to 46.9 in October. Russia enjoyed just three months of > 50.0 readings in July-September 2020, implying that the economy is nowhere near a V-shaped recovery from the pandemic and that things are getting worse, not better in the services sectors. Even worse dynamics apply to Manufacturing where Russia has not seen sustained > 50 readings since March 2019.
  • India Services PMI rose to 54.1 in October, marking the first month of above 50.0 readings since February 2020. Given cumulative nature of the PMIs, October rebound is nowhere near being sizeable enough to start closing the pandemic-induced drop-off in economic activity. India's services have now posted seven months of contraction in 2020, compared to four months for Manufacturing. October marks the first month since February with both indices above 50.0.
  • Chinese Services PMI rose to 56.8 in October, compared to 54.8 in September, marking 6th consecutive month of both Manufacturing and Services PMIs above 50.0 line. 
Overall, BRIC Services Activity Index (a measure of Services sectors activity calculated by me based on monthly Markit PMI data and country-specific share of the world GDP, PPP-adjusted) rose to 54.9 in October compared to 51.0 in 3Q 2020, marking a second month of > 50.0 readings and accelerating growth momentum. October BRIC reading is in excess of the Global Services PMI reading of 52.9, implying that as a group, BRIC economies are contributing positively to global economic growth momentum, although both Brazil and Russia are pushing BRIC reading down, compared to Global Services PMI.

Wednesday, November 4, 2020

3/11/20: Ireland PMIs and Economic Activity Dynamics for October

October PMI data for Ireland is showing serious strains from the pandemic and wave 2 on the economic activity: 


  • Manufacturing PMI for October came at a recessionary 48.3, marking a moderation on rapid contraction in the sector activity in September (45.8). This marks the second consecutive month of the Manufacturing PMI reading sub-50, and follows two months of partial (at best) recovery in July and August.
  • Services sector PMI for October was at 50.3 - a statistically indifferent reading from zero growth 50.0 recorded in September.
  • Official Composite PMI was at 49.0 in October, up on 46.9 in September, but still marking a decline in economic activity for the second month in a row. 
  • Since Construction sector PMI is not published until mid-month, we only have September reading for the sector. Based on this, my three-sectors activity indicator that weighs all three sectors based on their contribution to the gross value added has rise to 49.05 from 47.48 in September:

Overall, all PMIs point to a significant weakness in the economy in September continuing into October. Keep in mind that PMIs are effectively cumulative: sub-50 reading in September implies a decline in economic activity relative to August. If this is followed by a sub-50 reading in October, the new decline is being signalled is on already diminished September activity.


Tuesday, October 27, 2020

27/10/20: Identity & Risk: My Keynote Talk

My recent keynote address to the pTools Virtual Conference 2020: Identity & Risk: Financial Services in a Time of Transformation & Uncertainty (22nd October 2020) is now available at: https://vimeopro.com/user12978768/ptools-virtual-conference-2020


Monday, October 26, 2020

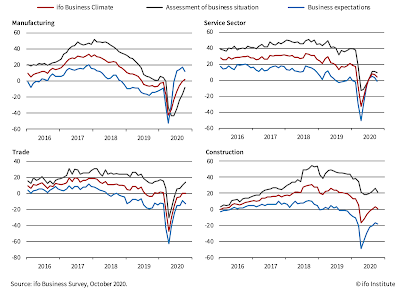
26/10/20: ifo Institute: German Economic Conditions Deteriorated in October

ifo Institute's latest Business Climate survey data for Germany is pointing to continued weakness in the recovery momentum:


Notably, all four sectors covered remain under water:


Current conditions are deteriorating month-on-month in two sectors, expectations have deteriorated in all four sectors.

Wednesday, October 14, 2020

14/10/20: BRIC: Composite economic activity indicators Q3 results


We covered in detail strong recovery in BRIC Manufacturing PMIs (https://trueeconomics.blogspot.com/2020/10/141020-bric-manufacturing-pmis-q3.html) and fragile recovery in Services PMIs (https://trueeconomics.blogspot.com/2020/10/141020-bric-services-pmis-q3-results.html). Here is a summary chart:


Now, let's take a look at BRIC Composite PMIs for 3Q 2020:

Brazil Composite PMI ended Q3 2020 on a reading of 51.6 - an improvement on 31.8 in 2Q 2020. Brazil's Composite PMIs have run sub-50 recessionary reading in 1Q and 2Q 2020, returning to growth in 3Q 2020, albeit at the levels not consistent with a V-shaped recovery.

Russia Composite PMI stood at a strong 55.9 reading in 3Q 2020, up on 32.6 in 2Q 2020 and signaling an end to 2 consecutive quarters of sub-50 readings. This marks the fastest pace of growth since 1Q 2017, but is also consistent with the levels of current activity being still below pre-COVID19 pandemic period. 

India Composite PMI remained in recessionary territory in 3Q 2020 at 45.9, an improvement on 19.9 in 2Q 2020. Overall, Indian economy has suffered the sharpest hit from the pandemic, compared to all other BRICs. It is continuing to exhibit recessionary dynamics to-date. 

China Composite PMI ended 3Q 2020 at 54.7, marking the second consecutive quarter of recover (2Q 2020 reading was 52.6). 3Q 2020 reading is the highest since 1Q 2020, and suggests that the Chinese economy is getting close to recovery in its activity levels to pre-pandemic position. 

Overall, BRIC block activity indices imply lagging momentum in the recovery in services, and faster than global pace of recovery in manufacturing. Statistically, BRIC growth momentum in 3Q 2020 is within historical average, however, growth dynamics in 1Q and 2Q 2020 were significantly below historical averages, which implies that 3Q 2020 PMIs indicate incomplete or only partial recovery in the BRIC economies post-pandemic so far.


14/10/20: BRIC: Services PMIs Q3 results


BRIC Manufacturing has rebounded strongly from thee pandemic lows, as covered in this post here: https://trueeconomics.blogspot.com/2020/10/141020-bric-manufacturing-pmis-q3.html. Services PMI for the BRIC economies signal similar, albeit weaker rebound in July-September:


Brazil Services PMI stayed in the recession territory in 3Q 2020, with index reading coming in at 47.5, up on 30.3 in 2Q 2020, but still marking a third consecutive quarter of sub-50 readings. Put simply, unlike manufacturing that is showing rather incredible signs of the recovery, Brazil's services sectors continue to show ongoing contraction, building on 6 consecutive months of contracting activity through August 2020. September monthly reading at 50.4 is statistically indistinguishable from zero growth line of 50.0. In summary, Brazil's services sector is not in a recovery so far.

Russia Services PMI posted very strong recovery signals in 3Q 2020, although September reading slipped to 53.7 (fast growth) from blistering 58.5 and 58.2 in July and August, respectively. 3Q 2020 Russia Services PMI was at 56.8 marking a sharp turnaround from 36.0 in 2Q 2020. This is the fastest pace of quarterly expansion since 1Q 2017.

India Services PMI remains in contraction, with 3Q 2020 reading of 41.9, an improvement on sharper rates of deterioration in 2Q 2020 at 17.2. September marked seventh consecutive month of sub-50 readings in Services sector in India.

China Services PMI came in at 54.3 in 3Q 2020, up on 52.6 in 2Q 2020, marking second consecutive quarter of recovery from the pandemic lows of 1Q 2020 when the index fell to 40.4. 

Overall, BRIC Services Activity Index - an index compiled by me based on GDP shares and Markit monthly PMI data - rose from 40.4 in 2Q 2020 to 51.0 in 3Q 2020. Given the nature of PMIs as signals of monthly changes in activity, 3Q 2020 reading is consistent with the BRIC block services sectors recovering only partially from the pandemic lows. BRIC Services Activity Index ended 3Q 2020 at the levels slightly below the Global Services PMI which stood at 51.4. Global services sectors are also showing more rapid rate of quarterly recovery, rising from 35.6 in 2Q 2020 to 51.4 in 3Q 2020.


Friday, October 2, 2020

2/10/20: A new mortgage arrears crisis on its way


My latest article on Irish banking sector problems with distressed mortgages is out today in The Currency

There’s a new mortgage arrears crisis on its way, and official Ireland is not ready for it

The Central Bank of Ireland has started publishing new data on mortgage arrears – and the news is not good. An arrears crisis is brewing. The banks, and the state, are woefully unprepared for it.

https://thecurrency.news/articles/24779/theres-a-new-mortgage-arrears-crisis-on-its-way-and-official-ireland-is-not-ready-for-it/ 


Tuesday, September 22, 2020

22/9/20: COVID19 Update: German Economic Growth Forecasts 2020-2022


Germany's ifo Institute published their forecasts for 2020-2022 today. These represent an improvement on Summer forecasts, but continue to show big impact of the COVID19 pandemic lasting beyond 2021:


Private consumption is expected to be 0.82 percentage points below 2019 at the end of 2022, and barely in line (0.78 percentage points above) with 2018 levels. GDP is forecast to reach 1.34 percentage points above 2019 levels in 2022. Employment levels are projected to stay below 2019 levels through most of 2022, and unemployment numbers are expected to stay above their 2019 levels through the entire 2022. General Government deficits will remain in 2020, 2021 and 2022.

Using pre-2020 trend growth, German economy would have been 1.66 to 1.85 percentage points ahead of the GDP levels now forecast for 2022, which means that under the current forecasts, we can expect recovery to the pre-COVID19 trend GDP by the end of 2024. This assumes ca 1.7 percentage points growth over 2023-2024 horizon, which may be quite optimistic, given prior trend growth rates of 0.975% pa. 

ifo forecasts note the state of economic uncertainty: "The degree of uncertainty in our forecasts is enormous because nobody knows how the coronavirus pandemic will develop, whether there will be a hard Brexit after all, and whether the trade wars will be resolved". Which, of course, highlights the environment of VUCA that we are living in.


Thursday, September 10, 2020

8/92020: BRIC: Composite economic activity indicators

 Based on Markit's Composite PMIs, here are the BRIC economies composite economic activity indicators for 3Q 2020 to-date (July-August). 

Please, note: Manufacturing PMIs for BRIC economies were covered here: https://trueeconomics.blogspot.com/2020/09/8920-bric-manufacturing-pmis.html, and Services PMIs were covered here: https://trueeconomics.blogspot.com/2020/09/8920-bric-services-pmis.html


  • Brazil Composite PMI for 3Q 2020 currently sits at 50.6, barely above the zero-growth line of 50.0 in statistical terms. This represents a major improvement in growth momentum compared to an outright depressionary reading of 31.8 in 2Q 2020 and a swing of 18.8 points - a respectable reversal of momentum, although not a signal of an appreciable recovery from the recession.
  • Russia Composite PMI for 3Q 2020 is at blistering 57.1, suggesting a genuine recovery, albeit one-sided, driven by services sector rebound. COVID19 pandemic low was recorded in 2Q 2020 at abysmal 32.6, implying latest swing from the trough of massive 24.5 points. This does appear to be consistent with a robust recovery momentum, albeit with some caveats. This is the highest reading for any quarter since 3Q 2006 and the third highest reading on record.
  • China Composite PMI is at 54.8 so far through 3Q 2020, an improvement on growth-signalling 52.6 reading in 2Q 2020 and up respectable 12.8 points on recession trough in 1Q 2020.
  • India Composite PMI managed to rocket to a still-recessionary 41.6 in 3Q 2020 to-date, up on the recession trough of 19.9 in 2Q 2020 - a swing of 21.7 points. Still, the economy remains in a pronounced recession and 3Q 2020 so far is showing signs of exacerbated contraction building on 2Q 2020 collapse in activity.
For BRIC economies as a whole, the chart next shows GDP-weighted and GDP-shares weighted BRIC Indices of activity, compared to Global Composite PMIs:


Overall, BRIC economies growth momentum is still subdued and largely performing worse than the Global Composite PMI indicator.

8/9/20: BRIC: Services PMIs

Services sector activity as reflected by PMIs from the BRIC economies is now available for August, so here are the top numbers: 

In terms of actual readings, and do recall, quarterly PMIs referenced above are averages over three months period, so 3Q 2020 data is only covering July-August 2020.
  • Brazil Services PMI was nowhere near the insane reading posted by the country Manufacturing PMI (see post here: https://trueeconomics.blogspot.com/2020/09/8920-bric-manufacturing-pmis.html). Services index came in at 46.0 for the period of July-August (3Q 2020 to-date), up on disastrously low 30.3 in 2Q 2020, but still well below 50.0 line of zero growth. Reading PMIs, this means that the sector activity continued to contract in 3Q 2020 so far, on top of the already sharp contraction experienced in 1Q 2020 and 2Q 2020.
  • Having set no records in Manufacturing, Russia Services PMI came out with a massive and seriously surprising print to the upside in August. As the result, 3Q 2020 to-date Services PMI rose to 58.4 for the highest reading since 2Q 2009. As massive as the print is, it is pretty 'normal' for volatile Russian services data. Still, the recovery it signals is sharp, as 2Q 2020 COVID19 trough was at a misery-inducing 32.0. The implied trough-to-peak swing is jaw-dropping 26.4 points.
  • China Services PMI rose in the first two months of 3Q 2020 to 54.1 from already expansionary 52.6 in 2Q 2020. Trough-to-peak COVID19 swing is now at 13.7 points, and the latest reading is the highest since 4Q 2010, when the index stood at 54.2.
  • India Services sectors are still in sharp contraction. Recall: in 2Q 2020, India Services PMI crashed, smashed, collapsed, melted down, or whatever else you might call, falling from 54.1 in 1Q 2020 to 17.2 in 2Q 2020, the lowest reading for any BRIC economy in any sector at any time. So far, in 3Q 2020, the index is running at 38.0, which implies that India's services sectors continue to contract from already reduced activity in prior quarter. In the light of this super-sharp recessionary dynamic, it is impossible to reconcile Manufacturing sector PMI and Services sector PMI in this economy.

Overall, BRIC Services Activity Index - a measure I compute using a range of data inputs, including Markit's PMIs - came in 49.9 in 3Q 2020 (to-date), an improvement on 2Q 2020 reading of 40.4 and above 1Q reading of 44.9. Nonetheless, across the four largest EM economies, Services activity continues to contract for the third quarter in a row, nominally, and it is standing still statistically. In this, BRIC economies are distinct from the Global Services PMI indicator, which rose from 35.6 in 2Q 2020 to 51.3 in 3Q 2020 (to-date). 


Stay tuned for BRIC Composite PMIs next.

Wednesday, August 26, 2020

26/8/20: Germany's Exports Expectations: Some Bad News

 ifo Institute's latest exports expectations for Germany are out and the data is quite interesting:


Firstly, expectations moderated in August, compared to July, although on balance, there are still more positive sentiment responders as opposed to the negative ones. This moderation is surprising, because of the sharpness of prior COVID19-related collapse and because August saw more global relaxation of COVID19 restrictions. 

Secondly, it appears that expectations for exports growth are now starting to revert back to pre-COVID19 'norm' of anaemic growth. This can be best seen by looking at longer term expectations data:


For those nostalgically inclined, 2019 was a woeful year for global trade, as reflected in the 2019 average in the chart above. And this was before COVID19 pandemic. In fact, exports outlook has been deteriorating from around mid-2018, on. 

A return to the pre-COVID19 'normal', if confirmed, is not the good news, given that German exports did not recover from the knock-down they sustained during the COVID19 pandemic.


Tuesday, August 11, 2020

11/8/20: McKinsey on Changes in Economic Outlook


McKinsey have a neat summary of changes in economic outlook across major global regions:


A more granular perspective is from consensus forecasts, as summarized by the Focus Economics and by other sources:


The above are from my presentation deck from earlier today for a Dublin-based conference. 

The key to all of the above is that we are still in a very complex, highly uncertain forecasting environment, and behavioural differences between professional forecasters, economic analysts and business practitioners are vast, reflecting on overall forecasts and outlook sentiments reported.