One of the key features of the Covid19 pandemic to-date has been a relatively low level of corporate insolvencies. In fact, if anything, we are witnessing virtually dissipation of the insolvencies proceedings in the advanced economies, and a simultaneous investment boom in the IPOs markets.
The problem, of course, is that official statistics - in this case - lie. And they lie to the tune of at least 50 percent. Consider two charts:

And
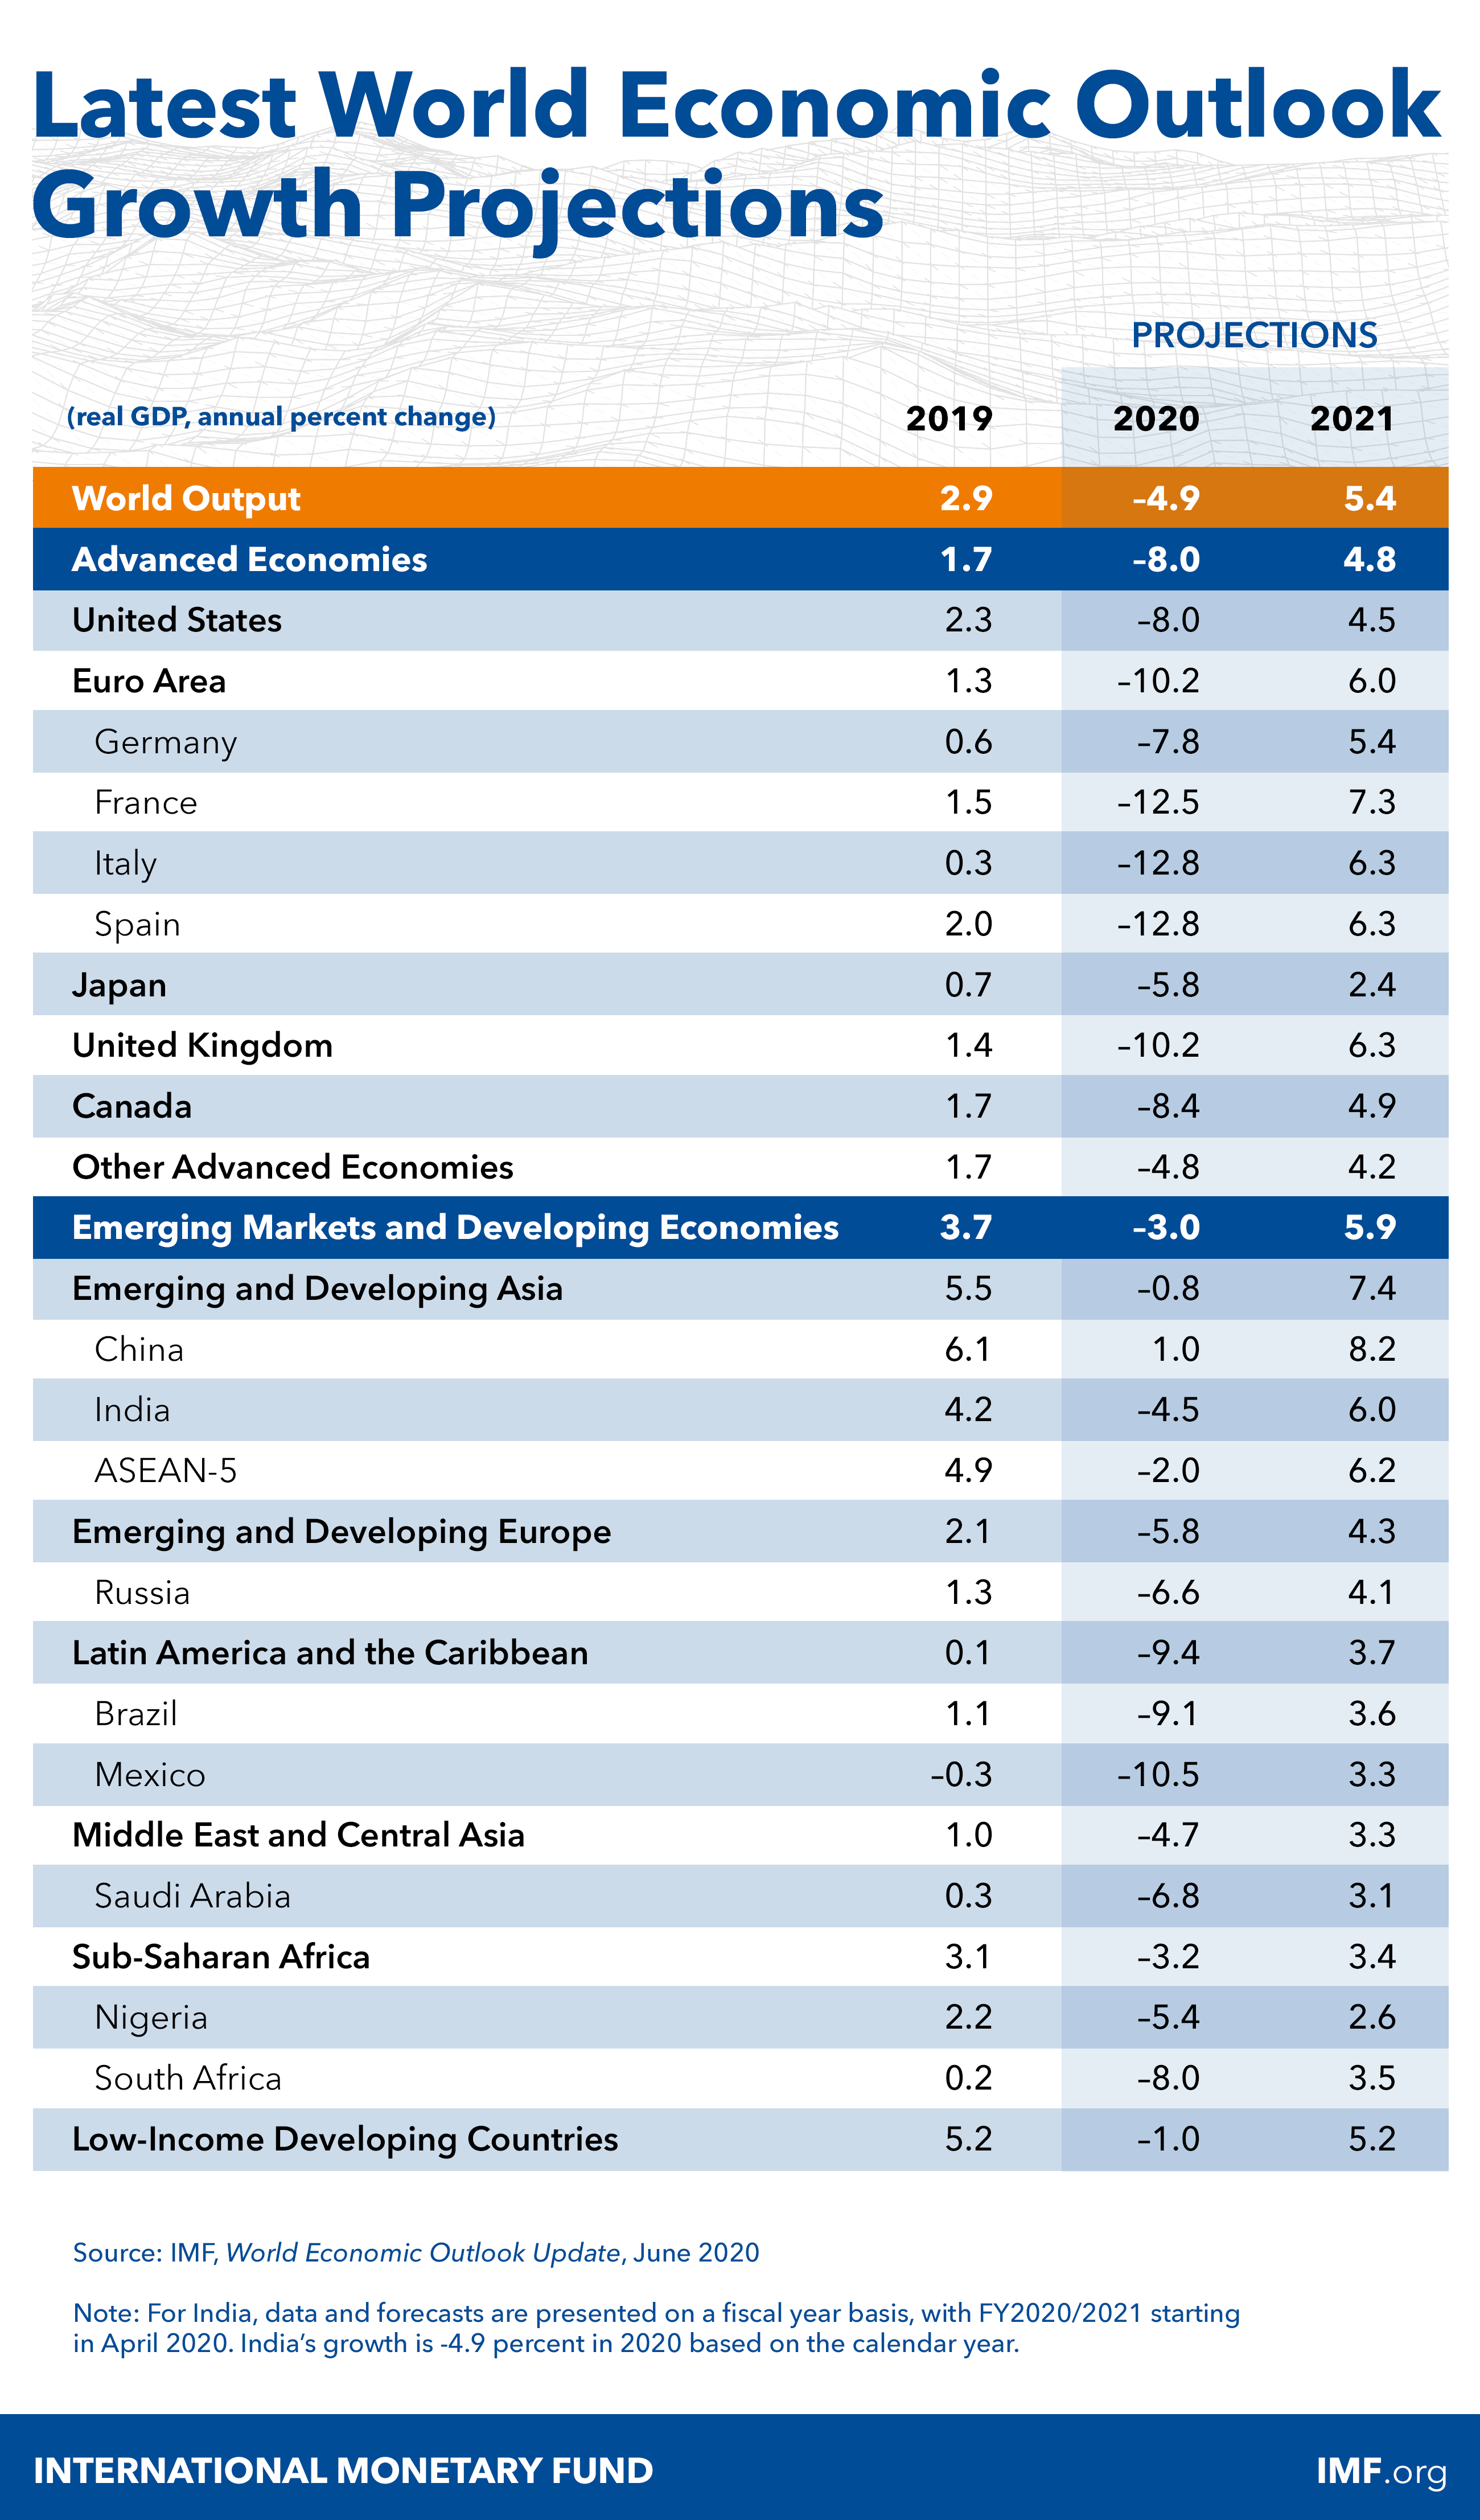
The chart from the IMF is pretty scary. 18 percent of companies are expected to experience liquidity-related financial distress and 16 percent are expected to experience insolvency risk. The data covers Europe and Asia-Pacific. Which omits a wide range of economies, including those with more heavily leveraged corporate sectors, and cheaper insolvency procedures e.g. the U.S. The estimates also assume that companies that run into financial distress in 2020 will exit the markets in 2020-2021. In other words, the 16 percentage insolvency risk estimate is not covering firms that run into liquidity problems in 2021. Presumably, they will go to the wall in 2022.
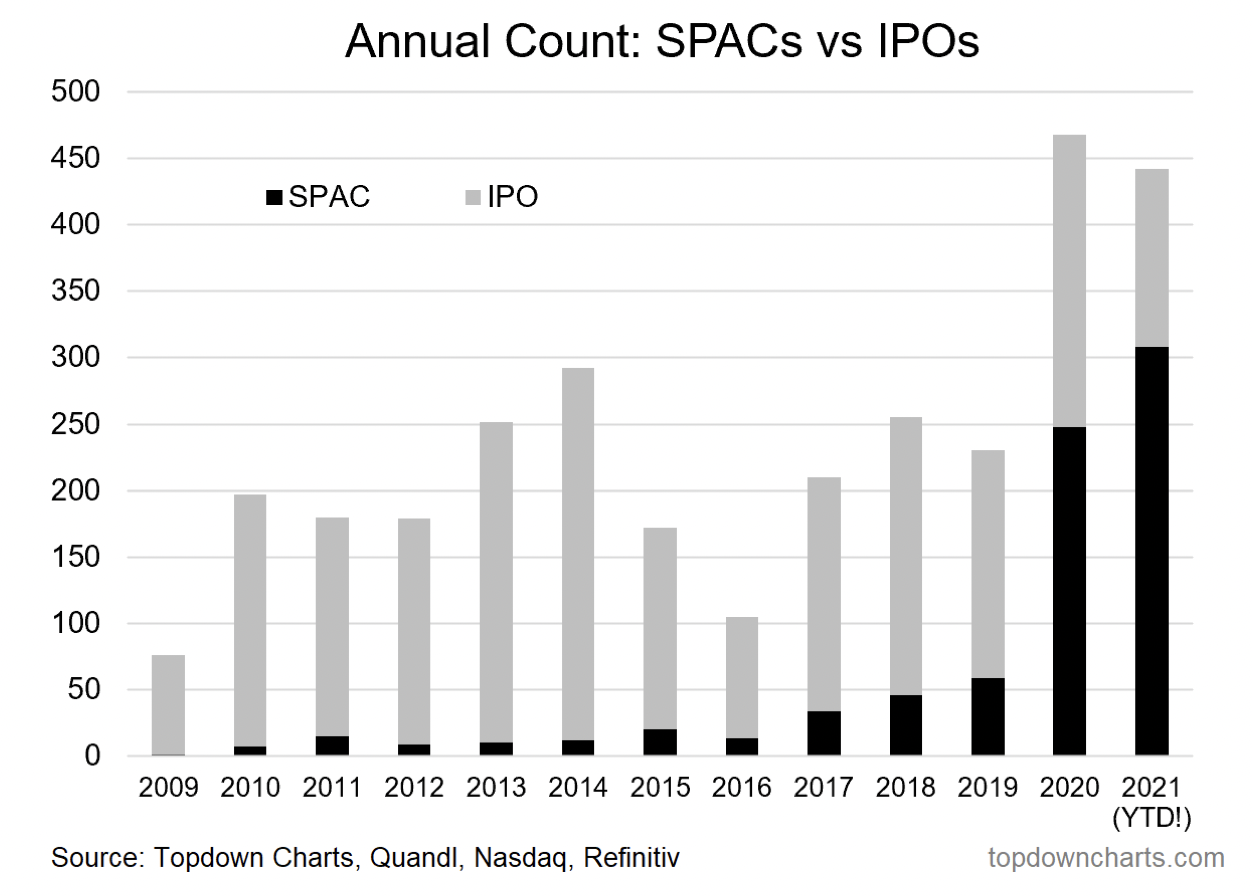
The second chart puts into perspective the IPO investment boom. Vast majority of IPOs in 2020-2021 have been SPACs (aka, vehicles for swapping ownership of prior investments, as opposed to generating new investments). The remainder of IPOs include DPOs (Direct Public Offerings, e.g. Coinbase) which (1) do not raise any new investment capital and (2) swap founders and insiders equity out and retail investors' equity in.
The data above isn't giving me a lot of hope, to be honest of a genuine investment boom.
We are living through the period of fully financialized economy: the U.S. government monetary and fiscal injections in 2020 totaled some $12.3 trillion. That is more than 1/2 of the entire annual GDP. Since then, we've added another $2.2 trillion. Much of these money went either directly (monetary policy) or indirectly (Robinhooders' effect) into the Wall Street and the Crypto Alley. In other words, little of it went to sustain real investment in productive capital. Fewer dollars went to sustain skills upgrading or new development. Less still went to support basic or fundamental research.
In this environment, it is hard to see how global recovery can support higher productivity growth to bring us back to pre-pandemic growth path. What the recovery will support is and accelerated transfer of wealth:
- From lower income households that saved - so far - their stimulus cash, and are now eager to throw it at pandemic-deferred consumption;
- To Wall Street (via corporate earnings and inflation) and the State (via inflation-linked taxes).


Insight/2020/05.2020/05.21.2020_EconInsight/Consumer%20Confidence%20by%20Age.png?width=1425&name=Consumer%20Confidence%20by%20Age.png)
Insight/2020/05.2020/05.21.2020_EconInsight/Global%20Air%20Travel.png?width=1425&name=Global%20Air%20Travel.png)
Insight/2020/05.2020/05.21.2020_EconInsight/Vacation%20Plans.png?width=1520&name=Vacation%20Plans.png)


