Showing posts with label #Pandemic. Show all posts

Sunday, June 20, 2021

20/6/21: COVID19: Europe and EU27


Updating pandemic numbers for the past week for EU27 and Europe:


As the charts clearly show, 

  • Europe experienced significant declines in new cases and deaths in recent weeks, in part due to improved rates of vaccinations.
  • The third wave is now clearly behind us in both the EU27 and Europe, although European cases are remaining at much higher levels than those in the EU27. A similar pattern is evident in deaths.
  • In terms of Covid19 mortality (deaths per 1,000 cases) the rate of mortality has been effectively flat since week 45 of 2020 and is currently running at around 22 deaths per 1,000 cases in the EU27 and Europe.
While these figures show the effectiveness of vaccinations and past lockdown measures, they also present evidence for the need of more robust international efforts in sharing vaccines with countries with lower incomes. Until similar declines are evidenced globally, it is hard to make an argument that any specific region (be it Europe or North America) can be immune from the risks of the pandemic contagion from other countries. More on this risk here: https://trueeconomics.blogspot.com/2021/06/19621-covid19-worldwide-data.html

Saturday, June 19, 2021

19/6/21: COVID19: Worldwide Data


With some time passing since my last update, and the rates of vaccinations ramping up globally, it is easy to forget the simple, but devastating fact: we are still in a global pandemic. Here are the latest weekly totals for new cases and new deaths, worldwide:


Just as the charts show,
  • New cases have fallen significantly from the pandemic peak (Wave 4), but remain above the prior trough between Waves 3 and 4. 
  • New deaths recorded are still at extremely high levels, and showing an uptick week-on-week in the latest data.
Meanwhile, mortality of new Covid19 cases is stubbornly at the levels observed over the last two waves of the pandemic:


Put differently, the 'rich' world is getting vaccinated (albeit with some variation in the rates), while the emerging markets and middle-income economies remain well behind on vaccinations curve. Which means there is continued threat of a global pandemic re-igniting and the looming uncertainty over the new variants emerging.

So much for the 'reopening' future...

Monday, May 10, 2021

9/5/21: COVID19: U.S. vs EU27 comparatives


Updating data for the U.S. - EU27 comparatives for the pandemic through this week (week 17):


Table above reflects several major features of the recent data evolution for the Covid19 pandemic in the U.S. and the EU27, also highlighted in the charts below:
  • Firstly, total number of new cases has diverged in recent weeks. Starting with week 7 of 2021, the U.S. cases continued to fall, while the EU27 cases entered a new upward trend. The new wave - Wave 3 - formed in Europe, whilst the U.S. managed to escape development of Wave 4.
  • For eleven of the last consecutive weeks, the EU27 cases significantly exceeded those in the U.S.
  • As of Week 12, 2021: EU27's Wave 3 has peaked and we have now witnessed five continuous weeks of declines from the peak, although the EU27 case numbers still substantially exceed those in the U.S.
  • There is only one attributable difference between the two countries that can explain this divergence: vaccinations rates. In fact, whilst the U.S. response to the pandemic in its first 10 months has been an unmitigated disaster, the EU27's unroll of the vaccines has been a Trumpesque-level failure of its own. 


As the result of the above factors, EU27 trends in deaths numbers are equally concerning:
  • The EU27 started 2021 with a significantly lower per-capita death rate than the U.S. 
  • At the start of January, as reported on this blog, adjusting for age differences and population size differences, the U.S. pandemic was associated with 139,188 excess deaths compared to the EU27.
  • At the end of this week, this gap was down to 87,598.
  • Put differently, President Trump's policies were responsible for excess deaths amounting to roughly 1/3 of the total deaths sustained in the U.S. over the period of 2020. Since the start of 2021, EU27 policies on vaccinations are responsible for closing this gap by almost 40 percent.
  • The above comparatives for vaccination roll out failure effects are conservative. The EU27 has suffered Wave 3 of the pandemic amidst strict and wide-ranging lockdowns, not comparable to the U.S. measures deployed over the same period of time. 
  • In fact, Week 17/2021 U.S. deaths counts are now lowest for any week since week 27/2020. In contrast, the Eu27 deaths are currently the lowest since week 45/2020.

Tragically, for the EU27, European rates of mortality from the virus have been running above those in the U.S. every week since Week 43/2020, as shown in the chart below:

In fact, as the chart above illustrates, EU27 is yet to see the return to its lowest recorded mortality rate of 0.014 set in Week 37/2020, while the U.S. has been running below that rate on-trend over the last five weeks.

Chart next show the dramatic difference in mortality per case in the U.S. and the EU27 (vertical axis) against the world-wide mortality (horizontal axis), without adjusting for age and population size differences (a note of caution: regression lines are only indicative, at best):


In summary, therefore, the EU27 is paying a high price for its utter failure to unroll vaccinations at scale. The U.S. performance, starting with February-March, has been exemplary compared to the European policy approach, although a lot of the gains made so far are:

  1. Subject to forward uncertainty (U.S. weekly statistics have been exceptionally volatile and hard to interpret); and
  2. As of yet, not enough to erase the scars left by the Trump Administration's mismanagement of the early stages of the pandemic.

Sunday, May 9, 2021

9/5/21: COVID19: BRIICS

 Updating data for BRIICS for Covid19 pandemic through Week 17 of 2021 (current week):


Almost half of all cumulated cases within the BRIICS (Brazil, Russia, India, Indonesia, China and South Africa) group are now in India (above) and almost half of all deaths are in Brazil (below).


The pandemic dynamics have turned decisively in recent weeks: in terms of new cases, India dominates the trend up, with all other BRIICS showing amelioration in the pandemic:


Similarly, for we weekly death counts:

China data remains utterly unbelievable and hard to trust.

Summary table of recent developments:


India's pandemic dynamics are shocking, horrific and show no signs of abating. This is a humanitarian disaster that requires help from the rest of the world - help that has been coming in too-little and too-late.


9/5/21: COVID19: Europe and EU27


Updating graphs for Europe and EU27 pandemic data through week 17 of 2021:


Some good news with a shade of a reality check:
  • New cases are off their Wave 3 highs, solidly so
  • Current case counts are still above Wave 2 trough and well ahead of where they were at the end of Summer 2020.
Similar, but a bit more benign trend in weekly death counts:


Good news 'part 3': mortality rates are declining, again:


While the progress on vaccinations across Europe has been less impressive than desired, it now appears that two factors are driving the end of the Wave 3 of this pandemic:

  1. Vaccinations roll-outs, and
  2. Cumulated effects of recent (and in some countries still ongoing) restrictions.
Let's hope these trends remain persistent in weeks ahead and the new variants do not show up with resistance to vaccinations. 

Saturday, May 8, 2021

8/5/21: COVID19: Most impacted countries

 Covering data through this week (week 17) of 2021 for world's most impacted countries.

First: most impacted countries by the rate of infections and by mortality:


There is only one large country (population > 100 million) that is listed in both tables: the U.S. 

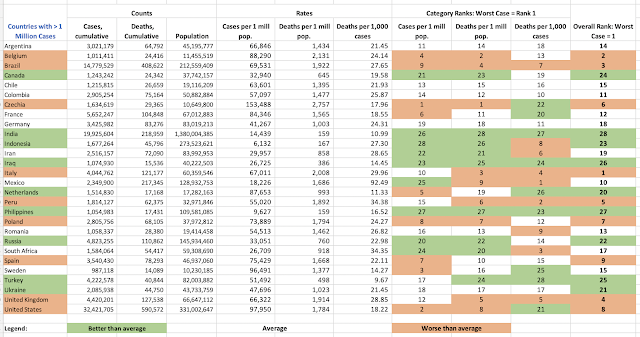
Now, a table of countries with more than 1 million cases:

The U.S. ranks 8th worst performer in the group of 28 countries with more than 1 million cases, when measured across all three metrics: infections per 1 million of population, deaths per 1 million of population and deaths per 1,000 of diagnosed cases. 

Looking at major countries groups in the context of the above table:

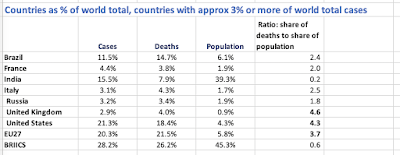
Finally, looking at the most impacted countries from the point of their relative contributions to global totals for cases and deaths:


8/5/21: COVID19: Worldwide Data

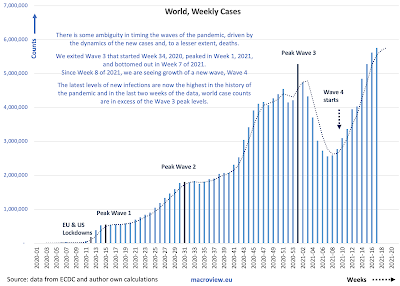
 Updating worldwide data for the Covid19 pandemic through week 17 of 2021 (current week):


We exited Wave 3 that started Week 34, 2020, peaked in Week 1, 2021, and bottomed out in Week 7 of 2021.

Since Week 8 of 2021, we are seeing growth of a new wave, Wave 4

The latest levels of new infections are now the highest in the history of the pandemic and in the last two weeks of the data, world case counts are in excess of the Wave 3 peak levels.


Starting with Week 8 of 2021 we are witnessing a new, Wave 4, of the pandemic emerging. The latest weekly death counts as of Weeks 14, 16 and 17, 2021, rank as 7th, 6th and 5th highest in the history of the pandemic.


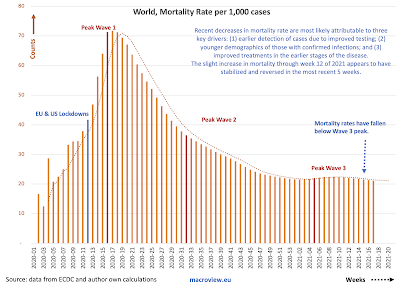
Good news: Recent decreases in mortality rate are most likely attributable to three key drivers: (1) earlier detection of cases due to improved testing; (2) younger demographics of those with confirmed infections; and (3) improved treatments in the earlier stages of the disease.

The slight increase in mortality through week 12 of 2021 appears to have stabilized and reversed in the most recent 5 weeks.


Summary table above shows significant improvement in the pandemic dynamics in the U.S. and more modest, but still sizable improvements in the EU27. BRIICS and Asia are showing worsening pandemic dynamics, and worldwide data broadly reflects this development.

While U.S. and EU27 numbers are encouraging, overall picture of the pandemic remains extremely worrying: worldwide, contagion is still raging unabated and those countries showing strong improvements in vaccinations and reducing contagion spread remain vulnerable to spillovers of new variants and new infections from the rest of the world. 


Monday, April 19, 2021

19/4/21: COVID19: BRIICS

BRIICS are now in a fully-developed Wave 4 of the pandemic, like much of the rest of the world. This is confirmed across both new case numbers and weekly deaths counts:


I highlighted in the table below two BRIICS countries with seriously questionable data quality: China and India. China has been routinely reporting numbers that simply are out of line with anything reported by other countries around the world. India's death statistics appear to be similarly out line with experience in most countries. In the past, Russia received a lot of criticism for its reporting of Covid19 deaths, but their numbers do not appear to be out of line with other countries reported statistics.

These are six largest emerging and middle income economies in the world, and their pandemic dynamics, in the end, hold the key to the global efforts on combating the spread of the disease. Not surprisingly, these countries account for three of the four main variants of the disease to-date. If anyone thinks that Europe and North America can effectively insulate themselves from what is happening in these countries, by any means other than attaining a sufficient and robust immunity through vaccinations, they really need to reflect hard on their rational thought capacity.


19/4/21: COVID19: Most impacted countries


Updated tables for world's most impacted countries and regions below. Starting with the countries with the highest recognized levels of infections:


Followed by the countries with the highest rates of mortality:
  • Andorra, Montenegro and Czechia are top three countries in the world in terms of infections rates
  • Gibraltar, Czechia and San Marino are top three countries in the world in terms of mortality rates
  • Of larger countries, with population > 100 million, the U.S. is the only country featured on both lists, while Mexico is on the list of countries with highest mortality.
A set of table for countries with more than 250,000 recorded cases:


  • There are 57 countries on the list as of Thursday last week. 
  • Across three metrics used (infections rate, deaths per capita and mortality rate per case), Hungary is rated the worst, followed by Belgium and Bulgaria. Czechia and Slovakia share the 4th and 5th places.
  • The U.S. is ranked 3rd highest in the number of infections, in the 8th place in terms of highest deaths per 1 million of population and in the 32nd place in terms of deaths per 1,000 infections. Overall, the U.S. is ranked 8th worst country in terms of pandemic performance across the three metrics.
Table next shows comparatives by the same metrics across regions, treating regions as if they were countries (ranks):

Finally, looking at the major countries and groupings in terms of their cases and deaths counts within the context of their shares of global population:

Notably, majority of the most impacted countries are, currently, in the process of developing, or already experiencing, a new wave of the pandemic.

Sunday, April 18, 2021

17/4/21: COVID19: Europe and EU27


Looking at Europe and EU27 data for Covid19 pandemic through Week 14 of 2021 (week ending Thursday, April 15):

Since Week 7, the EU27 are in Wave 3, although it appears that this wave might have peaked around Week 12. Latest weekly case counts are below week 12 reading and are lowest in three consecutive weeks. Nonetheless, latest weekly counts rank 10th highest in the history of the pandemic.


EU27 weekly death counts are currently (week 14, 2021) rank 16th highest in the entire 67 weeks-long history of the pandemic.

As summarized in the table below, EU27 new cases are this week down 9% on 4 weeks average, while death counts are up 6%


17/4/21: COVID19: Worldwide Data

 
Despite the ongoing efforts to accelerate vaccinations, we can now, sadly, confirm that globally, we are in the fourth wave of the pandemic:

As reminder,  we exited Wave 3 that started Week 34, 2020, peaked in Week 1, 2021, and bottomed out in Week 7 of 2021. Since Week 8 of 2021, we are seeing growth of a new wave, Wave 4 which has now reaching the peak of Wave 3. The latest level of new infections is now second highest weekly count in the history of the pandemic, at 4,833,991 cases compared to 5,284,581 cases at the peak of Wave 3 in week 1 of 2021.


There is a two weeks lag in the dynamics of deaths counts compared to the dynamics of new cases registrations. Nonetheless, we can now confirm Wave 4 development based on weekly deaths as well as on weekly new case counts. The latest weekly death counts as of Week 14, 2021, ranks 5th highest in the history of the pandemic.

Mortality rates remain subdued, as through the Wave 3 of the pandemic. Which is the only decent news from the recent data.


A summary table by region:


In summary: the pandemic is not abating, despite significant inroads made in terms of vaccinations, especially in the advanced economies. It is a loud and clear reminder to us all that vaccinations in the advanced economies are not enough to cut global rates of infections, and every day lost to lower rates of vaccinations in the emerging economies is another day left to virus to potentially mutate and produce yet another more contagious and deadly variant.


Tuesday, April 6, 2021

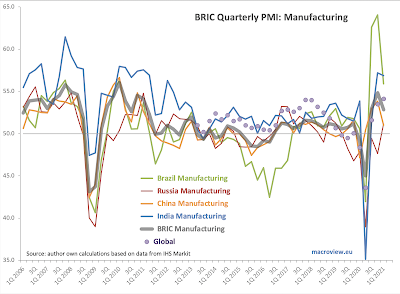
5/4/21: BRIC's Manufacturing PMIs: 1Q 2021


Given a lot of noise about economic re-opening and abatement of the late 2020 wave of the pandemic, we expected BRIC countries PMIs to improve significantly in 1Q 2021 compared to 4Q 2020. Alas, the opposite took place:


  • Brazil Manufacturing PMI fell from 64.1 in 4Q 2020 to 55.9 in 1Q 2021. All three months of 1Q 2021 came in sub-60 (all three months of 4Q 2020 were above 60) and March 2021 was the lowest monthly reading since June 2020.
  • Russia Manufacturing PMI slipped from 51.5 in February to 51.1 in March. On quarterly basis, Russia Manufacturing PMI actually managed to rise from a recessionary reading of 47.6 in 4Q 2020 to a weak recovery reading of 51.2 in 1Q 2021. This is the highest reading since 1Q 2019 and the first above-50 reading since the end of 2Q 2019. Russia was the only BRIC economy posting increasing PMI in Manufacturing sector in 1Q 2021, and at that, the improvement went to anaemic growth from pretty steep contraction.
  • China Manufacturing PMI disappointed, falling from 53.8 in 4Q 2020 to 51.0 in 1Q 2021. Given structural importance of Chinese manufacturing globally, this implies a further build up in orders backlogs in the global supply chains, signaling more inflationary pressures down the line. On a monthly basis, March 2021 posted fourth consecutive decline in monthly PMIs, with March reading of just 50.6 - statistically, basically indistinguishable from zero growth conditions in the sector.
  • India Manufacturing PMI fell from 57.7 and 57.5 in January and February 2021 to 55.4 in March 2021, marking the slowest monthly rate of growth since August 2020. On a quarterly basis, India Manufacturing PMI fell from a hard-to-believe rate of expansion of 57.2 in 4Q 2020 to still robust growth of 56.9 in 1Q 2021.
Brazil and India were the two BRIC economies that managed to outperform global manufacturing sector growth in 1Q 2021 which came in at 54.1, up on 53.5 in 4Q 2020.

Global GDP-weighted BRIC group Index of Manufacturing Activity that I calculate based on Markit data fell from from 54.8 in 4Q 2020 to 52.8 in 1Q 2021, reaching the lowest reading since 2Q 2020 when it was at 45.0. Whilst BRIC group Index of Manufacturing Activity outperformed Global Manufacturing PMI in every quarter between 1Q 2019 and 4Q 2020, it fell below the global measure in 1Q 2021.

Friday, April 2, 2021

2/4/21: America's Scariest Chart: U.S. Employment Situation

Now, the last of the series of posts on U.S. labor markets, concluding with America's Scariest Chart, plotting the index of employment (jobs) in the U.S. based on each recession-recovery cycle:


Despite some positive headline numbers on some labor market metrics, jobs creation in the U.S. is not  progressing well-enough to claim any end in sight for the Covid19-induced recession. Current reading for jobs index, relative to pre-recession highs is woeful. So woeful, today's state of U.S. markets ranks as the second worst jobs recession in modern history, so far, worse than the Great Recession. 

Good news is that in March, pace of recovery accelerated from a major slowdown experienced in the first two months of 2021. The bad news is, unless this pace is sustained, we are risking a scenario where unprecedented policy (fiscal and monetary) supports unleashed since the start of 2Q 2020 will be associated with a jobs recovery that is second-third worst in the modern history of U.S. recessions. Time will tell.


Note: 


2/4/21: U.S. Duration of Unemployment

One of the America's Scariest Charts - a long-term running issue I have been highlighting for a number of years now - is roaring back to prominence as Covid19 pandemic crisis continues to impact U.S. labor markets across virtually all possible metrics of health.


Here it is: the average duration of unemployment spells:


Unemployment spells become short at the start of the recession as new vintage unemployed join the ranks of long term unemployed. As the recovery sets in, unemployment duration starts to take into the account a different and changing mix of those on unemployment: the share of total unemployed who are short-term unemployed shrinks, the share of the longer term unemployed rises. Secularly, however, virtually every past recession since 1970s on has resulted in a longterm increase in average duration of unemployment during the recovery phase of the business cycle. In other words, the longer term unemployed became even longer-term unemployed. And now, the Covid19 pandemic joins the line of past recessions with continuing on this trend. 

Chart next compares each recession and subsequent recovery period since the end of the WW2 through current:


Based on the average duration of unemployment, we are now (in the Covid19 pandemic recession) are tracking the worst recession on record: the Great Recession. Weeks ahead will tell us, if indeed this will be a new record-breaking recession, beating the length of average unemployment spell established in the Great Recession. But for now, with all the recovery going around, the unemployed are becoming longer and longer-term unemployed.

Not exactly a picture of robust health being restored in the U.S. labor markets.

2/4/21: U.S. New Unemployment Claims

Continuing with the coverage of core statistics for the U.S. labor markets performance. This post covers new unemployment claims through March 20, 2021, with the last two weeks of data being preliminary estimates.

In the week through March 20, 2021, new unemployment claims fell to 656,789, or four weeks running total of 2,892,799 dipping below the peak of the Great Recession levels of 4 weeks total of 3,313,000. This is the good news.


The bad news is that latest reading would rank 58th worst in the history of the weekly series, if we are to exclude the Covid19 period. Another part of the bad news is that last week's weekly rate of decline of 100,412, the fastest rate of decline in four weeks, is actually slower than average weekly rate of decline for the pandemic period. 


4 weeks running average rate of improvement in new unemployment claims is just 14,943. Which means that at this rate of labor market improvements, it will take 30.6 weeks to regain pre-Covid lows of new claims.

Things are improving. But they are improving at less than impressive rates.


Note:


2/4/21: U.S. Non-Farm Payrolls

 In the first part of the series of updates on the U.S. labor markets, I covered continued unemployment claims (https://trueeconomics.blogspot.com/2021/04/2421-us-continued-unemployment-claims.html), followed by the second post covering labor force participation and employment-to-population ratio (https://trueeconomics.blogspot.com/2021/04/2421-us-labor-force-participation-and.html).

Now, consider total non-farm payrolls - a measure of jobs present in the economy:


Total non-farm payrolls rose in march 2021 to 143,400,000, up on 142,077,000 in February. However, the increase still leaves the payrolls 9,777,000 short of the pre-Covid19 highs. The rate of jobs addition rose in March to 1,323,000 from February growth rate of 1,097,000. Combined jobs expansions of February and March, however, are not sufficient to cover the jobs losses of 2,622,000 sustained in January 2021. Average monthly jobs recovery during the pandemic period is 1,195,000, which means that it will take ca 8 months at the average rate of jobs creation for the economy to regain its pre-Covid19 highs in jobs numbers.