Updating my series of America's Scariest Charts, here is the latest reported data (through the week of January 23rd) on continued unemployment claims:

Mapping the same series in comparison to other recessions:
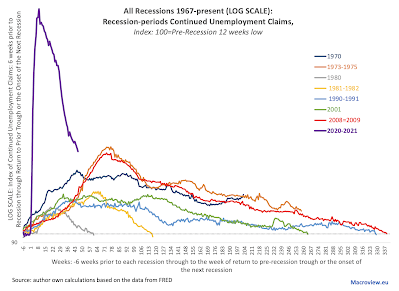
The log scale ameliorates, visually, the extreme nature of unemployment dynamics during the current recession, which is now into its 46th week running. Compared to all prior recessionary episodes, current week 46 reading is still the worst of all post-WW2 recessions.

Some recent research (reviewed here: https://trueeconomics.blogspot.com/2021/02/3221-cost-of-trumps-failures-to-act-on.html) suggests that U.S. policy errors in dealing with pandemic could have increased infection rates by 8.7-14.2 percent. Translating these potential effects into unemployment suggests that more robust public policy interventions at the Federal level could have, potentially, reduced current unemployment rolls by some 425,000-693,000.

No comments:
Post a Comment