Showing posts with label #BLS #CoronavirusUS #COVID19 #COVID2019 #COVIDUSA #crisis #Employment #initialclaims #labormarket #Pandemic #recession #scariestcharts #labor #markets #laborforce. Show all posts

Friday, April 2, 2021

2/4/21: U.S. Continued Unemployment Claims

Continued weekly unemployment claims fell in the week of March 20 to their lowest Covid19 pandemic period point of 3,794,000 (seasonally adjusted). The decline in the unemployment claims driven by a combination of:

  1. Jobs creation
  2. Benefits expiration
  3. Exits from the labor force


Even with the positive news, U.S. current reading is in line with March 2011.


More updates on the U.S. labor markets coming up, so stay tuned.

Thursday, February 4, 2021

4/2/21: U.S. Labor Markets: America's Scariest Charts, Part 1


Updating my series of America's Scariest Charts, here is the latest reported data (through the week of January 23rd) on continued unemployment claims:


In absolute terms, official continued unemployment claims stood at 4,592,000 during the week of January 23, 2021, 193,000 down on week prior and 935,000 down on the month prior. The four weeks-average rate of decline in continued claims is at 120,000 per week, an improvement on 4-weeks average of 103,250 weekly rate of decline a week ago, but worse than 177,250 average rate of decline recorded a month ago.

Mapping the same series in comparison to other recessions:


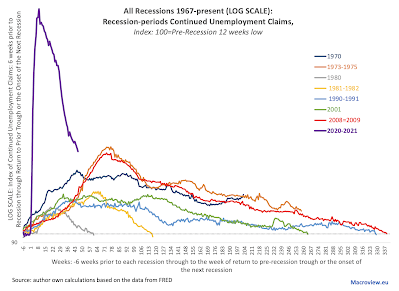
The log scale ameliorates, visually, the extreme nature of unemployment dynamics during the current recession, which is now into its 46th week running. Compared to all prior recessionary episodes, current week 46 reading is still the worst of all post-WW2 recessions. 

Some recent research (reviewed here: https://trueeconomics.blogspot.com/2021/02/3221-cost-of-trumps-failures-to-act-on.html) suggests that U.S. policy errors in dealing with pandemic could have increased infection rates by 8.7-14.2 percent. Translating these potential effects into unemployment suggests that more robust public policy interventions at the Federal level could have, potentially, reduced current unemployment rolls by some 425,000-693,000.


Wednesday, January 6, 2021

5/1/21: U.S. Labor Markets Update: America's Scariest Charts

Continued unemployment claims (based on seasonally-adjusted data) are continuing to decline, as the latest data through mid-December 2020 shows, yet, even with these news, the latest data print puts continued claims for unemployment at the levels comparable with late 2009. 

So here is the chart showing overall levels of continued unemployment claims in the U.S.:


And here is one of my "Scariest Charts", showing index of continued unemployment claims across all modern recessions:


Given current rates of continued unemployment claims declines, 
  • Over the last 4 weeks, average weekly decrease in continued unemployment claims stood at 77,000
  • Current levels are 3,570,000 higher than pre-Covid low.
  • Which means that it would take roughly 46 weeks at the current 4-weeks average rate of decrease to eliminate surplus unemployment generated by the Covid19 pandemic. Which is pretty much the same distance to point of regaining pre-Covid19 levels of unemployment claims as well.
Meanwhile, some bad news from the most recent data on new unemployment claims:


In December 2020, new unemployment claims rose, not fallen, on 4 months cumulative basis due to a large increase in non-seasonally adjusted new claims in the first week of the month. How bad are things? Most recent data point ranks 33rd highest new unemployment claims weekly count in the entire history of the series (since July 1967). However, excluding other weeks of Covid19 pandemic, or, put differently, contextualizing current levels to pre-Covid19 history, the latest levels of new unemployment claims would have ranked as 5th highest in history.

Thursday, December 10, 2020

10/12/20: U.S. Labor Markets Update: America's Scariest Charts

Continued unemployment claims are running below the 2008 GFC peak for the third week in a row, but adjusting to pre-Covid19 cycle unemployment roughs, we are still ways to go:


Despite making some serious inroads in reducing unemployment, U.S. labor markets are still half-alive and things are starting to look shaky:
  • Latest weekly change in continued unemployment figures is an increase of 230,000 - the first rise in 13 weeks.
  • Pre-Covid19 trough was at 1,702,000 continued claims. We are currently at 5,757,000.
  • Compared to pre-recession 12 weeks low, current unemployment claims are 334% higher or more than 3.3 times higher.
  • New claims are also rising: the latest confirmed data is a weekly increase of 23,977 - the largest in 5 weeks.
  • The latest preliminary data shows new claims up +228,982 in the week of December 5th, based in States' data.
Meanwhile, labor force participation rate is weak: down from 61.7 in October to 61.5 in November. Which is below 2020 average of 61.8, which itself is not impressive. And employment to population ratio is down from 57.4 to 57.3 in November too. Woeful:


Average duration of unemployment is rising:

And jobs creation is effectively stagnant:


Thus, in summary we have:
  • An uptick in new unemployment and continued unemployment
  • Decline in labor force participation
  • Anaemic jobs additions
  • Falling employment as a share of population
  • Widening duration of unemployment

Things are not getting 'back to normal'.