Tuesday, October 30, 2012

30/10/2012: Eurocoin signals continued recession in October


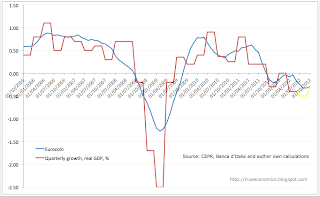
Euro area economy did not improve significantly in September-October, according to the leading composite indicator eurocoin published by the CEPR and Banca d'Italia.


Per eurocoin,

  • October growth reading stood at -0.29%, statistically indistinguishable from -0.32 and -0.33 recorded in September and August, respectively. 
  • October marks thirteenth consecutive month of contraction being signaled by eurocoin
  • Crucially, 3mo MA is now at -0.313 which is the same as 2008-2009 average (-0.31). 6mo average is at -0.23.
  • We are now into the fourth month of statistically significant sub-zero readings.


As charts below show, ECB remains in the operating range where inflationary target is not consistent with Taylor Rule target.


And here's a chart from Morgan Stanley Research showing PMI-based indicators are also pointing South:


30/10/2012: Feeble defense for tax arbitrage


Saturday, October 27, 2012: http://www.irishexaminer.com/ireland/gilmore-bids-to-reassure-merkels-heir-apparent-212198.html#.UI2WTN8hVo4.twitter

"Ireland’s corporation tax rate was in the sights of the man most likely to succeed Angela Merkel as German chancellor when he met Tánaiste Eamon Gilmore in Berlin. Peer Steinbruck, the Socialists’ candidate to lead the party in next year’s election, also said he doesn’t personally believe in using EU funds to pay down bank debt."

Now, here's the problem: Steinbruck has been "deeply critical of Ireland’s generous corporation tax, blaming it for Germany losing income from German companies, when he was finance minister in the previous coalition government with Ms Merkel."

Per report, "the Tánaiste tried to reassure him that Ireland’s tax rate of 12.5% — the second lowest in the EU — posed no threat to Germany… …Over 1,000 multinationals are based in the country and last year was a record for inward investment. "This is not a threat to Germany or to our other partners in Europe — there are more jobs in Irish companies operating in Germany than there are in German companies operating in Ireland. "In fact, in many instances we are competing for mobile investment with other parts of the world and not with our fellow European," said Mr Gilmore."


One wonders if Mr Gilmore is simply playing an ignorant or is indeed unaware of the fact that beyond his own prowess of policy foresight, other countries in Europe, including Germany, would like to see European HQs of non-EU MNCs set up in their jurisdictions? Or perhaps Mr Gilmore thinks that Peer Steinbruck is some naive school-teacher-turns-politico and that the German Socialist has no desire to correct for often absurd tax arbitrage on which Germany is losing billions in tax revenues and which Ireland facilitates (see links here : http://trueeconomics.blogspot.ie/2012/10/13102012-irish-corporate-tax-haven-in.html). This tax arbitrage not only imposes direct cost on Germany (via German MNCs accounting practices via Ireland operations), but also massive indirect costs as non-German MNCs trade into German economy bypassing German tax system.

In reality, all tax havens are small open economies, so Mr Gilmore's 'Ireland is small, so it needs special tax regime' argument is hardly a defense.

30/10/2012: Not all austerity is equal


August 2012 paper (link: http://papers.ssrn.com/sol3/papers.cfm?abstract_id=2153486 ) "The Output Effect of Fiscal Consolidations by Alberto F. Alesina , Carlo A. Favero and Francesco Giavazzi published by CEPR (Discussion Paper No. DP9105) looked at "whether fiscal corrections cause large output losses." Italics are mine:

The authors "find that it matters crucially how the fiscal correction occurs. Adjustments based upon spending cuts are much less costly in terms of output losses than tax-based ones. Spending-based adjustments have been associated with mild and short-lived recessions, in many cases with no recession at all. Tax-based adjustments have been associated with prolonged and deep recessions.

The difference cannot be explained by different monetary policies during the two types of adjustments. Studying the effects of multi-year fiscal plans rather than individual shifts in fiscal variables we make progress on question of anticipated versus unanticipated policy shifts: we find that the correlation between unanticipated and anticipated shifts in taxes and spending is heterogenous across countries, suggesting that the degree of persistence of fiscal corrections varies."

"Estimating the effects of fiscal plans, rather than individual fiscal shocks, we obtain much more precise estimates of tax and spending multipliers". And "the key result is that while expenditure-based adjustments are not recessionary, tax-based ones create deep and long lasting recessions." The reason for this that "the aggregate demand component which reflects more closely the difference in the response of output to ECB and [tax-based] adjustments is private investment. The confidence of investors proceeds with the economy and therefore recovers much sooner after a spending-based adjustment than after a tax-based one. ...These results are consistent with the descriptive statistics presented in Alesina and Ardagna (2012) who show that the fiscal stabilizations which have the mildest effect on output are those that are accompanied by a set of structural reforms which signal a "decisive" policy change. They [like the present study] do not find any difference in the monetary pol- icy stance between spending-based and tax-based adjustments, but mostly differences in the policy packages regarding supply side reforms and liberalizations."

Monday, October 29, 2012

29/10/2012: German banks exposure to GIIPS


Here's a pic courtesy of Morgan Stanley Research of the German system exposure to GIIPS - pre-crisis, and now:


That is a massive deleveraging (if you look at now, through September), but it is also a massive exposure. Few years ago I said that German banks didn't have a property bubble at home. The had one abroad (in GIIPS) instead. Now, with their banks close to 2005 levels of exposure, it is pretty clear where the Euro area policy train is heading before the station 'Legacy Debts' is reached.

29/10/2012: More on CDS markets woes


Few days ago I mentioned I stopped watching CDS on a daily basis... and here is more on the same: link.

Well done, Europe. Nothing like sledgehammering the markets. Step next: shove loads of sovereign debts into ESM, OMT and on the 'emergency' lending lines at ECB and NCBs. That'll teach the markets how to price risk.


29/10/2012: Euro Area and GIIPS: banks & bonds


An interesting set of two charts from BIS (through Q2 2012) documenting Euro area banks' exit from GIIPS (click to enlarge):


29/10/2012: BAML note on Ireland's Troika Review


A glowingly positive, albeit un-detailed, under-researched and rather tenuous on the subject covered, note from BA Merrill Lynch on Ireland's latest quarterly Troika review (link). This suggests that (1) all that matters for Ireland is 'exiting' Troika bailout, (2) OMT take up of a whooping €24bn of banks debts is just a matter of technicality, to be resolved in early 2013 (oh, we wish) and (3) the ECB is somehow going to find it plausible to support the banking-fiscal systems tie up that according to ECB and the rest of Troika is performing well without ECB/OMT/ESM support.

Now, what logic can lead BAML to conclude any of the things above remains a mystery.

My own view on the Troika review is provided here.

Sunday, October 28, 2012

28/10/2012: Long term investor risk perceptions


Blackrock research on risk attitudes of long-term investors:


So within 1year we have a massive flip on perceptions concerning pensions decisions, amidst a relatively robust markets performance.

28/10/2012: BNP note on Spanish Bonds risks


A neat summery from BNP on (1) current bond ratings, and (2) links between ratings and eligibility for inclusion in bond indices:


And a few words on the importance of Spanish ratings risks to ESM/OMT etc:

"As has been demonstrated throughout the EU debt crisis, credit ratings can have a material impact on sovereign bond markets. ...However, not all downgrades have the same effect on bond yields. More specifically, the loss of an AAA rating (S&P on France and Austria, for example) and, more importantly, the loss of investment-grade status (Greece, Portugal) matter more than other downgrades and may have dire consequences for sovereign bonds, because of the significance of those two ratings levels as critical thresholds for investors."

"The downgrade to sub-investment grade, in particular, is linked to the eligibility criteria for various global bond indices, i.e. the minimum rating required for a sovereign bond to be included in an index. Fund managers tend to track the performance of major bond indices and, as a result, when a country’s sovereign bonds drop out of an index due to ratings ineligibility, investors have to adjust their portfolios and offload the country’s bonds. So, any downgrades to sub-investment grade could lead to massive selling flows and have a huge impact on the bond yields of the country in question. More than that, quite often, markets tend to front-run the ratings agencies and start to offload the bonds of the country they suspect may be downgraded to sub-investment grade in the near-term future."


"... Currently, Spanish ratings are getting extremely close to those same [as Portugal in 2011 downgrade case] eligibility thresholds. In general, BBB- is the critical limit for bond index eligibility, but different indices have different rules on calculating a single rating for each country (they can use, say, the average, middle, best of all, or specific ratings). For Spain, currently rated BBB-/Baa3/BBB, any trio of one-notch downgrades is going to push the average rating below the eligibility threshold."

"Credit ratings are important not only with respect to eligibility for the major bond indices, but also in calculating the haircut the ECB applies to collateral posted by European banks. According to the ECB’s graduated haircut schedule, an extra 5% haircut is applied to ratings in the BBB+/BBB/BBB- range (the ECB uses the best rating of S&P, Moody’s, Fitch and DBRS). This extra 5% haircut applies only to category 1 assets, which include government bonds. For other assets, like bank, corporate and agency debt, this extra haircut can reach up to 23.5%, creating severe additional collateral requirements for banks."

"This is particularly important for Spanish banks, which tend to absorb around EUR 400bn of liquidity from ECB’s open market operations. The ECB recently announced that it is suspending the application of the minimum credit-rating threshold to its collateral eligibility requirements for the purposes of the Eurosystem’s credit operations for marketable debt securities issued or guaranteed by the central government of countries that are eligible for OMTs or are under an EU-IMF programme and comply with the associated conditions. However, this does not affect the application of the previously mentioned graduated haircut approach."

"So, focusing on Spain, a one-notch downgrade by DBRS would mean that marketable securities issued by Spain would fall into the higher haircut range and Spanish banks would have to post additional collateral with the ECB. A trio of one-notch downgrades by S&P, Moody’s and Fitch would push the Spanish average rating below BBB- and Spanish bonds out of those bond indices that use the average rating as the threshold for eligibility. For those bond indices that use the middle rating of S&P/Moody’s/Fitch (or the better of the first two), a one notch downgrade by each of Moody’s and S&P would be enough to push the single rating below the eligibility threshold, too. Because of this, any upcoming developments in relation to (1) direct bank recapitalisation by the ESM, (2) a Spanish request for a precautionary programme, (3) economic and social developments in Spain and (4) funding rates are going to be critical, as they could prompt further downgrades, with severe implications for the Spanish bond market."

"If any of these downgrade combinations takes place before Spain has made an official request for a programme, we believe a request would, in effect, become inevitable. At the same time, if Spain asked for a programme tomorrow, this would not necessarily mean that any further downgrades would be off the cards. Almost all of the ratings agencies have said that they will have to assess whether ESM intervention is likely to become a complement to or a substitute for market access. If it turns out to be the latter, this would be in line with a downgrade to the sub-investment-grade category."

"At this point, we should mention that if Spanish bonds are removed from the global bond indices, this could have an impact on Italian bonds as well. The reason is that some investors may have replaced their Spanish bond holdings with an Italian bond proxy in order to benefit from better liquidity and protect themselves from panic selling, should Spain be downgraded further. As a result, if Spanish bonds’ drop out of various indices, these investors could suddenly find themselves overweight Italy versus the index, so they would have to sell some of their Italian bonds to re-adjust their weightings and track the index."

"We saw this kind of move when Portugal was downgraded to junk by Moody’s in July 2011 (taking into account that this was not completely expected by the markets and PGB liquidity had already dried up). In the five days after Portugal’s downgrade, 5y Italian and Spanish yields jumped by 95bp and 65bp, respectively."

Nasty prospect, albeit the risks are diminishing, in the short run, imo.

28/10/2012: ECB and technocratic decay?


Some interesting comments from BNP on ECB and Mr Draghi's tenure to-date. The note is linked here.  But some quotes are enlightening [comments are my onw]:

"While the ECB justifies the OMT as being to improve the functioning of the monetary system, the fact it has done nothing to help the monetary system in Ireland or Portugal suggests the scheme is about fiscal financing." [I fully agree]

"The balance-sheet implications of buying in the secondary market are the same as if bonds had been bought in the primary market. Mr Draghi’s adherence to the spirit of the Treaty is in question. We support his flexibility, however." [In the short run - yes, Draghi's flexibility is a necessary compromise. Alas, in the long run it is of questionable virtue. Hence, as I remarked ages ago, it's not the measures the ECB unrolls in the crisis that worry me, but the impossibility of unwinding them without wrecking havoc on the economy.]

"...Mr Draghi did [cut rates] in November and December [2011], taking rates back to where they started the year before the two misguided mid-2011 hikes. Mr Draghi cut rates again in July 2012, not only taking the refi rate below the 1% barrier (to 75bp), but also cutting the deposit rate to zero, apparently in an attempt to reinvigorate the interbank market (so far, fruitlessly). Mr Draghi should be praised for cutting rates and for overcoming the 1% barrier, in our view." [I agree.]

"However, he seems to be reluctant to take the deposit rate below zero, which looks timid. Moreover, he has failed to stimulate private credit supply. The LTRO has facilitated the expansion of credit to governments, but to some extent, this has crowded out private-sector credit, where growth is now down 0.8% y/y (-0.4% adjusted for sales and securitisation). The line that this is due to weakness in credit demand is a feeble excuse for the ECB failing to do enough to stimulate supply or to circumvent the lack of credit supply, for example, through credit easing. This has been the major failure of Mr Draghi’s tenure." [I am not so sure on BNP rejecting the idea of weak demand. Most likely, both weak supply and demand are reinforcing each other. More on this once we have our paper on SMEs access to credit published in working paper format, so stay tuned].

And the last blast, the potent one: "If central bankers don’t want politicians to mess with central banking, central bankers would be wise not to mess with politics. Mr Draghi was intimately involved in Italian politics and the demise of former Prime Minister Silvio Berlusconi’s tenure in the summer of 2011. More recently, his plans for the OMT were reportedly shared with the German chancellor’s office well in advance. The ECB is a very political animal under Mr Draghi. As the only institution with pan-eurozone power, a prominent role for the ECB in crisis resolution and a strong link to politics
may be unavoidable, and even desirable. But ultimately, such links may return to haunt it." [Yep, I agree. Mr Draghi's competence in office comes with a typical European price tag - get a technocrat and surrender checks and balances. This both signifies to the sickness at the heart of Europe (technocracy displacing democracy) and the inability of the 'patient' to develop institutional path for dealing with this sickness (with EZ potentially/arguably facing either a collapse in the hands of democracy or decay in the hands of technocracy).]

28/10/2012: Some more EZ forecasts from Citi


Two more charts from Citi Research highlighting some growth differentials within the Euro area (note second chart - Ireland position).


As I mentioned before, these are not my views, these are Citi forecasts. Where I broadly agree with Citi on: 1) Ireland is likely to outperform EZ average growth in longer term (I am not sure about 3.0 and 3.1 percent growth in real terms in 2015-2016); and 2) EZ growth is likely to average around or below 1% in 2014-2016. More short-term, I doubt EZ will stay in a recession territory in 2013 (full year) and in 2014.

Saturday, October 27, 2012

27/10/2012: Ireland, Euro Area and US 2013-2016


Another interesting set of data from the Citi Research:

Table 1: These are Citi forecasts for real GDP growth. Two pints of interest:

  1. Ireland v Euro area: 2.4 v 0.3 average rates of growth forecast for 2013-2016
  2. US v Euro area

On the second point, chart below clearly shows support for my long-held thesis (since 2002 at leas) that in the long run, it is not the US that is decoupling from the World economy, but Europe...


Note: these are not my forecasts. My outlook differs from Citi outlook.

27/10/2012: Irish Exports to Emerging Markets


Some good news (via Citi Research):


The above shows the sizable extent of Ireland's trade with Emerging Asian economies.

However, not all is great in the field of Irish trade diversification:

If you look closely in the chart above (here's a snapshot):

It is pretty clear that Ireland's exports as a share of GDP have declined in 2000-2011 period for Asia, Mid East, Africa and Latin America. This represents a worrying trend, since these are the regions of future growth and, more importantly, these are also the regions more suited for our indigenous exporters. Much of the decline, in my view, is probably driven by exits of some MNCs from servicing these markets via Ireland.

27/10/2012: UK Q3 2012 'Growthology'


So UK is out of the second-dip recession? But, seemingly not out of the Great Recession:


via Citi Research.

At this speed of a 'recovery' UK folks can look forward to a down-cycle peak-to-peak of 5.5 years this time around, as compared to 4 years in the 1930s, 3 1/4 years in the 1970s and 1980s and 2 3/4 years in 1990s.

Never mind... it was so all curable by the Olympics & the Jubilee... Or as Citi put it:
"The rebound from the Jubilee in Q2 probably added about 0.5% to Q3 growth, while the direct effects of Olympic ticket sales added roughly 0.2%, and the ONS notes that there may have been wider positive effects from the Olympics on service sector growth (and this is the sector which was much stronger than we expected). So underlying growth in Q3 may have been 0.2-0.3% QoQ. In our view, the underlying path of the economy has been fairly flat throughout the last four quarters, with erratic swings in individual quarters: GDP fell in Q1 and Q2, reflecting weakness in construction in both quarters plus the adverse effects on activity of the Queen’s Jubilee, and the Olympics plus rebound from the Jubilee played a major role in the positive Q3 figure. The more that Q3  benefited from temporary Olympics-related positives, the more likely that Q4 GDP growth will disappoint as that boost fades."

27/10/2012: UBS on Irish banking debt restructuring


UBS' European Weekly Economic Focus is dealing in detail with the prospects of Ireland getting a deal out of the EU Summits promises to break the links between the banks liabilities and sovereign liabilities. Comments are mine.

"Taking the June 29th statement at face value, there is a strong case for supporting Ireland by breaking the link between the government and the financial system." 

[I wholeheartedly agree - the case can be made across a number of points: (1) Ireland de facto underwritten the euro system in the early stage of the crisis; (2) the cost of (1) to Irish taxpayers is unprecedented in modern history; (3) Irish banking fallout is partially based on absolutely mis-shaped monetary policy pursued by the ECB; (4) Ireland is the only country in the euro periphery, in my view, that has potential to organically grow out of the current Great Recession, assuming the country gets a significant (€40-45 billion) writedown on the banks debts; and more]

"There are two potential routes for euro zone support to the Irish state. The direct route involves the ESM acquiring all or a part of the government’s stake in the banks, thereby assuming responsibility of the Irish lenders and absolving that liability of the Irish state. The alternative, less generous, approach is a relief on the promissory note/ELA commitments by the ECB."

[I disagree - the impact from both of these measures taken individually will be minor. What is needed is a combination of the two measures, with ELA commitments writedown of at least €30 billion. The reason for this is simple: the ESM will not be able to take on IBRC liabilities even in theory as IBRC is not a functional bank. Hence, route 1 outlined by UBS can amount to ca €5-6 billion in maximum potential recovery to the Irish state. Route 2 take by itself alone will simply see marginal relief on the net present value of promo notes liabilities, something close to €3 billion yield. Hence, even combined, such measures are unlikely to generate more than €10 billion, or roughly 1/8th of the assumed current and future liabilities.]

"In our view, there is very little chance that the ESM will acquire a stake in Irish lenders any time soon, for the simple reason that a direct ESM intervention requires the establishment of a euro area bank regulator and that would take a long time, in our view." [I agree. And worse, not only ESM has to be fully established, it also has to be fully operational and, potentially, have a track record of sorts before it can be used to underwrite banking sector directly.]

"What’s more, Ireland will need to remain a programme country for longer. Depending on the potential scale of the intervention, the first argument is likely more important that the second, but either way this route is not likely to be available for a long time." [I fully agree and this is the reason why I argued earlier this week that the Irish Government push to 'exit' the programme is rushed and unwise.]

"How about a recapitalisation via the sovereign? To start with, this approach does not help sever the link between the sovereign and the banks, one key driver for euro area intervention. More importantly though, it is not clear to us that Ireland will qualify for that sort of intervention even if it tried, for the simple reason that ESM funds can only be provided to limit ‘the contagion of financial stress’. The financial sector in Ireland is no longer a threat to the rest of the euro area and, as such, it would not qualify for ESM intervention. 

[I spoke about this factor for a number of years now. As long as Ireland continued replacing private liabilities to bondholders and inter-bank funding sources with sovereign obligations, it continued to dilute its own power in the bargaining game. I warned years ago that once we complete this process, we will be left alone. No tramp cards in our hands. Fully exposed to carrying the weight of banking debts on taxpayers shoulders. This Government and the previous one have failed to listen. Now, its a payback time.]

"The only way around this is if the ESM facility is made available retrospectively, but that is unlikely if the statement from the Dutch, Finnish and the German finance ministers where they rejected ESM assistance for ‘legacy assets’ is true." 

[At the time of June 29th summit I wrote about the cumulative potential exposures that such retrospectively can yield. It was clear then, as it is clear now, that ESM will not be able to absorb all potential calls on such a measure. Hence, Fin Mins statement breaking retrospectively clause is fully rational and expected.]

The rest of the note is based on a superb and must-read analysis by Karl Whelan of the promo notes.

In summary - and this is my view - Irish policymakers have carelessly forced the country into a corner: we worked hard to assure some stabilization in fiscal space, which in turn undermined our ability to get meaningful relief. Congratulations to our policy makers who seemingly traded the interests of the longer term debt crisis resolution for friendly pats on the back from Europe.

Friday, October 26, 2012

26/10/2012: Sectoral breakdown of Retail Sales


In the previous post I looked at the Retail Sales dynamics from the point of view of whether September and Q3 2012 data show any really exciting change in trend to warrant exceptionally upbeat headlines. There were, basically, none.

But what about all the 'sales increases' rumored and even discussed in the analysts' reports?

Let's take at annual growth rates for Q3 by broad categories of sales:

As chart above clearly shows, majority of the categories are under water when it comes to y/y comparatives for Q3 2012.

And the same applies for Volume of sales:


Now, let's take a look at each category individually:

  • Books, Newspapers, Stationery & Other Goods: down 4.8% in Value and down 4.5% in Volume y/y in September, down 4.5% y/y in Q3 2012 in Value and down 4.3% y/y in Q3 2012 in Volume. No good news here.
  • Hardware, Paints and Glass: down 3.8% y/y in Value and down 4.3% y/y in Volume in September 2012, also down 4.8% in Value and 5.3% in Volume for Q3 2012 compared to Q3 2011. No good news here.
  • Other Retail Sales: down 3.3% in Value and down 3.1% in Volume, same down 4.2% in Q3 2012 y/y in Value and down 3.8% in Volume. No good news here.
  • Furniture & Lighting: down 2.3% in Value and up 2% in Volume in September in y/y terms, which means that the sector is trading down on revenues amidst a deflation. In Q3 terms relative to Q3 2011: the sector is down 3% in Value and up 0.8% in Volume - again, deflation and falling revenues. I wouldn't call this a good news.
  • Clothing, Footware and Textiles: down 1.7% in Value and down 0.6% in Volume in September, down 2.3% in Value and 1.4% in Volume in Q3 2012. No good news anywhere here.
  • Food, beverages & Tobacco: down 0.3% in Value in September and down 0.9% in Volume. In Q3 terms the sector is down 0.9% and 1.5% in Value and Volume respectively. All signs are, therefore, flashing red. Alongside the trends in Food and Beverages (below), the above suggest significant contraction in legal sales of tobacco, possibly due to increased tax evasion and smuggling.
  • Household Equipment: up 0.8% in Value and 5.6% in Volume, which means that deflation is erasing some 86% of the revenues out of the increased activity. In Q3 2011-Q3 2012 terms, the sector is up 0.1% in Value and up 5% in Volume. In effect, revenues standing still, while volumes of activity rising. Last time I checked, the revenues pay for staff, while volume sales pay for warehouses.
  • Pharmaceuticals, Medical & Cosmetic Articles: the less elastic in demand category of goods saw September sales rise 1.2% in Value and 2.7% in Volume, while Q3 sales saw increases of 1.2% in Value and 2.3% in Volume. This is a sector that did well out the recent data both in terms of value and volume of sales rising. All of these sales are, however imports.
  • Motors and Fuel sales rose 2.9% in Value and fell 0.5% in Volume in September. Q3 change y/y was -1.1% in Value and -4.1% in Volume. Here's an interesting thing: Fuel sales - the coincident indicator for economic activity - were up 3.5% in Value and down 5% in Volume in Q3 y/y, which means that once we strip the inflation (which goes to fund Irish Government and foreign producers at the expense of the real economy here), the sales are down and this does not bode well for Q3 economic activity.
  • Food business: is booming, rising 3.8% in value and 2.4% in Volume (suggesting inflation in food sector) in September, rising 3.1% in Value and 1.9% in Volume (confirming inflation) in Q3 2012 y/y. Now, food sales, especially in rainy July-August, could be strongly influenced by people staying at home. The same is true for the expected effects of reduced travel during summer months as fewer of us can afford trips out of Ireland and those who still can taking shorter breaks.
  • Bars had a cracking September on foot of a number of higher profile events - rising 3.9% in Value and 2.3% in Volume. However, Q3 figure confirms what is suggested by the food sector performance (above): sales are down 1.9% in Q3 y/y in Value and down 3.4% in Volume. In other words, controlling for one-offs, there is no good news in the sector.
  • Lastly, Electrical Goods. Given the switch to digital TV this month, it can be expected that sales were up 5.5% in Value and 11.2% in Volume in September, while Q3 figures were up 6.7% in Value and 12.7% in Volume. Interestingly, these sales rose 4.9% y/y in Value in Q2 2012 and 11.3% in Volume. But in Q1 the same sales were down 5.3% y/y in Value and up only 1.6% y/y in Volume. Overall, during the Great Recession the sector did better than any other sector: in Q3 2012 the index for the Value of Sales in the sector stood at 76.3 (100=2005), which is the fourth highest in the overall sectors categories. For the Volume of sales, index stood at 141.1 - the best performance by far of all sectors. 
So the key summary: Non-food retail sales excluding motor trades, fuel and bars: down 0.6% in Value and up 1.5% in Volume in September - aka deflation and falling revenues. In Q3 2012 compared to Q3 2011: down 0.7% in Value and up 1% in Volume - again, deflation and shrinking revenues. Care to suggest this is 'good'? It is better than outright y/y drop of 3.3% in Q2 2012 in Value and a decline of 1.6% in Volume, and better than -5.6% in Value and -4.3% in Volume recorded in Q1 2012, but it is comparable in Value terms to Q4 2011 (down 0.6% y/y), although still better in Volume terms (-0.7% y/y). 

Still, getting worse at a slower rate is not equivalent to getting better. And it is most certainly not a 'solid retail sales in Q3' result that is being claimed by some analysts.

26/10/2012: Retail Sales in September


In the last few days we have been treated to a barrage of the 'sell-side research notes' extolling the virtues of Ireland's economic 'comeback'. Property markets are now, allegedly, on the mend (never mind, the 'mending' bit is just about sizable enough to matter statistically and economically returns property valuations to... err... April 2012 levels). Unmeasurable 'investor confidence' is back at play - never mind that 'investors' are really a handful of buyers of the Irish Government bonds, usually with maturity range well within the cover by the Troika / ESM. Latest twist - cheerful analysis of the Retail Sales data. One note I received on today's Retail Sales figures for September 2012 was issued minutes after CSO published the data, suggesting that the author had absolutely no referencing to actual data published, but simply plucked headlines and strung them up into an analysis.

Having done some more sober analysis of the house prices data (see here), let's take a look at the Retail Sales data.

Value Index:

Core retail sales (ex-motors) value index rose (preliminary estimate - so subject to future revisions) in September to 96.5 from 96 in August. The index is now 2.88% ahead of where it was three months ago in June 2012. Month on month the index is up 0.52%, or statistically indifferent from zero increase. Current level of activity is comparable to May 2012 hen the index stood at 96.4. Year on year index is up 2.22%.

More dynamics in Value Index:

  • Q3 2012 average index reading was 96.0 against the previous quarter average of 95.1 (+0.91%).
  • In September, rate of growth in retails sales value actually declined: in June m/m rate of growth was -2.7% due to poor weather, this was reversed partially in July with a m/m rise of 1.8%. Since July, growth rate fell to 0.6% m/m in August and to 0.5% in September. This is hardly the 'good news'. 
  • Y/y growth rate in September (+2.2%) was robust, but it is driven more by a contraction in sales in August and September 2011 than by an expansion of sales in September this year.
  • Overall, core driver for July performance that determined Q3 results is the rapid fall off in Value of sales in June, not a robust growth in August and September.
  • 6mo average through September is now at 95.6 which is only 0.7% ahead of 6mo average through March 2012. September reading is below 2010-2011 average by 0.13% and is down on crisis period average by 4.9%.
Volume Index:

Core retail sales Volume Index rose from 99.2 in August to 99.8 in September, up 0.6% m/m and 1.42% y/y. The index is now 1.84% ahead of where it was at the end of Q2 2012.

Dynamics in  Volume Index:
  • Q3 2012 average index was 99.4 up on 98.6 for Q2 (+0.81%), so volume performance here is even less impressive than already underwhelming performance for Value index.
  • 6mo average through September is 99.0 against 99.3 in 6 months through March, meaning that on half-yearly basis we are still under water.
  • In 2010-2011 the Volume index averaged 101.24 against Q3 2012 average of 99.4. Make your own conclusions here. During the whole crisis, the index averaged 103.66, which means that September index is 3.73% below the crisis period average.

Now charts:


Now, onto my own index: the Retail Sector Activity Index:


Driven by a combination of weak increases in actual volume and value indices and a substantial drop off in consumer confidence (which fell from 70.0 in August to 60.2 in September), the RSA Index has fallen from 110.11 in August to 106.8 in September. During the current crisis, my RSA Index lagged 1 month actually has much stronger correlation (and positive) with retail sales volume and value (ca 83-84%) than consumer confidence (which has a negative and weak correlation with both value and volume indices - ca -30-34%). Hence it acts as a better predictor of the forthcoming activity. The RSAI is now down m/m, but is up y/y and Q3 average is up on Q2 average. 

This means that I can't call the new trend confirmation on the basis of positive monthly rises in Q3 2012 nor can I call the return of the downward trend. Put differently, real data suggests that things are bouncing along flat trend so far. Unlike the claims by some Irish 'analysts' who see "solid retail sales" data.


26/10/2012: Few interesting links

Some links on recent studies of interest

Two hugely important studies from the Kauffman Foundation on the role of immigration in entrepreneurship and human capital as a driver of future economic growth.

Iceland's assessment of financial stability for 2012 Q1 covering in detail household debt dynamics (from page 23) and detailing the success of the Iceland's systemic debt restructuring arrangements.


Thursday, October 25, 2012

25/10/2012: IFS Roundtable: November 1


I will be chairing an industry roundtable on disruptive innovation in international financial services on November 1, 2012. Details:


25/10/2012: Signs of Life or a Dead-Cat Bounce : RPPI September 2012


With some delay an update on the latest data from the Residential Property Price Index for Ireland and some longer-range thoughts on property prices direction.

First top level data:

Headline RPPI has risen from 64.2 in August to 65.8 in September (+0.92% m/m). The index is still down 9.62% y/y.

  • This marks a third consecutive month of index increases (July +0.15%, August +0.46%) and over the last 3 months cumulative index gains were 1.54% (annualised rate of growth of 6.32%). This is one headline  you keep hearing. However, last 6 months cumulative change in the RPPI is still negative at -0.45% (annualized rate of growth of -0.91%).
  • What you don't hear about is that August rise was the first statistically significant increase in the index since February 2007 (in m/m terms) and the largest monthly rise since then (in February 2007 index rose 0.935% m/m). In general, irish statistical releases do not provide analysis of statistical significance of changes. Yet, the lack of statistical significance in previous monthly increases is precisely the reason why I am hesitant in calling the trend reversal (on dynamics - for fundamentals, see below).
  • Year on year September showing (-9.62%) is the best since October 2008 when y/y change was 9.53%. This too is a decent sign. However, it is statistically in-distinguishable from the crisis period average of -12.95%. Which is exactly the point of dynamics - while three months of slight increases is a good sign, it is still fragile to establish a trend reversal formally.
  • The index is now 49.58% off the peak, so overall prices have roughly returned to the level where they were... err... in March-April 2012. With all the hoopla of the 'stabilisation' and 'price increases' over the last 3 months, all we've regained in terms of prices is roughly-speaking 5 months worth of prices. Three steps forward, two steps back market is only as good as the pattern repeats, like, 10 times or so?


Dublin trends: RPPI for Dublin rose to 58.7 in September from 57.3 in August (+2.44% m/m) but is still down 9.83% y/y. The dynamics for Dublin prices imply 3mo cumulative rise in prices of 1.56% (+6.38% annualized) and 1.21% cumulated increase in 6 months (annualized +2.43%). It is clear that Dublin prices drive national trends and that in dynamic terms, Dublin prices are pretty much in the very same shape as national prices.
  • Just as with national prices, Dublin prices m/m increase in September was the first statistically significant rise for the entire period of the crisis. This is good. 
  • Dublin prices currently stand at the levels comparable to December 2011-January 2012, which is marginally better than the prices levels nationwide.
  • Of course, Dublin prices have fallen to 56.36% of their peak (at the trough level, the decline was 57.40%).
  • However, dublin price increase in m/m terms in September is the first monthly increase and can probably be explained by a number of one-off factors (see fundamentals discussion below).

Overall, my conclusion is that there is a welcome tentative sign of stabilization in the national house prices trend, but it is too early to call a reversal of the trend to rising prices.

The risk is still exceptionally heavily weighted to the continued decline in Irish property prices for a number of fundamental reasons:
  1. In my opinion, August-September figures, and likely the rest of the year figures are skewed by a number of one-off factors: eminent expiration of interest relief measures, comes January 2013, build up of demand during the rain-soaked summer when house-viewing was outright an occupation for the brave, a number of larger auctions coming through both brining in some supply to the market and generating a bit of a hype in the media.
  2. In 2013 we can expect serious pressure on the market rising from such longer term factors as:
  • Budget 2013 income and indirect tax changes that will reduce further purchasing power of Irish households;
  • Budget 2013 changes in relation to property taxation;
  • Continued increases in mortgage rates charged by the banks compounding after-tax income decreases to be delivered by the Budget;
  • Gradual acceleration of foreclosures during the second half of 2013 as Personal Insolvencies Bill  starts to bind;
  • Potential changes to pensions funding reliefs resulting in a last-minute rush to recap pensions in anticipation of future changes which wil act to reduce funds available for purchases;
  • Reductions in the deposit rates in the banks will lead to a gradual shifting of savings out of cash deposits into pensions and investment products (this factor can also provide some relief to the property markets, although this support is likely to be more fragile than property agents and mortgages brokers might suggest)
  • Yields can significantly decline if/when buy-to-let properties start flooding the markets (my expectation - late 2013-early 2014).
None of the above prices the risk of further economic deterioration. Yet, as today's Troika statement clearly suggests, we are likely to witness declines in real GNP this year and next - which will do nothing to support price appreciation in the property markets.

I am currently reworking my 2012-2013 forecasts for the property prices in Ireland, so stay tuned for the updates.

25/10/2012: My notes for the interview on Troika review


Here is transcript of my interview on today's radio programme covering the Troika review of Ireland - warning: unedited material. Italics denote quotes from the Troika statement.


Unfortunately, Ireland's recovery will not be achieved or even started by the exit from Troika funding program. For a number of reasons, conveniently omitted by Minister Noonan, but some of these are hinted at in the Troika assessment:

1) Real recovery will require dealing with private (household) debts. This is not happening and Troika review, as well as increasingly frustrated tone coming from our own Central Bank clearly show that. 
Once Ireland exits the bailout, we will have to fund our Exchequer debt repayments and reduced deficits via borrowing in the private markets. It might be that we will be able to fund ourselves at lower cost than currently, but the cost is likely to be still above that obtainable via ESM or Troika. This means more resources will be sucked out of the weak economy, further reducing the pace of private economy deleveraging. In other words, exit from the bailout will likely make it harder for the economy to recover.

2) Real recovery will require economic activity to start picking up in terms of private domestic investment, household spending, expanded activities by our own firms, not MNCs in exporting. All of this requires credit, it also requires disposable income.  Again, this will be only hindered by Ireland 'exiting' Troika funding.

3) Recovery in the  fiscal space will require lower, not higher, costs of funding for the Exchequer debt roll-overs and paydowns of Troika debts. As above, exit from the bailout will likely assure that this cost will be rising, not falling.

4) Recovery in the economy will require the Exchequer restructuring, significantly, some of the banks-related debts carried by the State. Most notably - the likes of the promissory notes - and this is clearly not going to be consistent with the Exchequer borrowing in the markets, at least not while we restructure the banks-related debt. It is better for Ireland to stay within the ESM and deliver on restructuring, and only after that aim to gradually exit the programme.

5) Lastly, recovery on exit from the program will require more aggressive reforms and stringent adherence to the fiscal discipline established. Alas, once we exit the program, the Government will lose its ONLY functional trump card in dealing with the Trade Unions. The Bogey Man of the Troika will be gone and the Social Partners will most likely exert pressure on the Government to borrow beyond its means to compensate them for the hardships of the Troika period. We can be at a risk of undoing overnight the precious little progress we've achieved to-date.

So, overall, I do not think this economy is going to recover once we exit the bailout. In fact, I think the entire logic of this argument as advanced by Minister Noonan is backwards. We should only exit the bailout once the economy is sufficiently strong to sustain orderly transition from subsidized funding to real world funding. Exiting Troika arrangements will not free Ireland from painful adjustments needed, but will likely risk derailing what has been achieved so far.


On Troika review specifics:

Banks remain well-capitalised and downsizing has progressed well, yet further efforts are needed to address their profitability and asset quality challenges.
Irish banks are well capitalized solely because there are no substantial writedowns of mortgages being undertaken in the banking sector. Meanwhile, mortgages arrears are snowballing, implying that the current levels of capitalization are unlikely to be sustained in the short term future. In other words, Troika praise here is simply a PR exercise.

Real GDP growth has slowed to a projected rate of ½ percent in 2012. Prospects for growth in 2013 are for modest pick up to just over 1 percent as domestic demand declines moderately...
So if I get this right: GDP will grow 0.5% in 2012 and 1.0% in 2013. GNP will shrink in 2012 and 2013 as well. Which means the real economy in Ireland - the one you and I and the listeners to this station are inhabiting will be shrinking 6 years in a row. That's 'strong performance'? In real terms we had GNP of 162bn in 2007, it fell to 127 billion in 2011 and is now, as IMF suggests will fall even further - close to 122-124bn or lower by the end of 2013. This is the much-lauded recovery we are bragging about?!

The authorities are ramping up reforms to restore the health of the Irish financial sector so that it can help support economic recovery. Intensified efforts are required to deal decisively with mortgage arrears and further reduce bank operating costs.
What are these reforms? Anyone noticed ANY progress in the banking sector? Especially on dealing with mortgages? I didn't. May be Minister Noonan can show us some couples who had their debt problems resolved? Not delayed, not shelved, but actually resolved. 

25/10/2012: Icelandic experience on mortgages writedowns


Very interesting post linking Icelandic experience in mortgages writedowns to Ireland's situation from Sigrún Davíðsdóttir link here.

Needless to say, I agree - we need a sustainable long term solution and this will require dealing systemically with private debt overhang.


25/10/2012: Cool infographic on social media use in the US Elections


Cool infographic summarizing use of social media in the US elections so far:
http://open-site.org/blog/social-media-election/

(click to enlarge or best go to the link above)


Tuesday, October 23, 2012

23/10/2012: Article in Expresso


A link to the Portugal's Expresso article on sovereign debt risk premia quoting me.

23/10/2012: HFT restrictions and market efficiency


In my class on Investment Theory (MSc in Finance, TCD) we've discussed the issues relating to markets efficiency, HFT and relative speeds in newsflow and trading. We are going to talk more about this subject in my course on HFT in early 2013.

Here is the latest report on the effects of the EU regulatory interference in HFT.

Quote: "European Union plans to clamp down on trading shares faster than the blink of an eye could damage market efficiency and reduce liquidity, a UK government-sponsored paper said… A report by the Foresight Project, which was sponsored by the British government and gathered evidence from 150 academics and experts from 20 countries, said plans to force minimum resting times on orders could reduce liquidity."

The Project (led by John Beddington, the UK's chief scientific advisor) has found that:

  • "...some of the commonly held negative perceptions surrounding HFT are not supported by the available evidence and, indeed, that HFT may have modestly improved the functioning of markets in some respects"
  • "However it is believed that policymakers are justified in being concerned about the possible effects of HFT."
  • "The report found no direct evidence that HFT increased volatility, nor evidence to suggest it has led to an increase in market abuse."
  • "It said that computer-based trading could have adverse side effects in some circumstances and that these risks should be addressed."
As my students would know, I am of two views on HFT:
  1. HFT is a necessary activity with inherent risks (as any other activity in the market) 
  2. HFT can act in contradiction to the direct real-activity nature of the financial markets, but so can other financial instruments and strategies (e.g. hedging across non-asset-related risks, e.g. using Forex markets).

23/10/2012: Signs, Indicators and Noise


From time to time in the past I used to look at CDS spreads for sovereigns. I have not done so in a while. In fact, I have not even updated my database for these in a while. Why? Because something is dodgy about the sovereign assets' market that is manipulated by the sovereigns. And here's a quote from the TF Market Advisors that sums it up well enough:

"One of the effects of the central bank policies is that many of the more obscure parts of the market that you could look to for clues or early warning signs have been eliminated. Sure these markets still exist, but the information from them is so manipulated that it is difficult to get a clear read."

  1. LIBOR : "Between Fed lending programs, LTRO, and the lawsuits, I have no clue what to make of LIBOR other than it probably isn’t a whole lot of use as a sign of anything."
  2. EUR/USD 3 month basis swap : "...was another useful indicator showing the relative strength of US banks versus European banks. Again with LTRO and various central bank global swap lines, this measure has become useless. With banks willing to use central bank liquidity without fear of reprisals or negative stigma, they do, and this rate hovers right around where the governments would like it to be."
  3. European sovereign CDS : "has become far more difficult to interpret as all these naked bans get enforced. French CDS went from 106 on the 11th of October to 65 today, in pretty much a straight line. I have difficulty thinking of one real reason that France could have done so well – they have funded ESM, instituted some domestic policies that seem dubious at best, have had weak economic data, and are marching to the beat of their own drum in the Euro in a way that indicates willingness to take on more debt, yet they are tighter. This makes it hard to figure out what is going on in European bank CDS."
  4. US Treasury Yields : "...are very difficult to figure out. The Fed owns over 35% of treasuries with maturities 5 years and longer. Almost everything you would look at and try and infer from the treasury market is skewed by that."
  5. Economic data "has even come under attack. In general I don’t believe the data is manipulated, particularly not for political purposes (but there are a growing number of people who do). But I do think they try and cover up their own mistakes. Jobless claims came in at 337k or something (pre upward revision) two weeks ago. There was a lot of concern, and some very good economists spoke to the BLS and came up with the conclusion that one big state had not sent in their quarter end revisions in time. There was some confirmation of this, but then some sort of denial. Missing the deadline would be an honest mistake in my opinion, it shouldn’t happen, but I can see how it could. Then last week, we posted 388k as the number. Now we have data that looks like 369k, 342k, and 388k. Is the reality that had they properly accounted for the missing number, that the claims have been 369k, 365k, 365k? If so, we have okay but steady claims. If the actual data is correct (which I don’t think it is) then we would have seen some euphoric hiring followed by aggressive firing. I find that harder to believe."
Note, I wrote about US jobless claims figure here.

There is a major problem, folks. While we can debate the numbers left, right and center, what is clear is that the current environment (political, monetary and policy) is becoming less and less transparent. The market signals are being distorted (willingly and via the law of unintended consequences) and this does not bode well for the future. 


Monday, October 22, 2012

22/10/2012: Financial Crises: Borrowers Pain, Creditors Gain


A very interesting paper on the effects of the financial crises on imbalance of power (and thus the imbalance of the incidence of costs) between the borrowers and the lenders. The paper is a serious reality check for Irish policymakers in the context of the 'reforms' of the Personal Insolvency laws currently being proposed. In fact, the Irish proposed 'reforms' actually tragically replicate the very worst implications of the study summarized below.

"Resolving Debt Overhang: Political Constraints in the Aftermath of Financial Crises" by Atif R. Mian, Amir Sufi, and Francesco Trebbi (NBER Working Paper No. 17831, February 2012 http://www.nber.org/papers/w17831) shows that "debtors bear the brunt of a decline in asset prices associated with financial crises and policies aimed at partial debt relief may be warranted to boost growth in the midst of crises. Drawing on the US experience during the Great Recession of 2008-09 and historical evidence in a large panel of countries, [the study explores] why the political system may fail to deliver such policies. [The authors] find that during the Great Recession creditors were able to use the political system more effectively to protect their interests through bailouts. More generally we show that politically countries become more polarized and fractionalized following financial crises. This results in legislative stalemate, making it less likely that crises lead to meaningful macroeconomic reforms."


Mortgage recourse:
"The higher level of recourse and tougher rules for declaring bankruptcy are likely to prevent borrowers from declaring default. As a result, debtors in European countries are more likely to absorb financial shocks internally than declare default. …We investigate this …by comparing the change in default rates across Europe and the United States during the 2007 to 2009 global housing crisis. Since the bankruptcy regime is relatively more lax in the United States, one would expect a larger increase in default rates." Controlling for rates of decline in house prices and the level of indebtedness of the borrowing households (LTVs at origination) the authors test explicitly data for US, U.K., Spain, France and Ireland from 2007 to 2009 using data from the European Mortgage Federation. 

Figure 1 


"The change in default rate (red bar) for USA between 2007 and 2009 is 5.9 percentage points. While the default rate level in 2007 is not shown in Figure 1, it is quite low and similar across the five countries (0.4%, 1.2%, 0.7%, 1.9%, and 2.1% for France, Ireland, Spain, the United Kingdom and the United States, respectively). …All European countries in Figure 1 have high recourse and tough bankruptcy laws relative to the United States. The very large increase in default rates for the US is consistent with the notion that lower level of recourse and easier bankruptcy legislation helps indebted borrowers declare default. …A collective look at the three housing market variables in Figure 1 shows that the United States experienced the highest increase in default rates by far, despite some of the European countries experiencing very similar (if not stronger) decline in house price (e.g. Ireland) and having similar housing leverage (Ireland and the United Kingdom)."

  
The Political Response to Financial Crises and Debt Overhang:
                                                
"The 2007-2009 US financial crisis provides an interesting case study to examine the political tug of war between debtors and creditors. …[In the US], housing assets were the main asset for low net worth individuals, and their housing positions were quite levered. As a result, the collapse in house prices disproportionately affected low net worth individuals. Mian, Rao, and Sufi (2011) show that at the 10th percentile of the county-level house price distribution, house prices dropped by 40 to 60% depending on the house price index used. This decline would completely wipe out the entire net worth of the median household in lowest quintile of the net worth distribution. CoreLogic reports that 25% of mortgages are underwater; for the low net worth individuals in the US, this effectively means that their total net worth is negative." 

"It is in this context that Mian, Sufi and Trebbi (2010a), henceforth MST, document the political economy of two major bailout bills that were passed in the US Congress in 2008. The first of these bills, the American Housing Rescue and Foreclosure Prevention Act (AHRFPA), provided up to $300 billion in Federal Housing Administration insurance for renegotiated mortgages, which translated into using public funds to provide debtor relief… At the same time, creditors--i.e., the shareholders and debt-holders of large financial institutions--pushed a second bill which was closely tied to protecting their own interests [the $700 billion Emergency Economic Stabilization Act (EESA) which eventually led to TARP]…"

"While both debtors and creditors were effective in passing legislation in their favor, there were two important differences in the magnitude of their effectiveness. First, the debtor friendly bill provided fewer resources ($300 billion versus $700 billion) than the creditor friendly legislation… [despite the fact that] debtors faced substantially larger losses …than creditors in the face of the US housing crisis. Second, while the creditor friendly EESA bill was fully implemented and executed, the housing legislation was a miserable failure. As of December 2008, there were only 312 applications for relief under the program and the secretary of Housing and Urban Development was highly critical of the program. … When Obama Administration …implemented the Home Affordability Modification Program under AHRFPA, their initial goal was to help 3 to 4 million homeowners with loan modifications. In July, 2011 President Obama admitted that HAMP program has “probably been the area that's been most stubborn to us trying to solve the problem.”" 

"It is worth noting that one of the main reasons for the ineffectiveness of the HAMP program has been the lack of cooperation from creditors. The initial legislation made creditor cooperation completely voluntary, thereby enabling many creditors to opt out of the program despite qualifying borrowers. In fact, as Representative Barney Frank noted, banks actually helped formulate the program in the summer of 2008."

Need I remind you that in Ireland's reform bill to alter the draconian personal insolvency laws currently on the books, the banks not only have an option of voluntary participation, but an actual veto on resolution mechanism deployed.

"Cross-country evidence on financial crises and change in creditor rights The seminal work of La Porta et al (1998), followed by Djankov et al. (2007), introduced cross-country index of “creditor rights” from 1978 to 2002. The index captures the rights of secured lenders under a country’s legal system. A country has stronger creditor rights if: 
  1.  there are restrictions for a debtor to file for reorganization [In the case of Ireland's Insolvency Law reform, this factor is actually made worse than in the current legislation since the reform law is going to force debtors to undergo a period of compulsory arrangements dictated solely by the banks before they can file for bankruptcy]; 
  2. creditors are able to seize collateral in bankruptcy automatically without any “asset freeze” [again, my reading of Ireland's 'reform' proposals suggests automatic seizure of assets once bankruptcy is granted]; 
  3. secured creditors are paid first [as is the case in Ireland]; and 
  4. control shifts away from management as soon as bankruptcy is declared.  


"Overall, while creditor rights promote the origination of more credit, a financial crisis that results from excessive debt tends to reduce creditor rights. These results highlight a fundamental tension between the benefits of stronger creditor rights ex-ante and the debt overhang costs associated with giving creditor too much power in the financial crisis state of the world. Ex-post relaxation of creditor rights is not the norm after a financial crisis. …More specifically, we show that financial crises are systematically followed by political polarization and that this may result in gridlock and anemic reform. …Financial crises polarize debtors and creditors in society. On the one hand, debtors are weakened by a fall in the value of assets they hold. On the other hand, creditors become more sensitive to write-offs during bad times …and possibly more reluctant to converge onto a renegotiated platform because of their increased reliance on the satisfaction of the original terms of agreement."

22/10/2012: Income Tax in Ireland: a snapshot


Another tax chart (source here) on effective income & social security taxes in various countries:


And so where's Ireland in this? I took KPMG tax calculator for 2012 and... for a person on $100,000 (depending on which exchange rate you take - spot or 3mo average), Ireland scores:

  • Self-employed person, single, no children effective tax rate of 40%
  • PAYE effective tax rate of 37.5-37.75%
  • Average for a single earner tax rate of 38.42%
See for yourselves where that places Ireland.

More on this in forthcoming Village Magazine issue.

22/10/2012: Is Ireland a 'Special Case' in the Euro area periphery?


Since the disastrously vacuous summit last Thursday and Friday, there has been a barrage of 'Ireland is special' statements from Merkel and other political leaders. The alleged 'special' nature of Ireland compared to Greece, Portugal and Spain is, supposedly, reflected in Irish banks being successfully repaired and Irish fiscal crisis corrected to a stronger health position than that of the other peripheral countries.

I am not going to make a comment on the banking system's functionality in Ireland compared to other states. But on the fiscal front, let's take a look. Per IMF:

  • In 2012 we expect to post a Government deficit of 8.30% of GDP against Greece's deficit of 7.52%, Portugal's 4.99% and Spain's 6.99%. We are 'special' in so far as we will have the highest deficit of all peripheral countries.
  • In 2013, Ireland is forecast to post a Government deficit of 7.52% of GDP against Greece's 4.67%, Portugal's 4.48% and Spain's 5.67%. Once again, 'special' allegedly means the 'worst performing'.
  • In 2012, Ireland's structural deficit would have fallen from 9.31% of potential GDP in 2010 to 6.15% - a decline of 3.16 ppt. For Greece, the same numbers are 12.12% to 4.53% - a decline of 7.59 ppt or more than double the rate of austerity than in Ireland. For Portugal, these numbers are  8.96% to 4.09% - a decline of 4.87 ppt of more than 50% deeper reduction than in Ireland. For Spain: 7.32% to 5.39% - a drop of 1.93 ppt or shallower than that for Ireland.
  • In 2013 in terms of structural deficit, Ireland (5.38% of potential GDP deficit) will be worse off than Greece (-1.06% of potential GDP), Portugal (2.28%) and Spain (3.52%)

Now, run by me what is so 'special' about Ireland's fiscal adjustment case?

Can it be that we are 'lighter' than other peripherals on debt?
  • 2010 Government debt in Ireland stood at 92.175% of GDP and this year it will be around 117.743% - up 25.255% of GDP. For Greece this was respectively 144.55% of GDP in 2010 and 170.731% in 2012 - a rise of 26.181%, marginally faster than that for Ireland. For Portugal, gross Government debt was 93.32% of GDP in 2010 and that rose to 119.066% in 2012, an increase of 25.746%. Again, not far from Ireland's. And for Spain, these numbers were 61.316% to 90.693% - a rise of 29.377%. So while Spain is clearly the worst performer in the class, Ireland, Greece and Portugal are not that far off from each other.
Wait, what about economic reforms and internal devaluations? Surely here Ireland, with its exports-focused economy is a 'special' case?
  • In 2012, Ireland is expected to post a current account surplus of 1.813% of GDP, against deficits of between 0.148% and 2.909% for the other three peripheral countries. This, of course, is not the legacy of Irish reforms, but of the MNCs operating from here.
  • However, in terms of current account dynamics, Ireland is not that special. Between 2010 and 2012, Greece will reduce its current account deficit by 4.294 ppt, Ireland will improve its external balance by 0.674 ppt, Portugal by 7.105 ppt and Spain by 2.278 ppt. So Ireland is the worst performing country of four in terms of current account dynamics, while the best performing in terms of current account balance.
Now, do run by me what can it possibly mean for Ireland to be a 'special' case compared to Greece, Portugal and Spain?

Sunday, October 21, 2012

21/10/2012: Some links for Investment Analysis 2012-2013 course


For Investment Analysis class - here are some good links on CAPM and it's applications to actual strategy formation & research, and couple other topics we covered in depth:

Classic:
"The Capital Asset Pricing Model: Theory and Evidence" Eugene F. Fama and Kenneth R. French : http://papers.ssrn.com/sol3/papers.cfm?abstract_id=440920

"CAPM Over the Long-Run: 1926-2001", Andrew Ang, Joseph Chen, January 21, 2003: http://papers.ssrn.com/sol3/papers.cfm?abstract_id=346600

"Downside Risk", Joseph Chen, Andrew Ang, Yuhang Xing, The Review of Financial Studies, Vol. 19, Issue 4, pp. 1191-1239, 2006

"Mean-Variance Investing", Andrew Ang, August 10, 2012, Columbia Business School Research Paper No. 12/49  http://papers.ssrn.com/sol3/papers.cfm?abstract_id=2131932&rec=1&srcabs=2103734&alg=1&pos=1


More related to the Spring 2013 course on HFT and Technical Models:
"A Quantitative Approach to Tactical Asset Allocation" Mebane T. Faber : http://www.mebanefaber.com/2009/02/19/a-quantitative-approach-to-tactical-asset-allocation-updated/

"The Trend is Our Friend: Risk Parity, Momentum and Trend Following in Global Asset Allocation", Andrew Clare, James Seaton, Peter N. Smith and Stephen Thomas, 11th September 2012: http://papers.ssrn.com/sol3/papers.cfm?abstract_id=2126478

"Dynamic Portfolio Choice" Andrew Ang: http://papers.ssrn.com/sol3/papers.cfm?abstract_id=2103734

21/10/2012: Overselling & Overhyping


Here's at last a significant recognition from the Irish media that the Government should be held accountable for the claims it makes relating to 'selling' newsflow to the public.

The Irish Government has grossly oversold and mis-interpreted the June 29 EU Summit outcomes, and then subsequently opted to actively undervalue the statements made by the EU states' officials on interpretation of the summit results.

I wrote about this matter here, here, here and here.

Saturday, October 20, 2012

20/10/2012: Is there a WW3 going on somewhere?


Is there a war of major proportions the US fighting somewhere?..


And may be Japan and Europe are all fighting for something pretty big too?


20/10/2012: Irish Agriculture 2009-2011 - Value Added


CSO released data for gross value added in agriculture for 2009-2011 yesterday - a set of data that reveals the final figures for the various sources of income in Irish agriculture. The good news is that in 2011 the subsidies junkies have managed (in part on foot of booming agricultural prices) to derive some net value added from their activities. The bad news is that ba far the Agricultural sector in Ireland remains unproductive.

The core figures are defined as follows:
  • Net subsidies: Subsidies on products less taxes on products plus subsidies on production less taxes on production.
  • GVA at basic prices = Operating surplus + Compensation of employees + Fixed capital consumption - Other subsidies less taxes on production
I have written on many occasions before that Irish agriculture is an extension of the welfare state, in so far as most of the value added in it is provided for by the subsidies. Here are the latest details:

Thus, only in the South-West did 2011 net of tax subsidies cover less than 50% of the operating surplus. In Broder, Midland and Western region, net subsidies exceeded operating surplus.

Over the last 3 years:
  • Value of the total output in Livestock nationwide rose from €2,225 million in 2009 to €2,281 million in 2010 and €2,665 million in 2011 - an increase for 2009-2011 of cumulative 19.8%
  • Value of the total output in Livestock Products nationwide rose from €1,148 million in 2009 to €1,591 million in 2010 and €1,887 million in 2011 - an increase for 2009-2011 of cumulative 64.3%
  • Value of the total output in Crops nationwide rose from €1,377 million in 2009 to €1,523 million in 2010 and €1,751 million in 2011 - an increase for 2009-2011 of cumulative 27.1%
  • Value of the Total Goods Output in Agriculture nationwide rose from €4,751 million in 2009 to €5,395 million in 2010 and €6,303 million in 2011 - an increase for 2009-2011 of cumulative 32.7%
  • However, there was also a 16.9% rise in Intermediate Consumption of inputs that went into supplying the above Total Goods Output in Agriculture, which rose from €4,185 million in 2009, to €4,302 million in 2010 and €4,890 million in 2011.
  • At the same time, Net Subsidies (as defined above) rose only marginally - by 0.04% cumulative, from €1,813 million in 2009declining first to €1,649 million in 2010 and rising to €1,814 million in 2011.
  • As the result of this, Operating Surplus in Irish Agriculture went from €1,446 million in 2009 to €1,841 million in 2010 and to €2,395 million in 2011, posting a cumulated rate of growth for 2009-2011 of 65.7%.
All of the above means that absent net subsidies, Irish Agriculture's contribution to the economy (net of costs) would have been: a loss of €367.4 million in 2009, a gain of €192.5 million in 2010 and a gain of €581.5 million in 2011. With a sector that has managed to add - out of its own activity - just €406.6 million to the economy cumulative over last 3 years, we have a lot of policy and marketing hoopla about the value of Ireland's Agriculture.

The table below summarizes inputs and outputs in the GVA calculation for Irish Agriculture:

Even taking into the account wages paid by and to Irish farmers, the overall Agriculture's importance to the economy is (on the net) minor. Oh, and above does not account for the cost of running the Department of Agriculture and other tax-related spending that effectively is an added cost to the taxpayers.