Showing posts with label Irish residential property prices. Show all posts

Sunday, March 10, 2019

10/3/19: Irish Residential Construction Sector 2018: A New 'Recovery' Low


It has been an ugly decade for Ireland's building and construction industry. especially for housing. Following a historically massive bust in 2009-2012, indices of total production in the housing sub-sector fell from the pre-crisis high of 751.7 for value and 820 for volume, attained in 2006, to their lowest cyclical points of 57.9 and 59.5, respectively, in 2012. In other words, from 2006 through 2012, Irish residential building and construction production fell a massive, gargantuan, non-Solar-System-like 92.3% in value terms and 92.74% in volume terms. That was bad.

The recovery has not been any better. Since the lowest point of the cycle in 2012, through 2018, based on the latest figures from CSO, value of production in residential construction sector rose to 186.6, an uplift of 222.3% and volume rose to 176.9 (a rise of 197.3%). Still, compared to pre-crisis peak, current value of production in Ireland's residential building and construction sub-sector is down 75.2%, still, and in volume terms it is down 78.4%.


Of course, comparatives to the peak production year would be subject to criticism that things should be benchmarked by something 'other' than the levels of activity achieved during the bubble. I disagree. Back in the days of the bubble, Ireland experienced rampant house price inflation, as demand was still lagging behind supply. But, let me entertain, as in the above chart, an argument about averages over two periods: the period of the pre-bust activity and the period of the recovery activity.

Ireland today has an acute crisis in the supply of homes. There is no question about that. What 2018 figure shows, however, is far worse. In 2018, value of production in residential construction sector in Ireland grew by only 6.88% y/y - the slowest pace of growth since the recovery started in 2013. By volume, activity grew only 3.75% y/y in 2018 - also the slowest pace for the recovery period. As the crisis in supply of homes get worse, the rates of growth in the 'recovering' sector get shallower. This suggests that Irish residential construction is nowhere near the trajectory needed to achieve the rates of growth required to fill the gap in the housing supply.

In all 12 years of positive growth (between 2000 and 2018), last year marked the worst rate of growth in Value and the second worst year of growth in Volume terms. To put things into perspective: under 2018 growth rates, Irish residential building and construction production won't reach its 2000-2007 average levels until mid-2033 in value terms and mid-2052 in volume terms.

Saturday, August 12, 2017

12/8/17: Are Irish Property Prices on a Sustainable Path?


Some of the readers of this blog have been asking me to revisit (as I used to do more regularly in the past) the analysis of Irish property prices in relation to the ‘sustainability trend’. With updated CSO data on RPPI, here is the outrun.

The charts below show current National and Dublin property price indices in relation to the trends computed on the basis of the following CORE assumptions:
  • Starting period: January 2005
  • Starting index ‘sustainability’ positions: National = 82.0 (implying that long-term sustainable market valuations were around 18 percentage points below market price levels at January 2005 or at the levels comparable to Q4 2010); Dublin = 83.0 (implying 17 percentage points discount on January 2005).


Charts above use the following SPECIFIC trend assumptions:
  • Linear (simplistic) trend at 2% inflation target + 0.5 percentage points margin. This implies that under this trend, property prices should have evolved broadly-speaking at inflation, plus small margin (close to tracker mortgage rate margin).


In all cases, current markets valuations are well below the long-term sustainability target and there is significant room for further appreciation relative to these trends (see details of target under-shooting in the summary table below).


Chart above shows tow series sustainability targets computed on the basis of different specific assumptions, while retaining same core assumptions:
  • I assume that property prices should be sustainably anchored to weekly earnings. 


Using only weekly earnings evolution over January 2005-present, as shown in the above chart, both Dublin and National house prices are currently statistically at the levels matching sustainability criteria. There is no statistical overshooting of the sustainability bounds, yet.


Chart above again modifies specific assumptions, while retaining the same core assumptions. Specifically:
  • I assume that both earnings and interest rates (using Euribor 12 months rate as a dynamic gauge) co-determine sustainable house prices. In a away, this allows us to reflect on both income and cost of debt drivers for house prices.


As the chart above clearly shows, both National and Dublin property markets are still well underpriced compared to the long term sustainability targets, defined based on a combination of earnings and interest rates. Note: correcting this chart for evolution of unemployment brings sustainability benchmarks roughly half of the way closer to current prices, but does not fully erase the gap.

Summary table below:


So, overall, the above exercise - imperfect as it may be - suggests no evidence of excessive pricing in Irish residential property at this point in time. There are many caveats that apply, of course. Some important ones: I do not account for higher taxes; and I do not factor in difficulties in obtaining mortgages. These are material, but I am not sure they are material enough to bring the above gaps to zero or to trigger overpricing. Most likely, the national residential prices are somewhere around 5-7 percent below their sustainability bounds, while Dublin prices are around 7-10 percent below these bounds. Which means we have a short window of time to bring the markets to the sustainable price dynamics path by dramatically altering supply dynamics in the property sector. A window of 12-18 months, by my estimates.

Monday, July 27, 2015

27/7/15: Irish Property Prices: 2Q 2015


Latest data from CSO for June 2015 shows significant slowdown in house prices inflation across all segments of the market.

Monthly results are summarised in the table below


Using historical data, quarterly figures are pretty poor:

  • Dublin residential properties index in 2Q 2015 was 15.4% up on same period in 2014, which marks a major slowdown in growth from 21.9% y/y growth recorded in 1Q 2015.
  • Outside Dublin residential property prices rose 10.98% y/y in 2Q 2015, which is faster than 9.39% rise in 1Q 2015.
  • National residential prices were up 13.40% in 2Q 2015 compared to the same period in 2014, while 1Q increases were slower at 15.75%.
  • Compared to 2Q 2014, y/y growth fell in Dublin and Nationwide, but rose Outside Dublin


Finally, based on the first 6 months of 2015, here is the current residential price index for Dublin compared to long-term fundamentals price trends (at inflation and at ECB target rate):


So what is going on in the markets to drive prices inflation moderation?


  1. Poor affordability: wages growth did not keep up with prices inflation in recent years, which means that once the savings pool for downpayment cushions is exhausted, households will be finding it increasingly difficult to secure purchases at current prices. Affordability is also impaired by rising rents - which take larger and larger chunks of household income that could have gone to savings for a downpayment on mortgages.
  2. Households' purchasing power in the property market was also reduced significantly by new lending caps introduced by the Central Bank of Ireland back in February this year. Caps restrict mortgages to LTV ratios <80 15="" 85="" all="" be="" can="" for="" in="" issued.="" issued="" loans="" mortgages="" new="" of="" only="" other="" words="">80% LTVs. Additional caps apply to loan-to-income (LTI) ratios, with only 20% of new loans allowed to exceed 3.5x income. Irish house prices are currently at around 5x average / median income nationwide and 6x in Dublin Worth noting that CSO series for house price indices are based on 3mo average, so February changes can be expected to feed through into data from around April on. 1Q effect was largely anticipatory, while 2Q effect is now pricing CBI rules changes.
  3. Geographically - the above effects are compounded in Dublin where income ratios are more stretched and rents are higher and rising faster.

In line with the above, transactions volumes are slipping as well: in 1Q 2015 volume of transactions registered in Ireland was up 54% y/y - signalling buyers booking in pre-restriction mortgages. In 2Q 2015 this appears to have fallen (data is still incomplete) to a 17-19% growth rate y/y. Compared to FY 2014 average increase of 45% this rate of transactions growth is low, although in my view, the supply of quality properties in the market has also moderated significantly in recent quarters.

Are we going through another boom-to-bust sub-cycle here? I am not sure. All will depend on what prices will do over the next 12 months or so, with potential trend change (from downside to growth) around 1Q 2016. Too far to call.

Friday, May 8, 2015

8/5/15: Irish Residential Property Prices: Q1 2015


Updating residential property price indices for Ireland for 1Q 2015:

  • National property prices index ended 1Q 2015 at 80.7, up 16.79% y/y - the highest rate of growth in series history (since January 2005), but down on 4Q 2014 reading of 81.4. Latest reading we have puts prices at the level of October 2014. Compared to peak, prices were down 38.2% at the end of 1Q 2015. National property prices were up 25.9% on crisis trough in 1Q 2015.


  • National house prices ended 1Q 2015 at index reading of 83.8, which is down on 84.6 reading at the end of 4Q 2014, but up 16.55% y/y - the highest rate of growth in the series since September 2006. Relative to peak, national house prices were still down 36.5%.At the end of 1Q 2015, house prices nationally were up 25.5% on crisis period trough.
  • National apartments prices index finished 1Q 2015 at 66.4, up on 4Q 2014 reading of 64.2 and 25.5% higher than a year ago. Apartment prices are down 46.4% on their peak and up 45.3% on crisis period trough. Y/y growth rates in apartments prices is now running at the highest level in history of the CSO series (from January 2005).


  • Ex-Dublin, national residential property price index ended 1Q 2015 at 75.3, marking a marginal decline on 4Q 2014 reading of 75.5, but up 10.74% y/y - the highest rate of growth since May 2007. Compared to peak, prices are down 41.5% and they are up 13.9% on crisis period trough.
  • Ex-Dublin house prices finished 1Q 2015 at the index reading of 77.1, which is virtually unchanged on 77.2 reading at the end of 4Q 2014. Year-on-year prices are up 10.78% which is the fastest rate of expansion since May 2007. Compared to peak prices are still 40.6% lower, although they are 14.2% ahead of the crisis period trough.
  • Dublin residential property prices were at 82.5 at the end of 1Q 2015, down on 83.8 index reading at the end of 4Q 2014. Annual rate of growth at the end of 1Q 2015 was 22.77%, the highest since October 2014. Dublin residential property prices are down 38.7% compared to peak and up 44% on crisis period trough. Over the last 24 months, Dublin residential property prices grew cumulatively 40.3%.
  • Dublin house prices index ended 1Q 2015 at a reading of 86.9, which is below 88.8 index reading at the end of 4Q 2014, but up 22.05% y/y, the highest rate of growth in 3 months from December 2014. Dublin house prices are down 36.9% on pre-crisis peak and are up 42.93% on crisis period trough. Over the last 24 months, cumulative growth in Dublin house prices stands at 39.5%.
  • Dublin apartments price index ended 1Q 2015 at a reading of 73.7, up on 70.2 reading attained at the end of 4Q 2014, and up 29.75% y/y - the fastest rate of growth recorded since September 2014. Compared to peak, prices are still down 42.2% and they are up 59.2% on crisis period trough. Over the last 24 month, Dublin apartments prices rose cumulatively by 51.3%.


Longer dated series available below:


And to update the chart on property valuations relative to inflation trend (bubble marker):


As chart above clearly shows, we are getting closer to the point beyond which property prices will no longer be supported by the underlying fundamentals. However, we are not there, yet. Acceleration in inflation and/or deceleration in property prices growth will delay this point significantly. One way or the other, there is still a sizeable gap between where the prices are today and where they should be in the long run that remains to be closed.

Wednesday, March 25, 2015

25/3/15: Irish Residential Property Prices Fell Marginally in February


The residential property price index from CSO covering Irish property markets has posted second monthly contraction in February, falling from 80.3 in January to 80.0 last month. With that, y/y on growth rate in Irish residential property prices has slowed from 15.54% in January to 14.94% in February, the first sub-15% reading since September 2014. In effect, property prices in Ireland have now fallen back to the levels between September and October 2014. Cumulated gains in property prices over the last 24 months are now totalling 24.22% or an annualised gain of 11.46%, outpacing growth in the economy by roughly 5-fold.

Based on Nama valuations formula, residential property prices are now somewhere 18.5% below Nama business model expectations.


Prices of all residential properties excluding Dublin  remained static in February at 74.8, same as in January and up 8.25% y/y, marking a slowdown in the y/y growth from 9.20% recorded in January.


The decline in national prices was driven by Dublin prices, which fell for the second month in a row from 82.2 in January to 81.6 in February. This is the lowest index reading since September 2014 and marks a slowdown in y/y growth rates to 21.43% - the slowest rate of growth since April 2014. Still, cumulated expansion in Dublin residential property prices over the last 24 months is blistering 37.6% (annualised rate of 17.3%).

Within Dublin segment:

  • Houses were the driver to the downside in overall property prices, with houses price index for Dublin standing at 86.0 in February 2015, down from 86.9 in January 2015 and back to the levels of September 2014. Y/y rate of growth in Dublin house prices fell from 21.7% in January to 21.1% in February, although over the last 24 months hose prices in Dublin are still up cumulatively 37.6% (+17.3% annualised). 
  • Apartments prices in Dublin rose in index terms to 72.2 in February from 70.8 in January, erasing the declines that took place during Q3-Q4 2014. Cumulated gains in Dublin apartments prices over the last 24 months stand at 37.5% (+17.3% annualised) and y/y prices are up 24.5% - the fastest growth rate in 3 months.
Few charts to illustrate the above trends:


 Lastly, summary of price changes on pre-crisis peak and y/y:


Despite all the talk about the new bubble in house prices in Ireland, three themes remain true:
  1. Property prices are still far below fundamentals-justified levels. In Dublin, undershooting of long-run (inflation-linked) prices is around 26-27%.
  2. Property price increases are worryingly high, especially in the Dublin segment, warranting some ongoing concern; and
  3. Moderation in property prices and downward correction over the last two months, driven by Dublin (but likely to translate into similar outside Dublin with a lag), predicted on this blog before, is a welcome change. However, I suspect we will see renewed increases in property prices later this year, albeit at rates more sustainable in the longer run.

Wednesday, March 11, 2015

11/3/15: Building & Construction Activity in Ireland: 2014


Irish Building and Construction industry production indices are out for Q4 2014 and full year 2014, so here is a quick look.

Quarterly data:


  • All building and construction activity rose 6% y/y in Q4 2014 by value and 4.5% y/y by volume.Compared to series low, value is up 55% and volume is up 51%. However, compared to historical peak, value is down 70.2% still and volume is down 71.8%. Thus, the annual rise is not impressive: single digit growth off the base that is so low, we are still 36.3% below Q4 2000 in value and 52.8% below Q4 2000 in volume. Worse, Q4 2014 marks the slowest annual growth in value and volume since Q1 2013.


  • Building ex-civil engineering index is up 9.8% y/y in Q4 2014 in value terms and is up 8.6% in volume terms. The series still trend 76% below historical peak in value terms and down 78 in volume terms. Compared to Q4 2000, the series are down 51.3% in value terms and 64% below in volume terms.
  • Residential building production is up massive 36.9% y/y in value terms and 35.2% in volume terms. Again, however, the base of activity is low: the series are still down 76.0% on peak in value terms and down 88.9% in volume terms. Compared to Q4 2000, residential building activity is down 70.6% in value terms and down 79.3% in volume terms.
  • Non-residential building activity fell 3.9% y/y in Q4 2014 in value terms and is down 5.17% in volume terms. The series are 15.3% below Q4 2000 levels of activity in value terms and are down 30.4% in volume terms.
  • Civil engineering activity - the only area of activity where we have been performing relatively better over recent years - posted a decline of 1.6% y/y in Q4 2014 in terms of value of activity and a drop of 2.88% y/y in terms of volume of activity. However, compared to Q4 2000, the series still run 64% ahead in terms of value and 20.6% up in terms of volume.


On annual basis, 2014 was a better year for value of activity compared to volume.

  • Across all building and construction sub-sectors, activity in 2014 was up 9.36% y/y in terms of value of production and up 8.29 in terms of volume. Both value and volume y/y growth rates were weaker in 2014 compared to 2013. Relative to annual averages for 2000-20002 period, activity across all sectors of construction is down 47% in value terms and down 58.7% in volume terms.
  • Residential building activity in 2014 rose 19.0% y/y in value terms (improving on 11.5% growth in 2013) and by 17.5% in volume terms (also improving on 10.8% growth in 2013). However, as with quarterly figures earlier, activity is growing of extremely low base. Compared to 2000-2002 annual averages, 2014 activity in this sub-sector is still down 78.3% in value terms and down 69.0% in volume terms.
  • Non-residential construction activity is up 8.3% y/y in value terms in 2014 (much worse than 19.4% rise recorded in 2013) and in volume terms activity is up 7.2% (also worse than 18.5% rise in 2013). Full year 2014 activity is still well below 2000-2002 annual averages (down 21.4% in value terms and down 31.7% in volume terms).


To conclude: 

  1. Some welcome improvements in the building and construction sector, driven primarily by residential construction activities, but coming off extremely low base of activity in 2013. 
  2. Key issue is how much of 2014 activity uplift was driven by planning permissions secured prior to major regulatory changes that are holding back current permissions activity. 
  3. Another key issue is the apparent significant slowdown in 2014 rates of growth in activity compared to 2013 rates of growth. 
  4. Third issue: despite still low levels of activity in the sector, builders appear to be chasing higher margins on price / value side, instead of lower cost projects.Thus value of activities is rising faster than volume for the second year in a row. If this scenario is sustained into 2015, we are unlikely to see construction sector gains translating into alleviating price appreciation pressures in the rental and house purchasing markets.


Sunday, December 14, 2014

14/12/2014: Irish Building & Construction Q3 2014: Another Quarter of Unconvincing Recovery


Indices for activity (volume and value) in Building & Construction sector in Ireland were published this week covering Q3 2014. Here are the details:

Across all Building & Construction sector:

  • Value index for all Building & Construction sector rose to 108.6 in Q3 2014 - the highest reading since Q4 2009 and the second reading over 100.0 since Q4 2010. Year-on-year, index is up solid 11.38%, slightly slower than Q2 rise of 11.55%. The index, however, is still 70.88% below the peak.
  • Excluding Civil Engineering, Building & Construction activity rose in value 103.4 in Q3 2014, he highest reading since Q4 2013 and up 9.77% y/y. This is the slowest rise in the index in 6 quarters. In Q2 2014, index rose 11.82% and in Q1 it was up 14.91%.
  • In volume terms, all Building & Construction activity index reached 108.1 in Q3 2014, up 9.97% y/y, slightly below 10.37% growth in Q2 2014. Volume of activity in the sector is still 72.40% below the pre-crisis peak.
  • Again, taking out Civil Engineering, the activity in the sector is growing at a slower pace in volume terms - up 8.43% y/y in Q3 2014 and down 80.03% on peak.
Chart to illustrate:


In basic terms, overall activity in the broad sector is running along a nearly flat trendline with some signs of very fragile recovery. And that is off the levels so abysmally low that one would require sustained 20%+ growth rates to achieve any meaningful gains.

Underlying the above trends, we have at least some life showing in the Residential Building segment. In Q3 2014, Residential Building activity index posted a 21.13% y/y rise in terms of value, reversing two consecutive quarters of decline. Still, value of activity in this sub-sector remains 90.5% lower than at the pre-crisis peak. In volume terms, the index rose 19.55% and is down 91% on pre-crisis peak. 

Two chart below show just how pathetic the recovery has been to-date in Residential Building & Construction sub-sector.


In summary, there is barely any life in the Building & Construction sector activity - measured against both volume and value of activity - across all sub-sectors, save Civil Engineering, where the falloff has been relatively shallower (down 26% on peak in Q3 2014 in terms of value and 28.5% in terms of volume). And, of course, the data is again contrary to the booming Construction Sector PMIs. What a surprise!

Interestingly, in non-Residential Building sector, activity is growing at the rates of just 2.33% y/y in terms of volume and 3.75% y/y in terms of value - despite the numerous 'good news' claims from Nama and the commercial real estate sector and despite the allegedly 'low' vacancy rates and rising rent rolls.

Thursday, October 23, 2014

23/10/2014: Irish Residential Property Prices: Q3 2014 data


Latest data for residential properties price index for Ireland is out, covering September. Instead of repeating all the analysis provided elsewhere, here is a look at quarterly data series and longer-term comparatives.

Firstly, on quarterly basis, Q3 2014 ended with index averaging at:

  • 79.1 in Dublin, up strongly on Q2 2014 reading of 72.0. This brings property prices to the levels of Q2 2010 or on pre-crisis comparative basis close to Q4 2002 (80.8).  Year on year prices in Q3 2014 stood 23.9% above Q3 2013 reading, which is a modest increase on Q2 2014 y/y increase of 21.2%.
  • Outside Dublin, index read 71.4 in Q3 2014, marking a rise of 5.8% y/y. In Q2 2014, y/y increase was 2.2%. Outside Dublin prices are currently trending at the levels comparable to Q1 2012 (71.2) and on pre-crisis basis - at the levels between Q2-Q3 2001
  • National prices index is at 76.9, up 14.4% y/y and this compares to a rise y/y of 10.6% in Q2 2014. National prices levels are around Q2-Q3 2011 averages and on pre-crisis basis these are up at the levels of Q2-Q3 2002.
Chart to illustrate:


Rates of growth in prices are worrying, as they were for some time now. Chart below shows y/y increases in price indices for quarterly averages:


The chart above clearly shows that Dublin price increases have been running well above the historical averages for the main periods since Q1 2000. Q3 2014 marks full year since price appreciation in Dublin market has risen above sub-period (2013-present) average and this now becoming a serious issue.

At the same time, long-term level indices suggest that prices remain below historical trends:


So once again, data is showing troubling developments in the rate of price increases in Dublin and below-trend price levels. Based on historical evidence, real price bubble concerns are still outside the scope of index readings by some 25-30 percent. But we are closing that gap very fast.

Thursday, September 25, 2014

25/9/2014: Irish Property Prices: Scary Dynamics in Dublin, Relative Slumber Elsewhere

Latest Residential Property Prices Index for August 2014 continues to point to the same trends and risks as in previous months.

Firstly, historical level of current price levels: Measured in quarterly terms, Q3 2014 data through August 2014 points to Dublin index reading of 77.95 against 72 in Q2 2014 which brings index to the levels last seen in Q3 2010.


As dramatic as the increase from crisis period trough might appear, the series still well below where long-term activity should be, as seen in the chart below:


However, rate of price increases remains of concern in Dublin market. In August 2014, residential property prices across the nation rose 14.93% y/y, the fastest y/y growth rate since October 2006. Nationally, house prices rose 14.61% y/y in August, marking the fastest rate of increase since March 2007. Apartments prices rose 24% y/y in August 2014, marking the fastest rate of increase on record and beating previous historical high attained in July 2014.

All of this activity was down to Dublin price hikes. Excluding Dublin, property prices rose more modest 5.63% y/y in August. House prices rose 5.80% once Dublin is excluded.

Meanwhile, Dublin property prices were up 25.08% y/y in August, marking thirteenth consecutive month of double-digit y/y inflation. Dublin house prices rose 24.7% y/y in August 2014, also marking thirteenth consecutive month of double-digit y/y prices growth. Dublin apartments posted price growth of 32.63% y/y in August, for the fourteenth consecutive month of double-digit expansion.


Compare the above chart for Dublin with the same for ex-Dublin:


Over the last 24 months, cumulated growth in national residential property prices was 16.02%, with house prices rising cumulatively by 15.34% and apartments prices up 32.2%. Outside Dublin, all properties prices were up more modest 2.89% in cumulative terms over the last 24 months and house prices were up 3.11%. In Dublin, residential property prices were up 38.39% over the last 24 months, which is 13.3 times faster than ex-Dublin. Dublin house prices grew 12.2 times faster than ex-Dublin house prices, at a 24 months cumulative rate of 37.83%. Dublin apartments prices rose 46.09% in 24 months through August 2014.

So as before: there are very worrying signs in price increases in Dublin, albeit levels of prices still remain subdued compared to both historical trend and inflation-driven trend. In other words, be scared of the speed of price increases, but not of the levels of prices so far.

Wednesday, August 27, 2014

27/8/2014: Irish Property Markets: Some Foam Under the Cork...


Time to worry is… about now… or rather in a couple of months...

Irish residential properties price index for July was released by CSO. The data is showing continued established trends in prices recovery with further amplification in the worrying trends of double-digit y/y increases in Dublin property prices. While I generally prefer to provide more detailed analysis on a quarterly data, which will be available at the end of October, the current rates of increases in prices are now worrying and deserve at least a brief comment.

Overall, National Residential Prices Index rose to 75.3 in July 2014, which is up 13.4% y/y. July marks third consecutive month of double-digit y/y increases in prices. And the rate of increases is accelerating for the fourth consecutive month. This is worrying. The level of index remains low - 42.3% off its pre-crisis peak and only 17.47% up on crisis trough. But cumulated 24 months gain is now 16.0% (an annualised rate of increases at 7.71%). Thus, as I noted before, the main concern is not the level of prices, yet, but the the rate at which prices are moving up.

Furthermore, the rate of price increases in the Apartments segment of the market is clearly outstripping price increases for houses in all months since June 2013, with exception of February 2014. This too is worrying as this suggests investment motives buying acting strongly to push prices up for rental properties. The result will likely be misallocation of investment and rising rents.


In Dublin, the growth rates are even of greater concern.

Once again, levels are not a problem: Dublin residential properties index currently sits at 76.6 which is 43.5% lower than pre-crisis peak and 33.68% higher than crisis period trough. Dublin fell hardest and fastest of all markets in Ireland during the crisis, so it is bouncing back now faster too. So much is fine. But the rates of increase in prices y/y are now running at double digits for 12 consecutive months in a row, with last three months the rates of prices increases in Dublin at above 21 percent. sooner or later it will be time to call this a 'feeding frenzy' and if the credit supply to the sector were to improve, all stops will be pulled out of the buyers. Psychology here is not pretty.


So is it 'finally' time to call this a bubble? Not yet. I will make my next call on this on foot of September data (due in October), but in general, the levels of prices are still benign compared to pre-crisis peaks, pre-bubble trends and the 'natural rate' of price increases that can be expected to prevail from the 1990s on. But I am beginning to worry that a combination of:

  1. Tight supply of suitable properties
  2. Rising rents and lack of retail investor professionalism in structuring functional investment portoflios
  3. Psychology of the buyers, reinforced by the media and real estate agents commentary, 
  4. Expectations of further tax easing in the Budget 2015, especially targeted to property markets, and
  5. Continued accumulation of cash in certain sub-sectors of economy

are all adding up to a rising pressure on the investors and buyers to go into the market to secure 'any' deal at 'any' valuation as long as it is remotely affordable.

This is not a 'champagne cork' moment, yet, but we have lots of foam in this market, with little to slow down the cork for the moment...

Thursday, July 24, 2014

24/7/2014: Residential Property Prices: June 2014 Detailed Breakdown


In the previous post I covered Residential Property Prices Index data from the point of view of the 'bubble' dynamics. Monthly data is covered in the CSO report here. So to avoid doing what every one else in media is doing (regurgitating the press release), here is the analysis of data based on quarterly aggregates and longer-term changes. This strips-out some of the monthly-level volatility and is probably better suited to comparatives across time.

Starting with the RPPI nationwide:

  • Q2 2014 average is at 76.9 which is well ahead of 69.4 average for Q1 2014 - a rise of +3.55%. 
  • Cumulated 24 months growth is now at 13.9% or 6.72% annualised. This is robust, but very much in line with what can be expected in a recovery phase, given the rates of market collapse during the crisis.
  • Compared to Nama valuations, we are still down 24.8%
  • Compared to pre-crisis peak we are down 43.5% and compared to crisis trough we are up 15.1%.
Here are the annual growth rates in the series:


  • National Houses series are driving the overall National Index. Houses series are up 3.55% - same as National - in Q2 2014 compared to Q1 2014. 24 months cumulated gain is 13.6%, slightly below National gains. Compared to crisis peak, National Houses index is 41.8% lower, while compared to crisis trough it is 15% up.
  • Apartments up 3.62% q/q in Q2 2014 and cumulated gains are 19.8% over the last 24 months. Relative to peak these are down 54% and relative to crisis period trough they are up 24.7%. There is a lot more volatility in Apartments Index than in the Houses Index.

Ex-Dublin:

  • Ex-Dublin Properties Index is up only 0.1% q/q in Q2 2014. There is basically no growth in the series. Over the last 24 months, series rose just 2.35% cumulatively. Compared to peak, ex-Dublin national prices are 45.8 down and compared to crisis-period trough they are up only 5.6%. This is very anaemic. 


Dublin:

  • Dublin All-Properties Index is up 7% in Q2 2014 compared to Q1 2014. This is fast. Cumulated gains over last 24 months are 29.1% (annualised rate of 13.6%) which is also very fast. Compared to peak, prices in Dublin are down 44.5%, which is worse than National (-43.5%) and relative to crisis period trough prices are up 30.2% (which is better than National at 15.1%).
  • Nama valuations are off 17.2% in Dublin, which is much better than outside Dublin.
  • Dublin Houses Index is up 7.2% q/q in Q2 2014 - very fast rise. Cumulated gains over 24 months are 28.9% (annualised rate of 13.5% - also very fast increases). Compared to peak, Dublin Houses prices are off 42.7% and compared to trough they are up 30%.
  • The above dynamics are starting to concern me - we are witnessing very fast increases from very low levels, so while we are not yet in over-pricing territory, we are converging toward long-term equilibrium prices at a break-neck speed. The next 3 months data will be probably non-representative due to two late-Summer months, but September-December data will be crucial. 
  • If we witness gradual de-acceleration in growth rates, things are out of excessive exuberance zone - for that we need rates of growth y/y to decline to 7.5-14% range.
  • If we witness stabilisation in rates of growth in excess of 14% we are likely to see serious risk of over-pricing emerging in the medium term.
  • So watch this space... especially the last chart below...


24/7/2014: Looking for that Property Price Bubble: Dublin, June 2014


Irish Residential Property Price Index for June is out today. Headlines are burning hot with

  • 12.5 hike in prices nationwide (y/y);
  • June m/m rise of 2.9% - faster than 2.3% in May
  • Dublin property prices up 3.3% m/m and 23.9% y/y
  • Dublin House prices up 3.1% m/m and 24.4% y/y
There is no avoiding the talk about a 'new bubble'.

In the past, I clearly said that in my view:
  1. Current levels of prices are not signalling bubble emergence in Dublin
  2. Rates of increases in Dublin prices are concerning, but levels are yet to break away from the national historical averages
  3. Trend-wise, we are way below the levels of Dublin prices consistent with normal long-term behaviour in the series.
Here are updated charts on long-term trends.

First, looking at annual series and applying two trend assumptions: actual inflation and ECB target (long-run inflation). By both metrics, we are still below (using 3mo MA through June 2014 as 2014 figure) equilibrium, but rate of convergence is accelerating:


On monthly basis, here are historical series, linking ESRI and CSO data sets:


As above clearly shows, Q2 2014 levels of prices in Dublin are barely above 2000-2002 average.

So the dynamics can signal a bit of an exuberance on the market demand side, but levels are still very much conservative compared to longer-term trends.

Thursday, June 26, 2014

26/6/2014: You Might Need a Hubble to Spot That Bubble


In my analysis yesterday (here) I argued that Dublin residential property prices are simply showing signs of reversion to trend, not 'bubble' dynamics. Since then, numerous reports in the media produced opposite conclusions, with headlines forcibly putting forward an argument for 'bubble' formation in Dublin property markets.

Over long run, sustainable property prices appreciation should track closely inflation in the economy. So far is pretty much clear. While arbitrary, starting points for trend estimation for Dublin property should start from pre-bubble period of 1999-2001. This is also pretty clear.

So let us apply Consumer Price Index-measured inflation to Dublin residential property price indices and see where the trend is against current reading. The following chart, based on annual series 2000-2013 and May 2014 for current reading illustrates this exercise:


Here's a pesky problem for 'bubble'-maniacs out there:

  1. If property prices expanded at the rate of inflation from 2000 on, current Dublin property prices index should read around 91.2.
  2. If property prices expanded at the ECB policy-consistent inflation target of 2%, the index should read around 89.4
  3. Current CSO index reading is 72.2
So we are somewhere 25-26% below 'sustainable' levels of house prices, if these are measured by inflation-linked price appreciation, or 24% below ECB-targeted rate of inflation.

You do need quite a powerful telescope to spot the bubble in Dublin markets from here. Which, of course, should not be read as 'there is no bubble', just as 'we can't yet tell anything about bubble being formed'.


Wednesday, June 25, 2014

25/6/2014: Irish Residential Property Prices: May 2014


CSO published Residential Property Price Index today for May 2014. Lots of various headlines reporting double digit gains in property prices and lauding general recovery in the market, as usual.

Let make some sense of the data as we have it:

Point 1: National house prices: Index was at 70.1 in April 2014 and this rose to 71.7 in May 2014. April reading was just a notch above 70.0 in December 2013. In other words, for all annual gains, we were just about back to the level prices were in December last year. In May, this rose above December 2013 levels, and closer to September-October 2011 average.

I would not call this a 'recovery', yet, especially since we have drawn another 'u' around December 2013-April 2014.

That said, relative to peak prices are down 45.1% and are up 11.9% on crisis period low. Cumulated gain over last 24 months is only 9.47% which equates to annual average growth in the 'recovery' period of just 4.63%. Again, given the depth of decline from the peak, this is not a 'bubble'-type recovery.

3mo moving average was down through April 2014 at -0.23% compared to 3mo period through January 2014, but in May this moved into positive territory of +0.86% compared to 3mo average through February 2014.

Current national prices are 26.9% below Nama valuations (inclusive of LTEV and risk cushion) so for Nama to return profit on average acquired loan it will need ca 27.4% rise from here on. At current running 24 months growth rate, that will require roughly 6 years.


Point 2: National property prices ex-Dublin: the index reading is at 68.2 barely up on 68 in March 2014. Compared to crisis trough, the index is now only 3.2% up. Cumulated rate of growth over 24 moths through April 2014 is negative at -1.02%. 3mo MA through May 2014 is 1.02% below 3mo MA through February 2014. In other words, nationally (excluding Dublin) things are not getting better.


Point 3: Dublin properties, despite all the talk about 'new bubble' and 'boom' are only now in line with those nationally (chart above shows this much). In other words, Dublin 'boom' is a correction for much steeper decline in Dublin properties relative to the rest of the country.


Point 4: Dublin all properties index is now at 72.2 in May, which is up on 69.3 in April 2014, and is the highest reading since February 2011.

Relative to peak, Dublin properties are still down 46.3% although they are now 26% above the crisis trough. Cumulated gain in Dublin over 24 months through May 2014 is 23.6% which equates to roughly 11.2% annual rise - robust and clearly signalling recovery, in contrast to ex-Dublin markets.

But, 3mo MA through April 2014 was % below 3mo MA through January 2014, while 3mo AM through May 2014 is 2.66% up on 3mo MA through February 2014, which shows some volatility in the index and can be a sign of the rally regaining some momentum or seasonal effects combining with some improved economic news or simply volatility taking hold of the recent data. Simple answer - we have no idea what is going on.

Crucially, as chart above shows, apartments segment of Dublin market is showing weaker growth over the last 6 months than houses segment. This is surprising, given rapid rises in rents and reported shortages of accommodation.

So here you have it: for all the hoopla about 'mini-bubble' etc, things are still very much shaky:
  • Growth in Dublin is strong, but so far consistent with the market catch up with more conservative price declines to trough in the rest of the country. 
  • Meanwhile, outside Dublin, things are solidly dead.


Saturday, April 26, 2014

26/4/2014: How real was the property markets recovery in 2013?


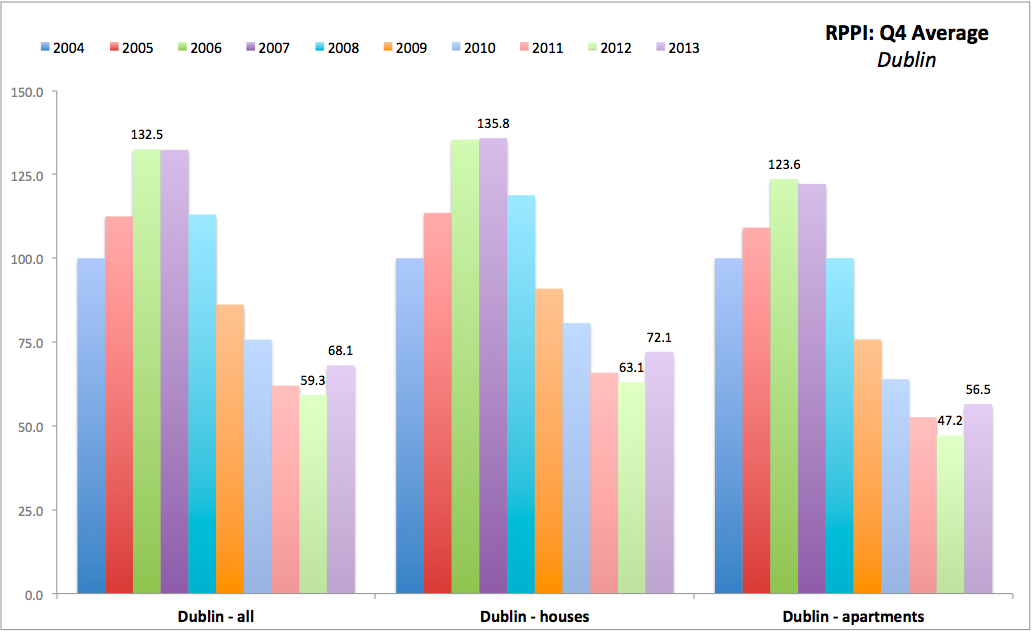
I am updating the annual series for Residential Property Prices in Ireland and here are some of the summary charts showing Q4 averages (end-of-year smoothed prices, that remove some of the volatility):


Key takeaways:

  • Reports of major recovery in the property markets over 2013 are a bit overdone. Here are the reasons why.
  • The recovery in Dublin in 2013 took the prices above the levels of 2011 and closer to 2010. Dublin all properties index finished 2013 at Q4 average of 68.1 which is well above 59.3 trough recorded in Q4 2012 and ahead of 62.0 recorded in Q4 2011. We are still less than 1/2 way to 2010, but overall jumping tow years back is a rather strong recovery.
  • Dublin recovery was also broadly supported in both houses segment and apartments segment.
  • However, outside Dublin - aka in the rest of the country - there is no recovery. National ex-Dublin all properties prices have fallen again in 2013 as they did in all other years starting with 2008 on. 
  • As the result of the prices dynamics in the rest of the country, 2013 'recovery' nationwide was able to lift prices off their crisis period troughs, but not enough to reach above the 2011-2012 declines. Thus overall index of nationwide properties is at 69.7 in Q4 2013 against 70.1 in Q4 2011. 
Are prices rising? They seem to be. Are prices rising above inflation? Yes. And this is one sign of a robust recovery. But are prices rising to make meaningful recovery toward pre-crisis levels (something that is required in order to rebuild household finances)? No. See more on this here: http://trueeconomics.blogspot.ie/2014/04/2642014-its-long-long-long-road-to.html

Thursday, November 28, 2013

28/11/2013: Irish Residential Property Prices: October 2013


Irish Residential Property Prices index (RPPI) for October was published yesterday showing continued and rapid convergence in Dublin prices toward national levels.

Overall National all-properties RPPI rose 6.12% y/y in October 2013, having posted 5th consecutive month of annual rises. Compared to peak, National RPPI stands down 46.82% and is up 8.27% on crisis trough. 3mo MA of RPPI is 3.96% higher than for previous 3mo period. Cumulated 24 months change is now -2.53%.

National Houses RPPI also rose strongly, posting a gain of 5.86% y/y and marking the 5th consecutive annual rise. The index is 45.23% below its peak and 8.23% above the crisis period trough. Cumulated change over the last 24 months is -2.69% and 3mo average through October is up 3.95% on previous.

National Apartments RPPI is up a massive 11.68% y/y and is 15.1% above the crisis period trough, although the index is still 57.55% below the peak. Cumulated 24 months gain is +0.77% and 3mo average through October is now 4.49% ahead of 3mo average through July.


National ex-Dublin RPPI declined 0.29% y/y. last time the index posted positive gain was in February 2008. The rate of decline is moderating significantly, however, as shown in the chart below. The index is now 46.89% below its peak and 3.48% above the crisis trough. Cumulated change over the last 24 months is -9.16%, but 3mo average through October 2013 is 0.69% above 3mo average through July 2013.

Dublin RPPI (all properties) rose massive 15.02% y/y in October, marking 10th consecutive annual rise and third consecutive rise in double-digits. The Index is now 49.89 below its peak and 17.63% up on crisis period trough. Cumulated 24 months change in the index is +6.81% and 3mo average through October is 8.31% ahead of 3mo average through July.


Decomposition of Dublin RPPI:

Dublin Houses RPPI rose 14.61% y/y in October. This was the third month of double digits annual gains and the 10th consecutive month of positive annual rates of growth. The index is down 48.19% on peak and is up 17.43% on crisis trough. Cumulated 24 months gains are 5.62% and 3mo average through October is 8.7% higher than for the 3mo period through July.

Dublin Apartments RPPI posted the fourth consecutive double digits annual rise with a gain of 18.01% y/y. This is the 5th consecutive month of positive annual growth rates. The data is exceptionally volatile and, as CSO points out, is based on thin volumes.Overall, apartments prices are down 56.28% on the peak and are up 20.3% on the crisis trough. Cumulated 24 months gains are at 9.65%.


Top-line conclusions:

  • Dublin prices are converging back toward longer term equilibrium levels. These, in my opinion, should be around -20-25% of the peak, to return us to inflation-consistent growth path.
  • The rate of convergence is very strong and disturbing. This is probably due to one-off factors that are likely to run their course over time.
  • It is likely that the prices will overshoot the new equilibrium trend on the way up and will then moderate back toward trend.
  • The rest of the country is in the flat-line pattern and can see a psychological boost from Dublin. This boost is unlikely to be sustained in the short run.
  • Uncertainly is significant in the market in the short run (through 2014-early 2015) due to the backlog of unresolved mortgages arrears and Nama holdings.
  • Long-run equilibrium for the national prices is also around -25-30% on pre-crisis peak.


Table below summarises the levels of equilibrium indices and the shortfall on equilibrium: