Showing posts with label residential property prices. Show all posts

Friday, May 8, 2015

8/5/15: Irish Residential Property Prices: Q1 2015


Updating residential property price indices for Ireland for 1Q 2015:

  • National property prices index ended 1Q 2015 at 80.7, up 16.79% y/y - the highest rate of growth in series history (since January 2005), but down on 4Q 2014 reading of 81.4. Latest reading we have puts prices at the level of October 2014. Compared to peak, prices were down 38.2% at the end of 1Q 2015. National property prices were up 25.9% on crisis trough in 1Q 2015.


  • National house prices ended 1Q 2015 at index reading of 83.8, which is down on 84.6 reading at the end of 4Q 2014, but up 16.55% y/y - the highest rate of growth in the series since September 2006. Relative to peak, national house prices were still down 36.5%.At the end of 1Q 2015, house prices nationally were up 25.5% on crisis period trough.
  • National apartments prices index finished 1Q 2015 at 66.4, up on 4Q 2014 reading of 64.2 and 25.5% higher than a year ago. Apartment prices are down 46.4% on their peak and up 45.3% on crisis period trough. Y/y growth rates in apartments prices is now running at the highest level in history of the CSO series (from January 2005).


  • Ex-Dublin, national residential property price index ended 1Q 2015 at 75.3, marking a marginal decline on 4Q 2014 reading of 75.5, but up 10.74% y/y - the highest rate of growth since May 2007. Compared to peak, prices are down 41.5% and they are up 13.9% on crisis period trough.
  • Ex-Dublin house prices finished 1Q 2015 at the index reading of 77.1, which is virtually unchanged on 77.2 reading at the end of 4Q 2014. Year-on-year prices are up 10.78% which is the fastest rate of expansion since May 2007. Compared to peak prices are still 40.6% lower, although they are 14.2% ahead of the crisis period trough.
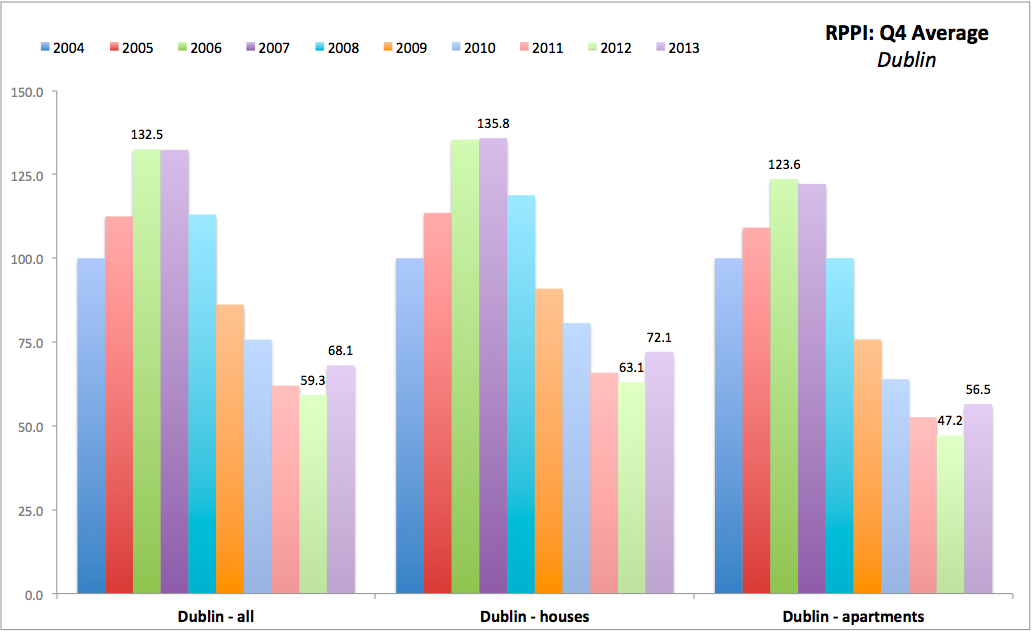
  • Dublin residential property prices were at 82.5 at the end of 1Q 2015, down on 83.8 index reading at the end of 4Q 2014. Annual rate of growth at the end of 1Q 2015 was 22.77%, the highest since October 2014. Dublin residential property prices are down 38.7% compared to peak and up 44% on crisis period trough. Over the last 24 months, Dublin residential property prices grew cumulatively 40.3%.
  • Dublin house prices index ended 1Q 2015 at a reading of 86.9, which is below 88.8 index reading at the end of 4Q 2014, but up 22.05% y/y, the highest rate of growth in 3 months from December 2014. Dublin house prices are down 36.9% on pre-crisis peak and are up 42.93% on crisis period trough. Over the last 24 months, cumulative growth in Dublin house prices stands at 39.5%.
  • Dublin apartments price index ended 1Q 2015 at a reading of 73.7, up on 70.2 reading attained at the end of 4Q 2014, and up 29.75% y/y - the fastest rate of growth recorded since September 2014. Compared to peak, prices are still down 42.2% and they are up 59.2% on crisis period trough. Over the last 24 month, Dublin apartments prices rose cumulatively by 51.3%.


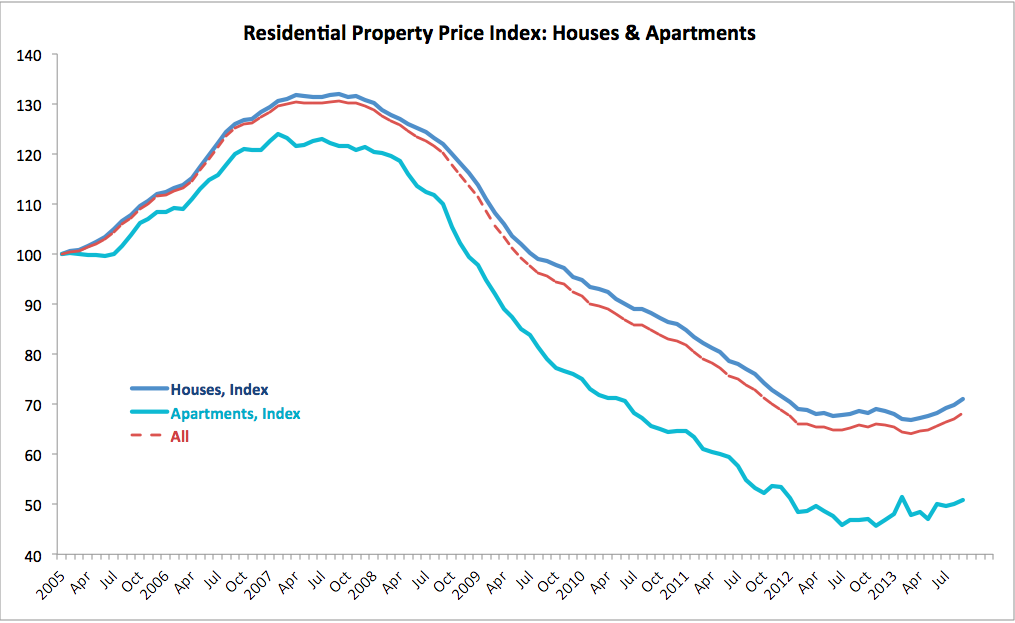
Longer dated series available below:


And to update the chart on property valuations relative to inflation trend (bubble marker):


As chart above clearly shows, we are getting closer to the point beyond which property prices will no longer be supported by the underlying fundamentals. However, we are not there, yet. Acceleration in inflation and/or deceleration in property prices growth will delay this point significantly. One way or the other, there is still a sizeable gap between where the prices are today and where they should be in the long run that remains to be closed.

Wednesday, August 27, 2014

27/8/2014: Irish Property Markets: Some Foam Under the Cork...


Time to worry is… about now… or rather in a couple of months...

Irish residential properties price index for July was released by CSO. The data is showing continued established trends in prices recovery with further amplification in the worrying trends of double-digit y/y increases in Dublin property prices. While I generally prefer to provide more detailed analysis on a quarterly data, which will be available at the end of October, the current rates of increases in prices are now worrying and deserve at least a brief comment.

Overall, National Residential Prices Index rose to 75.3 in July 2014, which is up 13.4% y/y. July marks third consecutive month of double-digit y/y increases in prices. And the rate of increases is accelerating for the fourth consecutive month. This is worrying. The level of index remains low - 42.3% off its pre-crisis peak and only 17.47% up on crisis trough. But cumulated 24 months gain is now 16.0% (an annualised rate of increases at 7.71%). Thus, as I noted before, the main concern is not the level of prices, yet, but the the rate at which prices are moving up.

Furthermore, the rate of price increases in the Apartments segment of the market is clearly outstripping price increases for houses in all months since June 2013, with exception of February 2014. This too is worrying as this suggests investment motives buying acting strongly to push prices up for rental properties. The result will likely be misallocation of investment and rising rents.


In Dublin, the growth rates are even of greater concern.

Once again, levels are not a problem: Dublin residential properties index currently sits at 76.6 which is 43.5% lower than pre-crisis peak and 33.68% higher than crisis period trough. Dublin fell hardest and fastest of all markets in Ireland during the crisis, so it is bouncing back now faster too. So much is fine. But the rates of increase in prices y/y are now running at double digits for 12 consecutive months in a row, with last three months the rates of prices increases in Dublin at above 21 percent. sooner or later it will be time to call this a 'feeding frenzy' and if the credit supply to the sector were to improve, all stops will be pulled out of the buyers. Psychology here is not pretty.


So is it 'finally' time to call this a bubble? Not yet. I will make my next call on this on foot of September data (due in October), but in general, the levels of prices are still benign compared to pre-crisis peaks, pre-bubble trends and the 'natural rate' of price increases that can be expected to prevail from the 1990s on. But I am beginning to worry that a combination of:

  1. Tight supply of suitable properties
  2. Rising rents and lack of retail investor professionalism in structuring functional investment portoflios
  3. Psychology of the buyers, reinforced by the media and real estate agents commentary, 
  4. Expectations of further tax easing in the Budget 2015, especially targeted to property markets, and
  5. Continued accumulation of cash in certain sub-sectors of economy

are all adding up to a rising pressure on the investors and buyers to go into the market to secure 'any' deal at 'any' valuation as long as it is remotely affordable.

This is not a 'champagne cork' moment, yet, but we have lots of foam in this market, with little to slow down the cork for the moment...

Thursday, July 24, 2014

24/7/2014: Residential Property Prices: June 2014 Detailed Breakdown


In the previous post I covered Residential Property Prices Index data from the point of view of the 'bubble' dynamics. Monthly data is covered in the CSO report here. So to avoid doing what every one else in media is doing (regurgitating the press release), here is the analysis of data based on quarterly aggregates and longer-term changes. This strips-out some of the monthly-level volatility and is probably better suited to comparatives across time.

Starting with the RPPI nationwide:

  • Q2 2014 average is at 76.9 which is well ahead of 69.4 average for Q1 2014 - a rise of +3.55%. 
  • Cumulated 24 months growth is now at 13.9% or 6.72% annualised. This is robust, but very much in line with what can be expected in a recovery phase, given the rates of market collapse during the crisis.
  • Compared to Nama valuations, we are still down 24.8%
  • Compared to pre-crisis peak we are down 43.5% and compared to crisis trough we are up 15.1%.
Here are the annual growth rates in the series:


  • National Houses series are driving the overall National Index. Houses series are up 3.55% - same as National - in Q2 2014 compared to Q1 2014. 24 months cumulated gain is 13.6%, slightly below National gains. Compared to crisis peak, National Houses index is 41.8% lower, while compared to crisis trough it is 15% up.
  • Apartments up 3.62% q/q in Q2 2014 and cumulated gains are 19.8% over the last 24 months. Relative to peak these are down 54% and relative to crisis period trough they are up 24.7%. There is a lot more volatility in Apartments Index than in the Houses Index.

Ex-Dublin:

  • Ex-Dublin Properties Index is up only 0.1% q/q in Q2 2014. There is basically no growth in the series. Over the last 24 months, series rose just 2.35% cumulatively. Compared to peak, ex-Dublin national prices are 45.8 down and compared to crisis-period trough they are up only 5.6%. This is very anaemic. 


Dublin:

  • Dublin All-Properties Index is up 7% in Q2 2014 compared to Q1 2014. This is fast. Cumulated gains over last 24 months are 29.1% (annualised rate of 13.6%) which is also very fast. Compared to peak, prices in Dublin are down 44.5%, which is worse than National (-43.5%) and relative to crisis period trough prices are up 30.2% (which is better than National at 15.1%).
  • Nama valuations are off 17.2% in Dublin, which is much better than outside Dublin.
  • Dublin Houses Index is up 7.2% q/q in Q2 2014 - very fast rise. Cumulated gains over 24 months are 28.9% (annualised rate of 13.5% - also very fast increases). Compared to peak, Dublin Houses prices are off 42.7% and compared to trough they are up 30%.
  • The above dynamics are starting to concern me - we are witnessing very fast increases from very low levels, so while we are not yet in over-pricing territory, we are converging toward long-term equilibrium prices at a break-neck speed. The next 3 months data will be probably non-representative due to two late-Summer months, but September-December data will be crucial. 
  • If we witness gradual de-acceleration in growth rates, things are out of excessive exuberance zone - for that we need rates of growth y/y to decline to 7.5-14% range.
  • If we witness stabilisation in rates of growth in excess of 14% we are likely to see serious risk of over-pricing emerging in the medium term.
  • So watch this space... especially the last chart below...


24/7/2014: Looking for that Property Price Bubble: Dublin, June 2014


Irish Residential Property Price Index for June is out today. Headlines are burning hot with

  • 12.5 hike in prices nationwide (y/y);
  • June m/m rise of 2.9% - faster than 2.3% in May
  • Dublin property prices up 3.3% m/m and 23.9% y/y
  • Dublin House prices up 3.1% m/m and 24.4% y/y
There is no avoiding the talk about a 'new bubble'.

In the past, I clearly said that in my view:
  1. Current levels of prices are not signalling bubble emergence in Dublin
  2. Rates of increases in Dublin prices are concerning, but levels are yet to break away from the national historical averages
  3. Trend-wise, we are way below the levels of Dublin prices consistent with normal long-term behaviour in the series.
Here are updated charts on long-term trends.

First, looking at annual series and applying two trend assumptions: actual inflation and ECB target (long-run inflation). By both metrics, we are still below (using 3mo MA through June 2014 as 2014 figure) equilibrium, but rate of convergence is accelerating:


On monthly basis, here are historical series, linking ESRI and CSO data sets:


As above clearly shows, Q2 2014 levels of prices in Dublin are barely above 2000-2002 average.

So the dynamics can signal a bit of an exuberance on the market demand side, but levels are still very much conservative compared to longer-term trends.

Wednesday, June 25, 2014

25/6/2014: Irish Residential Property Prices: May 2014


CSO published Residential Property Price Index today for May 2014. Lots of various headlines reporting double digit gains in property prices and lauding general recovery in the market, as usual.

Let make some sense of the data as we have it:

Point 1: National house prices: Index was at 70.1 in April 2014 and this rose to 71.7 in May 2014. April reading was just a notch above 70.0 in December 2013. In other words, for all annual gains, we were just about back to the level prices were in December last year. In May, this rose above December 2013 levels, and closer to September-October 2011 average.

I would not call this a 'recovery', yet, especially since we have drawn another 'u' around December 2013-April 2014.

That said, relative to peak prices are down 45.1% and are up 11.9% on crisis period low. Cumulated gain over last 24 months is only 9.47% which equates to annual average growth in the 'recovery' period of just 4.63%. Again, given the depth of decline from the peak, this is not a 'bubble'-type recovery.

3mo moving average was down through April 2014 at -0.23% compared to 3mo period through January 2014, but in May this moved into positive territory of +0.86% compared to 3mo average through February 2014.

Current national prices are 26.9% below Nama valuations (inclusive of LTEV and risk cushion) so for Nama to return profit on average acquired loan it will need ca 27.4% rise from here on. At current running 24 months growth rate, that will require roughly 6 years.


Point 2: National property prices ex-Dublin: the index reading is at 68.2 barely up on 68 in March 2014. Compared to crisis trough, the index is now only 3.2% up. Cumulated rate of growth over 24 moths through April 2014 is negative at -1.02%. 3mo MA through May 2014 is 1.02% below 3mo MA through February 2014. In other words, nationally (excluding Dublin) things are not getting better.


Point 3: Dublin properties, despite all the talk about 'new bubble' and 'boom' are only now in line with those nationally (chart above shows this much). In other words, Dublin 'boom' is a correction for much steeper decline in Dublin properties relative to the rest of the country.


Point 4: Dublin all properties index is now at 72.2 in May, which is up on 69.3 in April 2014, and is the highest reading since February 2011.

Relative to peak, Dublin properties are still down 46.3% although they are now 26% above the crisis trough. Cumulated gain in Dublin over 24 months through May 2014 is 23.6% which equates to roughly 11.2% annual rise - robust and clearly signalling recovery, in contrast to ex-Dublin markets.

But, 3mo MA through April 2014 was % below 3mo MA through January 2014, while 3mo AM through May 2014 is 2.66% up on 3mo MA through February 2014, which shows some volatility in the index and can be a sign of the rally regaining some momentum or seasonal effects combining with some improved economic news or simply volatility taking hold of the recent data. Simple answer - we have no idea what is going on.

Crucially, as chart above shows, apartments segment of Dublin market is showing weaker growth over the last 6 months than houses segment. This is surprising, given rapid rises in rents and reported shortages of accommodation.

So here you have it: for all the hoopla about 'mini-bubble' etc, things are still very much shaky:
  • Growth in Dublin is strong, but so far consistent with the market catch up with more conservative price declines to trough in the rest of the country. 
  • Meanwhile, outside Dublin, things are solidly dead.


Saturday, April 26, 2014

26/4/2014: How real was the property markets recovery in 2013?


I am updating the annual series for Residential Property Prices in Ireland and here are some of the summary charts showing Q4 averages (end-of-year smoothed prices, that remove some of the volatility):


Key takeaways:

  • Reports of major recovery in the property markets over 2013 are a bit overdone. Here are the reasons why.
  • The recovery in Dublin in 2013 took the prices above the levels of 2011 and closer to 2010. Dublin all properties index finished 2013 at Q4 average of 68.1 which is well above 59.3 trough recorded in Q4 2012 and ahead of 62.0 recorded in Q4 2011. We are still less than 1/2 way to 2010, but overall jumping tow years back is a rather strong recovery.
  • Dublin recovery was also broadly supported in both houses segment and apartments segment.
  • However, outside Dublin - aka in the rest of the country - there is no recovery. National ex-Dublin all properties prices have fallen again in 2013 as they did in all other years starting with 2008 on. 
  • As the result of the prices dynamics in the rest of the country, 2013 'recovery' nationwide was able to lift prices off their crisis period troughs, but not enough to reach above the 2011-2012 declines. Thus overall index of nationwide properties is at 69.7 in Q4 2013 against 70.1 in Q4 2011. 
Are prices rising? They seem to be. Are prices rising above inflation? Yes. And this is one sign of a robust recovery. But are prices rising to make meaningful recovery toward pre-crisis levels (something that is required in order to rebuild household finances)? No. See more on this here: http://trueeconomics.blogspot.ie/2014/04/2642014-its-long-long-long-road-to.html

26/4/2014: It's a long... long... long... road to house prices recovery...


It is a virtually impossible task forecasting long-term price movements in property markets for small economies, like Ireland. The reason is that there are simply too many moving parts all with huge volatility built into the numbers. Take for example normally stable time series such as population. In the case of Ireland, wild swings in terms of net migration over the recent years saw 2006-2008 annual average net immigration of 80,300 per annum switching into a net annual emigration of 31,633 per annum in 2010-2012. While total change in 2007-2013 population in Ireland was 108,000, net migration swing was 111,930. You get the point: what we think the potential demand might be is not an exact science and in the case of Ireland it is not really much of any science whatsoever.

So setting aside actual economic models, what can we say about future property prices trends?

We can do a couple of simple dynamic exercises. Suppose that we are getting back to pre-crisis ‘normal’. This can mean pre-2001 rates of growth in prices or it can mean Celtic Garfield rates of growth. Many would say ‘The Bubble days are over’. So they may be. But suppose they are not. Suppose the rates of growth that prevailed over 2004-2007 are to return. The logical question is: if the boom were to come back, how long will it take property prices to recover? This is obviously a wildly optimistic scenario. But let’s entertain it, shall we?

Below I provide a table of estimated years by which current (end of 2013) prices indices for Irish residential property are likely to recover their real (inflation-adjusted) peak values consistent with pre-crisis years. In other words, the table shows years by which we can expect the crisis effects to be finally erased.

Take 3 scenarios:

Scenario 1: assume that from now on, average annual growth rates for property prices run at their 2004-2007 averages and that inflation averages 1.5 percent per annum (CPI). Adjust the pre-crisis peak for inflation that accumulated between 2007 and present.

Scenario 2: assumes the same as Scenario 1, but adjusts inflation expectation forward to 2 percent instead of 1.5 percent.

Scenario 3: assumes the same as Scenario 1, except we also take into assume average rates the average for 2004-2007 and 2012-2013 to reflect the popular argument that 2012-2013 years growth rates reflect ‘recovery’ in the markets, aka a departure from the crisis.

The last line in the table shows the average duration of the period of recovery – averaged across 3 scenarios. This means that the average is ‘geared’ or ‘leans’ more heavily toward Scenarios 1 and 2 which are by far much more optimistic than Scenario 3.

Do note that all three scenarios are wildly out of line with what we should expect in the long run from the property prices – appreciation at inflation + 0.2-0.5 percentage points margin.


Click on the table to enlarge

Key takeaway:

You might think we are in a recovery, but be warned – even under very unrealistically optimistic price growth projections – the effects of this crisis are likely to prevail well beyond 2025 in Dublin and beyond 2030 nationwide. Now, enjoy the property supplements and financial ‘analysts’ op-eds telling you that everything is going on swimmingly in the markets…

Thursday, November 28, 2013

28/11/2013: Irish Residential Property Prices: October 2013


Irish Residential Property Prices index (RPPI) for October was published yesterday showing continued and rapid convergence in Dublin prices toward national levels.

Overall National all-properties RPPI rose 6.12% y/y in October 2013, having posted 5th consecutive month of annual rises. Compared to peak, National RPPI stands down 46.82% and is up 8.27% on crisis trough. 3mo MA of RPPI is 3.96% higher than for previous 3mo period. Cumulated 24 months change is now -2.53%.

National Houses RPPI also rose strongly, posting a gain of 5.86% y/y and marking the 5th consecutive annual rise. The index is 45.23% below its peak and 8.23% above the crisis period trough. Cumulated change over the last 24 months is -2.69% and 3mo average through October is up 3.95% on previous.

National Apartments RPPI is up a massive 11.68% y/y and is 15.1% above the crisis period trough, although the index is still 57.55% below the peak. Cumulated 24 months gain is +0.77% and 3mo average through October is now 4.49% ahead of 3mo average through July.


National ex-Dublin RPPI declined 0.29% y/y. last time the index posted positive gain was in February 2008. The rate of decline is moderating significantly, however, as shown in the chart below. The index is now 46.89% below its peak and 3.48% above the crisis trough. Cumulated change over the last 24 months is -9.16%, but 3mo average through October 2013 is 0.69% above 3mo average through July 2013.

Dublin RPPI (all properties) rose massive 15.02% y/y in October, marking 10th consecutive annual rise and third consecutive rise in double-digits. The Index is now 49.89 below its peak and 17.63% up on crisis period trough. Cumulated 24 months change in the index is +6.81% and 3mo average through October is 8.31% ahead of 3mo average through July.


Decomposition of Dublin RPPI:

Dublin Houses RPPI rose 14.61% y/y in October. This was the third month of double digits annual gains and the 10th consecutive month of positive annual rates of growth. The index is down 48.19% on peak and is up 17.43% on crisis trough. Cumulated 24 months gains are 5.62% and 3mo average through October is 8.7% higher than for the 3mo period through July.

Dublin Apartments RPPI posted the fourth consecutive double digits annual rise with a gain of 18.01% y/y. This is the 5th consecutive month of positive annual growth rates. The data is exceptionally volatile and, as CSO points out, is based on thin volumes.Overall, apartments prices are down 56.28% on the peak and are up 20.3% on the crisis trough. Cumulated 24 months gains are at 9.65%.


Top-line conclusions:

  • Dublin prices are converging back toward longer term equilibrium levels. These, in my opinion, should be around -20-25% of the peak, to return us to inflation-consistent growth path.
  • The rate of convergence is very strong and disturbing. This is probably due to one-off factors that are likely to run their course over time.
  • It is likely that the prices will overshoot the new equilibrium trend on the way up and will then moderate back toward trend.
  • The rest of the country is in the flat-line pattern and can see a psychological boost from Dublin. This boost is unlikely to be sustained in the short run.
  • Uncertainly is significant in the market in the short run (through 2014-early 2015) due to the backlog of unresolved mortgages arrears and Nama holdings.
  • Long-run equilibrium for the national prices is also around -25-30% on pre-crisis peak.


Table below summarises the levels of equilibrium indices and the shortfall on equilibrium:


Thursday, October 31, 2013

31/10/2013: Irish Residential Property Prices: September 2013

Updating the Residential Property Price Index data from CSO released earlier this week, here are the core highlights for September 2013:

  • All country RPPI rose to 68.2 in September from 67 in August, marking sixth consecutive month of rises The index is now up 3.65% y/y (in August it was up 2.76% y/y).
  • 3mo cumulated change in RPPI is 3.96% and 6mo cumulated change is 6.4%. 6mo average rise is 0.66%.
  • Nama valuations (with 10% cushion on LTEV uplift and risk sharing) are now 33.97% off the mark.
  • Relative to peak, index now stands at -47.74% and relative to absolute minimum it is at +6.4%.

For Houses RPPI:

  • Index rose to 71.0 in September from 69.8 in August and posted a 3.35% rise y/y.
  • 3mo cumulated gains are at 4.11% and 6mo cumulated gains are at 6.29%. Average over 6 months monthly increase is 0.69%.
  • Relative to peak, the index now stands at -46.21% and relative to absolute minimum it is at +6.29%.
  • September marked sixth consecutive month of rises in house prices.
For Apartments:


  • Index rose to 50.9 in September from 50.0 in August and posted a 8.53% rise y/y. 
  • 3mo cumulated gains are at 1.6% and 6mo cumulated gains are at 6.26%. Average over 6 months monthly decrease is -0.41%.
  • Relative to peak, the index now stands at -58.92% and relative to absolute minimum it is at +11.38%.
  • September marked second consecutive month of rises in apartments prices.


Dublin RPPI:

  • Index rose to 65.9 in September from 63.4 in August and posted a massive 12.27% rise y/y.
  • 3mo cumulated gains are at 9.47% and 6mo cumulated gains are at 12.07%. Average over 6 months monthly increase is 1.13%.
  • Relative to peak, the index now stands at -51.0% and relative to absolute minimum it is at +15.01%.
  • September marked sixth consecutive month of rises in Dublin property prices.


Conclusions:
  • Twin convergence toward long-term equilibrium prices is now evident in Dublin markets (upward price pressures) and National ex-Dublin prices (downward pressures). 
  • The core question is when will Dublin prices overshoot their long-run trend and moderate again?
  • Another core question is what the fundamentals determined price levels are for Dublin and for the rest of the country?
  • I have no answers to the above questions and anyone who says they do is most likely talking porkies.
  • What I do know is that there are plenty of risks to the downside and headwinds working through the economy. These include: mortgages arrears, income effects of tax and charges changes in Budget 2014, banks rates on existent mortgages; and new mortgages supply and pricing. 
  • So far, my gut feeling is that we are still on a sustainable upward trend in Dublin and on moderating negative trend in the rest of the country. 

Thursday, September 26, 2013

26/9/2013: Irish Residential Property Prices: August 2013

Residential Property prices Index for Ireland is out today, showing strong gains in property prices in Dublin.

Y/y August 2013 residential property prices increased by 2.8% nationally. This compares with an increase of 2.3% in July and a decrease of 11.8% recorded in the twelve months to August 2012. That is a reasonable number, ahead of inflation rate, which is natural given the contraction in the market experienced so far.

However, several sub-trends are worth noting.

  • Residential property prices grew by 0.9% in the month of August. This compares with an increase of 1.2% recorded in July and 1.3% growth in June. Which implies that the rate of growth has slowed down through August. Seasonality is a factor here. 
  • Annual rate of growth is still rising: from 1.23% in June, to 2.31% in July to 2.76% in August. This means we have: rising rate of growth and three consecutive months of growth. Last time we had three consecutive months of growth was back in 3 months through January 2008.
  • 3mo MA for all properties index is at 66.33 in August, which is the best reading since March 2012. Over the last 3 months property prices rose cumulative 3.4% and over the last 6 months they are up 4.04%
  • August reading is the highest level since January-February 2012, although prices are still down 48.66% on peak.

The above is illustrated in Chart below:


Now, absent other sub-trends, we can be tempted to call a turnaround in the prices at this stage. With two caution notes: (a) this still is subject to adverse risks from the mortgages arrears side, and (b) the above turnaround only applies to Dublin.


Next positive bit: the uptick in the overall index was co-driven by the Houses prices (as opposed to Apartments). Houses prices are more indicative of long-term demand, rather than of short-term lettings demand closer linked to Apartments.

  • Houses price index rose 0.87% m/m and was up 2.65% y/y in August. August annual rate of increase was faster than July (2.06%) and June (0.89%) and marks the third consecutive annual rise. 
  • 3mo MA is now at the levels last seen around March 2012 and the overall index itself is at the levels of January-February 2012. Prices are still down 47.12% on peak.

Chart to illustrate:

Apartments prices have been moving sideways doe the last 8 months, bouncing around 49.5 mean. August reading was weak but slightly up at 50.0.


The core driver for overall RPPI is Dublin:

  • Dublin residential properties prices rose 10.55% y/y in August marking 8th consecutive month of increases. 
  • 3mo MA is at 61.93, the best level since December 2011 and the index itself is at the levels of October 2011.
  • These are solid gains and Dublin market appears to be in full turnaround, although prices are still down 52.86% on peak. Most of these gains was driven by houses, not apartments.

Chart to illustrate:


In brief: 

  • Good news is prices are growing broadly in-line with inflation plus modest recovery in values. 
  • Further good news, Dublin prices are converging up toward national levels - something that should have happened ages ago. 
  • More good news: prices outside of Dublin are slowly correcting down, declining 2.6% y/y in August. 
  • I think we can call turnaround in prices to be sustained for Dublin and getting closer to showing sustained upward dynamics for national level prices. Prices for Apartments and prices for properties outside of Dublin are still in declining or flat mode. 
  • Headwinds and risks remain on the side of mortgages crisis resolution and income dynamics.

Tuesday, July 23, 2013

23/7/2013: Irish Residential Property Prices: June 2013

Irish Residential Property Price Index (RPPI) is out today with latest figures for June 2013 offering a snapshot on H1 and Q2 activity in the sector, with some encouraging signs.

From the top line data: the overall property price index has managed to post the first annual increase in June since January 2008. However, overall trend in overall index remains flat, as established from Q2 2012.

  • Year on year, RPPI was up 1.23% in June, having posted -1.07% growth in May 2013.
  • 3mo cumulated change through June 2013 was at 2.34% and this contrasts +0.62% rise in 3 months through May 2013.
  • 6mo cumulated change remains negative at -.03%, but much shallower than -1.97 6mo cumulated change through May 2013.
  • M/m June rise of 1.23% was the largest m/m move up since September 2007.
  • However, on 3mo MA basis, the index June reading was 65.0 - still below the levels recorded in February 2013.
  • Relative to peak the index is down 49.73%, the best reading since December 2012. However, the RPPI is only 2.34% above the all-time low.
Top-line conclusion: RPPI is struggling to lift up above the flat trend despite the unprecedented level of prices collapse to-date.

Chart to illustrate the above trends:


Apartments drove the overall index up on a m/m basis and largely accounted for much of change y/y. The problem is that apartments index is based on thin data, so it is subject to much volatility.
  • Houses RPPI was up 0.89% y/y in June, having posted a y.y contraction of -0.88% in May. M/m index rose 0.89%.
  • 3mo cumulated increase in Houses RPPI was 2.10% in June against a rise of 0.9% in May.
  • 6mo cumulated move in Houses RPPI remains negative at -0.73% - a moderation on -2.17% contraction in May.
  • 3mo MA through June is 67.7, which is the best 3mo MA reading since February 2013 (67.93).
  • Relative to peak, Houses RPPI is down 48.3% and current index reading is only 2.1% above the all-time low.
  • Apartments RPPI reached 50.1 in June 2013, up 5.25% y/y and this contrast in the index being down 3.09% y/y in May 2013. M/m June move stood at +6.37%.
  • 3mo cumulated change through June 2013 stood at +4.59% a strong reversal on -8.54% 3mo cumulated fall in May 2013.
  • 6mo cumulated rise in June stood at 6.82% against 6mo cumulated rise of 3.06% in May 2013.
  • Current reading of the index is 59.56% below the peak and is 9.53% ahead of the absolute low.
  • However, Apartments RPPI STDEV during the crisis period has been at 23.5 against 20.3 for Houses Index. And STDEV for m/m changes was 2.36 for Apartments, against 0.84 for Houses.
  • 3mo MA for Apartments index reached 48.53 in June 2013, which is above May 3mo MA, but below April.
Chart below illustrates Apartments and Houses indices trends:

Top line conclusions: Again, the flat trend remains for the houses index and there is a slight upward trend for the apartments. Both series are relatively anaemic, despite the positive moves. High volatility in Apartments index suggests that caution should be used in interpreting overall RPPI data short-term moves.

Dublin RPPI:
  • Dublin RPPI rose 4.15% y/y in June 2013, having posted a rise of 1.37% y/y in May. June marks sixth consecutive month of increases in Dublin RPPI (y/y terms).
  • 3mo cumulated change in June stood at 2.38% reversing the 3mo cumulated decline of -0.17% in May 2013.
  • 6mo cumulated increase in June was 1.69%, reversing a -1.33% 6mo cumulated drop in may.
  • Relative to peak, Dublin RPPI is now down 55.24% and relative to absolute low the index is up only 5.06%.
  • 3mo MA at 59.43 in June 2013 is the best 3mo MA reading since January 2013.
  • Against the peak, current reading brings us back to the levels last seen in December 2011-January 2012.
Chart to illustrate:


Top line conclusions:  Dublin RPPI is showing most significant and lasting gains of all sub-indices, backed also by medium-range volatility (STDEV for m/m changes is 1.38 for Dublin RPPI).

How significant was the skew in All Properties RPPI due to movements in Apartments? Very significant. 
  • All RPPI was up 1.2% y/y in June 2013
  • National Houses RPPI was up 0.9%
  • National Apartments RPPI was up 5.3%
  • Ex-Dublin, All RPPI was down -1.0%, Ex-Dublin Houses RPPI was down 0.9% (close to All RPPI ex-Dublin)
  • Dublin All RPPI was up 4.2% with Dublin Houses RPPI up 3.6% and Dublin Apartments RPPI up 9.7%.
Hence, overall RPPI was strongly pushed up by Apartments and Apartments index was pushed up by Dublin Apartments.

Saturday, June 29, 2013

29/6/2013: Nama valuations update to May 2013

In the previous post I looked at the latest prices trends in Irish property markets. Now, as promised, an update on Nama valuations.

Note: these numbers are indicative, rather than exact estimates.


29/6/2013: Irish Residential Property Prices: May 2013


This week, CSO released Residential Property Price Index (RPPI) for May. Here's the update on trends and changes. Nama valuations update will be posted in a follow-up post.

Per CSO data, All properties RPPI rose marginally from 64.6 in April to 64.8 in May, 2013. The index is now in the range of 64.1-64.8 for four months in a row, suggesting no change to the overall flat trend at around 65.2. The flat is now running from February 2012, and we are currently below the trendline by about 0.6%.

Year on year, index is down 1.07% and in April it was down 1.22%. Over the last 3 months, All-RPPI rose 0.62% cumulatively, which reverses 1.22% loss on 3mo through April 2013. On 6mo basis, cumulative, All-RPPI is down 0.33% which is an improvement on 1.22 loss over 6 months through April 2013.

2013 is not shaping that great so far, as All-RPPI is down 1.52% since December 2012 end.

Overall, All-RPPI is down 50.34% on all-time peak and in May 2013 it was up only 1.09% on all-time low of 64.1 reached in March 2013.


Houses sub-index rose from 67.3 in April 2013 to 67.6 in May - another marginal improvement. Y/y index is down 0.88% and in April it was down 1.17%. 3mo cumulated gain through May 2013 was 0.9% and there was a 6mo cumulated loss of 2.17%. Relative to peak, the series are down 48.79% and the sub-index is 1.2% above the all-time low.


Per chart above, Apartments sub-index is again in decline, falling from 48.4 in April 2013 to 47.1 in May. Y/y sub-index is down 3.09% and previous y/y decline was 2.42%. 3mo cumulative move in May 2013 was -8.54%, while on 6mo basis, the index is up 3.06%. There is huge volatility in the index by historical standards, which suggests that the market is subject to some very concentrated volume swings in sales.

Dublin sub-index has been used before to drum up the evidence that Irish property markets are returning to life. Chart below shows a marginal positive sloping of the trend since the historic lows of H1 2012.

However, at 59.2, May reading came in only marginally better than 58.9 in April 2013. Year on year, Dublin sub-index is up 1.37 and on cumulated 3mo basis, May reading is down 0.17%. On cumulated 6mo basis, the decline is -1.33% through May. There is zero gain since the end of December 2012. 6mo average reading is now 59.2 - bang on with May 2013 reading. 12mo average is at 58.74, less than 0.8% away from the current reading. For all intent and purpose, current trend is flat at around 58.7-59.0 range. Overall, Dublin prices are down 55.99% on peak and are 3.32% up on absolute low.


Friday, June 14, 2013

14/6/2013: Scary table of the week: Irish Property Prices 'Recovery' Dating

Updating my databases, I came across an old exercise of estimating the property prices recovery paths for Ireland based on the CSO Residential Property Price Index. Here's an updated table of dates of expected recovery according to three basic scenarios:


There is virtually no point of repeating the same exercise for real values, albeit the closest this comes to such an attempt is Scenario 3.

All calculations are based on CSO data.

Friday, April 26, 2013

26/4/2013: Where's that 'recovery' thingy? Irish Residential Property Prices, March 2013

Various Irish ministers and Government 'analysts' have been on the media in recent months extolling the virtues of 'recovery'. In a society still obsessed with property prices, one of the key tenets of the 'recovery is upon us' proposition is the view that Irish property prices are rising once again usually followed by the claims that hordes of 'foreign investors' and 'domestic cash buyers' are fighting to get their hands on prized Irish properties.

Of course, a major point of internal contradiction for all these 'green jersey' claims is that if property prices are rising, then the cost of doing business in Ireland should be rising as well, just as the 'analysts' are claiming that it is falling, especially when it comes to rents and property costs. You see, one can't really have both: deflation in costs is incompatible with rising prices on assets underlying these costs.

Meanwhile, as usual with the Government's exhortations, reality has been having a mind of its own.

Latest numbers from CSO, covering the Residential Property Price Index for Ireland, show exactly how out of touch the folks peddling are.

All properties RPPI fell 3.03% y/y in March and this accelerated 2.57% y/y fall recorded in February. M/m property prices were down 0.47%, which is better than 1.59% m/m drop in February, but marks 4th consecutive month of monthly prices drops. Last time Irish residential property prices were up was in November 2012 and since then we have seen a cumulative decline in prices of 3.03%.

6mo cumulative decline in RPPI stands at 2.58% against previous 6mo cumulative drop of 1.23% and against average m/m drop over the last 6 months of 0.43%.

In fact, All Properties index has fallen to an all-time low in March 2013 despite numerous proclamations of recovery by the Government. Property prices are now down 50.88% on their peak and are statistically significantly below crisis period average.


The distance to 6mo MA line is now widening, which suggests that we might be in a medium-term secular change in trend downward from the previous trend that was just flat. As a note of caution: this remains to be confirmed over time.

House prices also hit an all-time low in March 2013 with index sliding 3.05% y/y, against 2.90% decline recorded in February, and 0.3% down on m/m basis. 3mo cumulated change is now -3.04%, 6mo cumulated change is at -2.77% and previous 6mo cumulated change was -1.47% so things are getting worse faster. House prices are now down 49.39% on peak.

Apartments prices have decline 1.44% in March on y/y basis, having posted 6.4% rise y/y in February. Monthly change in Apartments prices was -6.99%. 3mo cumulated change in prices is still +2.13%, with 6mo cumulated change of +2.13% down from previous 6mo cumulated change at +9.81%. Relative to peak, Apartments prices are running down 61.34% and relative to all-time low they are up just 4.81%.


Dublin prices were most often cited as showing significant gains in the current 'recovery'. These are still up 1.38% y/y in march, but they were up 2.95% y/y in February. Monthly drop in Dublin residential properties was -0.84% m/m and this marks second consecutive m/m drop. 3mo cumulated change in prices was -0.68% against -1.17% in previous 3mo period, 6mo cumulated change is now at +0.17% against +3.49% increase on previous 6mo period. Dublin prices are now down 56.28% on peak and are up 2.62% on absolute low.


In short, to conclude:

  1. As I have maintained throughout recent months, Irish residential property prices are trending flat overall.
  2. Flat trend is now being challenged to the downside, with some indications that it is turning to negative, though this requires more data to make any conclusion firm.
  3. Prices are seeking some catalyst in the market and despite all the efforts by the Government to 'talk the talk' on recovery, there are no indications from the property market that such 'recovery' is anywhere in sight.

Tuesday, April 2, 2013

2/4/2013: Confused or spun? Property prices in Ireland


So foreign investors are allegedly flocking in thousands to Irish commercial real estate markets, snapping anything they can get their hands on... right
http://www.independent.ie/business/world/number-of-empty-office-buildings-soars-by-67pc-29167687.html

Meanwhile, of course, residential property is on a 'recovery path' (aka flat-line dead) per latest CSO figures for the Residential Property Price Index.


In February 2013, RPPI for all properties fell from 65.4 in January to 64.4 (a decline of 1.53% - the steepest rate of m/m drop since February 2012 and worse than the year-to-date average m/m decline of 1.07%). The index is now down 2.57% y/y.

Looking at slightly smoother 3mo figures: 3mo cumulative change on previous 3 months was -2.57% which signals acceleration in decline compared to 6mo change on previous 6 mo at -1.23%. Thus, relative to peak, RPPI hit absolute bottom at -50.65% with previous record drop of -50.34% recorded in June 2012.


The Government needs some serious spin to paint house prices dynamics in anything but bleak terms. Per RPPI, House prices are deteriorating, slipping to 67 in February 2013 from 68.1 in January 2013 and setting an all-time record low. House prices are down 1.62% m/m and 2.90% y/y. 3mo cumulated change is -3.04% and 6mo cumulated change is -1.47% so things are getting worse, not better, over time once again.

RPPI overall, however, was supported to the upside by the price changes in sub-index covering Apartments. Apartments prices sub-index rose to 51.5 in February from 48.1 in January (+7.07% m/m) which suggests that a single outlier transaction might have distorted the cumulative figures. Nonetheless, in terms of 3mo MA this only brings sub-index to the levels of May-June 2012.


Lastly, Dublin sub-index showed once again that flat-line can actually be associated with both down and up volatility. In February 2013 Dublin sub-index slipped to 59.3 from 59.5 in January, which means that the index is now up 2.95% y/y. Happy times? Somewhat. But note that 6mo cumulated change through February 2013 was at +3.49% while 3mo cumulated change through February is -1.17%, so dynamically things are worrisome, rather than encouraging.


Funny thing this recovery, folks... Government & Green Jerseys say one thing, their own data says another... confused.com? or maybe spin.ie?