Showing posts with label Nama valuations. Show all posts

Saturday, June 29, 2013

29/6/2013: Nama valuations update to May 2013

In the previous post I looked at the latest prices trends in Irish property markets. Now, as promised, an update on Nama valuations.

Note: these numbers are indicative, rather than exact estimates.


Sunday, May 27, 2012

27/05/2012: RPPI for April 2012: Implications for Nama

In the previous post I looked at the potential changes in the trends relating the RPPI and its components. Now - a quick update, as usual on implications of April Residential Property Price Index on Nama valuations.

Please keep in mind two things: 1) this relates only to residential property and is not fully reflective of the entire Nama portfolio, as both selection effects and portfolio composition effects would introduce significant differential for Nama actual losses, 2) LTEV and burden sharing assumptions apply in terms of averages, not specific to each type of property covered here. In other words, these numbers are simply comparative approximations and not exact forecasts of Nama losses.

  • Overall residential property price index has posted a decline of 49.89% on peak in April 2012. This corresponds to a decline of 36.7% on Nama LTEV valuations and 33.67% decline on Nama valuations inclusive of LTEV and net of burden sharing.
  • Recall that Nama first called 'the bottom' for property markets to occur at the end of Q1 2010. Alas, since then property prices have fallen - on aggregate - 27.09%.
  • Nama holds some houses. These are now down 48.41% on peak and 36.31% down on Nama cut-off valuation date, implying a decline of 33.27% on Nama valuations inclusive of LTEV and burden-sharing.
  • Nama holds loads of apartments, which are down 59.07% on peak and 41.13% down on Nama cut-off valuation date, implying that these are down 38.33% on Nama valuations inclusive of LTEV and burden-sharing.
Some pretty big figures out there.

27/05/2012: Residential Property Prices: April 2012

Much has been made in the media on the foot of the latest (April 2012) data for residential property prices in Ireland.

In light of this, let's do some quick analysis of the data. The core conclusions, in my opinion are:

  1. Data from CSO - the best we have - only covers mortgages drawdowns reflecting actual sales. So this is tied to mortgages issuance activity and is of limited use in the markets where cash sales are significant.
  2. If increases in prices are sustained, mortgages drawdowns might be reflective of improved credit flows or credit flows fluctuating along the bottom trend.
  3. The above two points strongly suggest that we need to see more sustained trend to draw any conclusions on alleged 'stabilization' of the market.
  4. Aside from seasonality, the data shows patterns of false bull-runs or 'stabilization' episodes in the trends that usually were followed by downward acceleration on the pre-stabilization trend. Not surprisingly, the core improvements in March-April 2012 are in exactly the segments of the markets where such false starts have been more pronounced in the past.
So caution is warranted. 

Top stats:
  • Residential property price index has fallen from 66.1 in February and March 2012 to 65.4 in April implying m/m change in overall prices of -1.06% - the shallowest monthly decline since July 2011, other than zero change in m/m prices recorded in March 2012. 
  • This m/m pattern of slower decline (to near zero rate of fall) from a steep previous drop, followed by re-acceleration in decline is something that is traceable to October 2010-January 2011, June-August 2011, July-September 2010, February-April 2010, October-December 2009, so caution is warranted in interpreting short-term 'stabilization' episodes.
  • Y/y index fell 16.37% in April, an acceleration on March 2012 y/y decline of 16.32%, but a very slight one. Current y/y decline is the second shallowest since November 2011, so no signs of stabilization here either. In fact, April 2012 y/y rate of decline was the 5th sharpest for any month since January 2010.
  • Index reading continues underperforming its 3mo MA which currently stands at 65.87.
  • Relative to peak, the index is now down 49.89%.
  • Thus, overall, by both, its absolute level, and its 3mo MA, as well as relative to peak, the index is at its new historic low. Stabilization is not happening anywhere at the levels terms.


Chart below shows sub-indices performance for houses and apartments. While it is clear that houses sub-index is the driver of overall prices, the apartments sub-index received much of attention in recent months. The reason for it is two consecutive months of increases in apartments prices. Details are below:


  • Overall, House prices fell in April 2012 to index reading of 68.1 from 68.9 in March, registering a m/m drop of 1.16%. This represents an acceleration from -0.14% m/m decline in March 2012. However, April m/m drop is the shallowest since July 2011. 
  • Despite the above, bot the index and the 3mo MA have again hit their lowest point in history of the series.
  • Y/y house prices are down 16.24% and this is the fastest y/y decline since November 2011. 
  • Relative to peak house prices are now down 48.41%.
  • Apartments prices index has improved from 48.6 in March 2012 to 49.6% in April 2012 (m/m rise of 2.06% following a 0.41% rise in March 2012).
  • However, m/m rises are not rare for the sub-index. Apartments prices subindex rose - in m/m terms - in November 2011 (+2.68%), December 2010 (+0.31%), December 2007 (+0.50%) and posted falt or near-flat (1/4 STDEV from zero reading) in February 2008, January 2011, May 2011, and December 2011. 
  • 3mo MA is now at 48.87% and this is the lowest on the record 3mo MA reading for the sub-index.
  • Y/y the decline in April was 17.88% while March 2012 y/y decline was 20.33%. This is the lowest y/y decline reading since January 2012. However, back in April 2011, y/y decline was 'only' 15.29% - shallower than in April 2012.
  • Relative to peak apartments prices are now down 59.97%.

Conclusion: any talk about 'price trends improvement' in apartments will have to wait for further confirmation of the upward trend.

Chart below shows trends for prices in Dublin - another focal point of attention for those claiming substantive change in property prices trends.


  • Dublin property prices sub-index has improved from 58.0 in march 2012 to 58.3 in April 2012, reaching exactly the same level as in January 2012. Thus, m/m index rose 0.52% which is slower than March 2012 m/m rise of 0.69%. Last time the sub-index posted non-negative m/m change was in July 2011 when it remained unchanged m/m and last time sub-index actually posted positive growth was in May 2011.
  • To see two consecutive monthly rises in the index, however, is rare. We would have to go to January-February 2007 for that. However, index posted a number 'near trend reversals' in the past marked on the chart. All turned out to be false calls and virtually all led to re-acceleration of the downward momentum compared to pre-event.
  • Y/y sub-index posted a decline of 17.30% against 18.31% in March 2012. In April 2011 y/y change was 12.96% - much shallower than current y/y decline.
  • 3mo MA is unchanged in April 2012 at 57.97 compared to March 2012, and is much lower than 71.27 registered in April 2011.
  • Relative to peak, house prices in Dublin are now 56.65% down which is identical to their position in January 2012.

Overall, all data points to potential stabilization that is in a very nascent state. However, this is certainly a local phenomena for now - with Apartments and Dublin properties showing some potential signs of improvement. Only the future can tell if:
  1. we are witnessing actual flattening of the trend, and/or
  2. we are witnessing a reversal of downward trend toward a positive (sustained) trend.

Friday, March 2, 2012

2/3/2012: Nama valuations - January 2012 update

In the previous post I looked at the latest data on residential property prices (link here). Here, let's update the Nama valuations numbers based on January 2012 property prices data.

Table below summarizes referencing of January 2012 numbers to two different dates: November 30, 2009  - the cut-off date for Nama market value assessments, and Q1 2010 - the first time Nama tried to call property market 'bottom'. So 'Loss' on nama book valuations refers to the percentage difference between the cut-off date value of properties and current value of properties according to RPPI - please note, this is an economic loss - not an actual loss to be provisioned for. Nama valuations inaccuracy index is reflection of Nama prediction - implicitly reflected in its business plans - that the property market in Ireland will bottom out in Q1 2010. Weighting to book assumes that on residential portfolio 70% of portfolio in in Apartments and 30% in houses.


Note that in the above I take account of Nama-applied Long-Term Economic Value uplift and net out the subordinated debt cushion of 5% for burden sharing (Nama loss cushion). When you think about it, we are paying six figure salaries to these boffins who are almost 30% wrong in their market predictions just 7 quarters out.

Tuesday, January 24, 2012

24/1/2012: Residential property prices - 2011 highlights

Latest Residential Property Price Index (RPPI) from CSO posts another monthly decline in the price series and marks deep drops in the property prices in 2011. Here are top of the line figures - end of year readings:


And updated Nama valuations referencing:

So to summarize (note - there will be more detailed analysis of this data coming up in later posts):

  • All properties index is now 31.1% below January 2005 levels
  • Houses are now down 28.3% below January 2005 levels
  • Apartments are now down 46.5% below January 2005 levels
  • Dublin all properties are now down 39.3% below January 2005 levels
  • Rates of decline (monthly) are greater than 1.5% (12mo average) for 3 months in a row for all properties and for houses.

Tuesday, December 20, 2011

20/12/2011: Residential property prices for November

Today's data focus for Ireland is on residential property price index for November.

Prior to today's release, in the 12 months through October 2011, residential property prices were down 15.1% year on year - steeper decline than in July-September 2011 (12.5%, 13.9% and 14.3% respectively). In 12 months through October 2010 the rate of prices decline was 11.1%, shallower than in the 12 months through last October. So price drops were accelerating before November data release. In fact, mom prices dropped 2.2% in October, against 1.5% mom decline in September.

The latest data, therefore, was expected to come in with some moderation in the rate of decline. And in that, there was no surprise - mom change for November is at -1.54%, ahead of September, but behind October reading. 


November index of all residential properties prices is now at 70.1, down from october 71.2. 3mo MA is down to 71.37 from October reading of 72.63. We have to go back to November 2007 to see the first time that the overall index did not decline (it stayed flat in that month) and back to September 2007 to see the last monthly increase in the index. 12 mo MA of monthly changes is now at -1.41% mom and year-to-date monthly average change is -1.49%.


Nama is continuing taking a hit on its valuations. Referencing back to November 30, 2009 Nama valuations cut-off date, November 2011 prices are down 25.35%, which, adjusting for LTEV uplift applied by Nama implies that Nama valuations on its residential properties portfolio are 32.13% under water. Correcting the above for 'burden sharing' cushion applied by Nama legislation, Nama is nursing a loss of 28.9% on its residential properties-related holdings.


As chart above shows, overall residential property prices are now 46.28% down on the peak and year on year the prices are down 15.64%.

Houses prices index has fallen from 74.3 in october to 72.9 in November - down 1.88% mom, In October, monthly rate of decline was -2.24%, but November decline is second sharpest in the last 5 months. Year on year, house prices are down 15.72%, while in october the same rate of decline was 14.89%. Relative to peak, house prices nationwide are 44.78%.

Apartments fared better this time around, with index reading improving from 52.2 in October to 53.6 in November, a monthly rise of 2.68%. The index is also more volatile than that for all residential prices and house prices. Last time we saw a rise in house prices mom was in August 2010, and last time we saw monthly increase in apartments prices was in December and January 2010.

Apartments prices are now -16.89% down yoy and this marks an improvement on -19.82% decline yoy through October. Relative to peak, apartments prices are down 56.74%.


In my view, the divergence between apartments prices and house prices, if sustained over time, will be signaling the overall collapse of the purchasing power by the first time buyers, as well as demand push toward lower cost commuting locations as cost of transport continues to climb up courtesy of the Government policies. It can also signal the reflection of improving rental yields for some, especially city centre-located - properties. It is worth noting that Dublin apartments drove the monthly change for nationwide figures reported above, with Dublin apartments price index increasing from 50.8 in October to 53.2 in November a strong gain of 4.7% mom and driving year on year decline to -16.1% in November against -21.2% in October.


Prices in Dublin (all properties) posted index reading of 62.2 in November, down 1.43% mom on October reading of 63.1. This was the shallowest monthly decline since July 2011 when the index posted no change mom. Yoy index is now down 17.62% in November from 17.52% in October. Relative to peak the index is down 53.75%.


Updating annual forecasts, I expect overall RPPI to post a reading of ca 71.27-71.30 or a decline of 41.7% relative to peak. For houses, I expect index to run at 74.5-75.1 for 2011, marking a decline of 39.7% relative to peak annual index, while for apartment the same forecasts are for 56.5-56.7 index reading and a decline relative to peak of 49.7%. Dublin prices are expected to end the year on an index reading of 63.5-64.0 - a decline of 47.9% on peak. Mid-points are illustrated below:


So, overall, no surprise - another month of declines, another month on the road toward the average price around 60% off the peak. One to watch here is the sub-index for apartments prices, especially in Dublin.


It's worth noting here that per NTMA (source: Nama, December 2011), commercial property yields have been rising strongly in recent months. See chart below. This can also correlate positively with the rental yields for Dublin apartments, especially for centrally located properties.

Saturday, November 19, 2011

21/11/2011: Residential Property Prices: October

Sorry to break the bad news, folks, but the latest Residential Property Price Index (RPPI) for October is showing accelerating property prices declines on foot of already substantial rates of contraction registered during 2011 as a whole. the bust is getting bustier.

All properties index fell to 71.2 in october from 72.8 in September, posting a monthly decline of 2.20%. This is the sharpest rate of monthly contraction in prices since March 2009 and the third fastest rate of decline in the history of the series! 3moMA for RPPI is now at 72.63. Year on year prices are now down 15.14% - the highest yoy decline since February 2010. Relative to peak prices are down 45.44%. 12 mo MA is at -1.36% for mom rate of decline and year-to-date rate of prices declines average -1.49%.

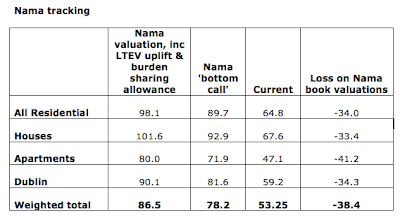
When it comes to Nama, relative to its cut-off date of November 30, 2009, property prices are now down 24.17%. When fully set up, Nama called bottoming out of the markets for Q1 2010. Since then, prices are down 20.62%, so those highly paid geniuses employed by Nama to 'value' properties and 'assess' markets are really shining stars. Recall that Nama paid an uplift of LTEV on assets purchased of an average 10%, plus carries a burden-sharing discount / cushion. Factoring these two into the equation, Nama-assessed properties are now held at a loss of 27.79% on their Nama valuations, even with burden sharing cushion 'savings' factored in. Taken across Nama book value, these (for now paper) losses can be assessed at ca €8.3bn.


Let's drill deeper. House prices sub-index is now at 74.3 against 76.0 in September, a decline mom of -2.24% the largest monthly drop since June 2011. 3moMA now stands at 75.77 and year on year change in the sub-index is 14.89% - the steepest annual decline rate since February 2010. relative to peak house prices sub-index is now -43.71% off. 

Apartments prices sub-index fell from 53.2 in September to 52.2 in October, a mom drop of 1.88% shallower than September mom decline of 3.10%. 3moMA is now at 53.43 and year on year sub-index is down 19.81% - the steepest annual decline since April 2010. Relative to peak, apartments prices are now off 57.87%.


Recalling that Nama holds loads of assets written against apartments, Nama cut-off-date valuations, LTEVs and burden sharing cushion included, Nama valuations for apartments-related properties are now off 35.10%.


Chart above shows the price dynamics for Dublin properties. Dublin sub-index stands at 63.1 against September reading of 65.1, a mom decline of 3.07% - steepest since the catastrophic drop of 3.76% in August this year. 3mo MA is now at 64.9 and year on year prices in Dublin are down 17.52% - largest yearly decline since March 2010. Relative to peak, Dublin residential prices are down 53.09%.

Given the above, we can update projections for the core index and sub-indices for 2011 as a whole. These are shown below.


Depressing is the word that comes to mind. The picture is made even less palatable when we recall incessant blabber from our Government reps and stuff-brokers, as well as property 'experts' that inundated the earlier parts of the year with 'property prices will bottom out in H2 2011' noise.

Tuesday, October 25, 2011

25/10/2011: Residential property prices: September

According to CSO Residential Property Prices index, September 2007 saw the historical peak in prices for overall RPPI at 130.5. Today's data shows that the index now stands at 72.8, implying that property prices have fallen nationwide by 44.2% on average since 4 years ago. Miserable news.

Now, September RPPI for all properties has fallen 1.49% mom and 14.25% yoy, exceeding (in terms of fall) analysts expectations for 13.4% decline. 12mo MA of monthly declines now stands at 1.27% and year-to-date average monthly decline is at 1.41%.

Relative to Nama's cut-off valuation date of November 30, 2009, factoring in average LTEV uplift of 10%, Nama residential properties-linked assets portfolio is now on average 29.52% under water. Factoring 5% burden-sharing (subordinated bonds), the downside is now 26.2% which means that Nama will need a lift-up of 35% on current values to break even.


For Houses, nationwide, RPPI fell to 76 in September from 77 in August a decline of 1.3% mom and 13.93% yoy. The index is now down 42.4% on peak of 132 achieved in September 2007. Apartments sub-index is down to 53.2 in September from 54.9 in August, with mom contraction of 3.1% - the sharpest monthly decline since March. Yoy the sub-index is down 19.03% and relative to the peak of 123.9 (February 2007) the sub-index is down 57.06%.

Nama holds loads of apartments, so applying the earlier assumptions on LTEV, Nama apartments-linked sub-portfolio is under water 36.9%, implying, net of subordinated bonds, a 33.9% decline in valuations to November 2009 cut-off date. This suggests an average required uplift in apartments prices of 55.12% for break-even.

Dublin properties prices are now 51.6% off their peak, with sub-index for Dublin declining to 65.1 in September from 66.5 in August - a drop of 2.11% mom and 15.56% yoy.


Annual forecasts, updated to include September figures, are below


Monday, September 26, 2011

26/09/2011: Irish property prices hit Early Paleozoic layer

Another month, another "Splat, Zap, Squish!" from the Amazing Property Bust Land, Ireland. CSO's RPPI data out for August today is showing continued falls in property markets and accelerating on the July 'performance'. Here are the updated charts and numbers.

Headlines are not pretty, folks:
  • RPPI down 13.87% annually in August against a fall of 12.47% in July index now stands at 73.9 down from 85.8 in August last year.
  • In 12mo through August the decline was 10.8%.
  • Mom prices are down 1.6% in August. 3mo MA is at 74.9 down from 76.0 in July.
  • Relative to peak, prices are now down 43.4%
  • Relative to Nama valuations cut-off date of Nov 30, 2009, prices are down 21.3%. Adding LTEV uplift applied by Nama to purchased loans, state-held residential portoflio is now down in values some 28.5%.
Headlines on property prices by type are even less pretty:
  • RPPI for houses is at 77.0 in August, down 1.41% on 78.1 reading in July. 3moMA is now 77.9, down from 79.0 in July. Year on year prices are down 13.58% from index reading of 89.1 in August 2010. Relative to peak prices are down 41.7% (September 2007). This is the steepest rate of decline since March 2011.
  • RPPI for apartments is at 54.9, down 4.7% on July reading of 57.6. August 2010 reading was 67.2, so we are now 18.3% down yoy. 3moMA is now at 57.3, down from 59.0 in July. Monthly rate of declines is now accelerating for the 3rd month in a row. August rate of decline is the steepest monthly decline in the history of the series. Relative to peak (February 2007), apartments prices are now down 55.69%.
Geographical distribution of price changes:
  • Dublin residential property prices fell by 3.76% in August and were 14.85% lower than a year ago. Dublin house prices decreased by 3.4% in the month and were 14.7% lower compared to a year earlier. Dublin apartment prices fell by 6% in the month of August and were 17.4% lower when compared with the same month of 2010. 3mo MA for Dublin properties is now at 68.23, down from 69.7 in July. Relative to peak (February 2007) Dublin prices are down 50.56%. House prices in Dublin are 48% lower than at their highest level in early 2007. Apartments in Dublin are now 57% lower than they were in February 2007.
  • The price of residential properties in the Rest of Ireland (ex-Dublin) fell 0.3% in August compared with an increase of 0.2% recorded in August 2010. Prices were 13.2% lower than in August 2010. The fall in the price of residential properties in the Rest of Ireland relative to peak is at 40%.

My forecast for the annual results is below. In summary - we've gone from the penthouse to the ground floor, through the parking levels and still going - services levels, sewer, imaginary metro tunnel.... next "Splat" is due at around middle Paleozoic layer... see you in October's Early Mammals exhibit...