Showing posts with label Irish property prices. Show all posts

Tuesday, July 23, 2013

23/7/2013: Irish Residential Property Prices: June 2013

Irish Residential Property Price Index (RPPI) is out today with latest figures for June 2013 offering a snapshot on H1 and Q2 activity in the sector, with some encouraging signs.

From the top line data: the overall property price index has managed to post the first annual increase in June since January 2008. However, overall trend in overall index remains flat, as established from Q2 2012.

  • Year on year, RPPI was up 1.23% in June, having posted -1.07% growth in May 2013.
  • 3mo cumulated change through June 2013 was at 2.34% and this contrasts +0.62% rise in 3 months through May 2013.
  • 6mo cumulated change remains negative at -.03%, but much shallower than -1.97 6mo cumulated change through May 2013.
  • M/m June rise of 1.23% was the largest m/m move up since September 2007.
  • However, on 3mo MA basis, the index June reading was 65.0 - still below the levels recorded in February 2013.
  • Relative to peak the index is down 49.73%, the best reading since December 2012. However, the RPPI is only 2.34% above the all-time low.
Top-line conclusion: RPPI is struggling to lift up above the flat trend despite the unprecedented level of prices collapse to-date.

Chart to illustrate the above trends:


Apartments drove the overall index up on a m/m basis and largely accounted for much of change y/y. The problem is that apartments index is based on thin data, so it is subject to much volatility.
  • Houses RPPI was up 0.89% y/y in June, having posted a y.y contraction of -0.88% in May. M/m index rose 0.89%.
  • 3mo cumulated increase in Houses RPPI was 2.10% in June against a rise of 0.9% in May.
  • 6mo cumulated move in Houses RPPI remains negative at -0.73% - a moderation on -2.17% contraction in May.
  • 3mo MA through June is 67.7, which is the best 3mo MA reading since February 2013 (67.93).
  • Relative to peak, Houses RPPI is down 48.3% and current index reading is only 2.1% above the all-time low.
  • Apartments RPPI reached 50.1 in June 2013, up 5.25% y/y and this contrast in the index being down 3.09% y/y in May 2013. M/m June move stood at +6.37%.
  • 3mo cumulated change through June 2013 stood at +4.59% a strong reversal on -8.54% 3mo cumulated fall in May 2013.
  • 6mo cumulated rise in June stood at 6.82% against 6mo cumulated rise of 3.06% in May 2013.
  • Current reading of the index is 59.56% below the peak and is 9.53% ahead of the absolute low.
  • However, Apartments RPPI STDEV during the crisis period has been at 23.5 against 20.3 for Houses Index. And STDEV for m/m changes was 2.36 for Apartments, against 0.84 for Houses.
  • 3mo MA for Apartments index reached 48.53 in June 2013, which is above May 3mo MA, but below April.
Chart below illustrates Apartments and Houses indices trends:

Top line conclusions: Again, the flat trend remains for the houses index and there is a slight upward trend for the apartments. Both series are relatively anaemic, despite the positive moves. High volatility in Apartments index suggests that caution should be used in interpreting overall RPPI data short-term moves.

Dublin RPPI:
  • Dublin RPPI rose 4.15% y/y in June 2013, having posted a rise of 1.37% y/y in May. June marks sixth consecutive month of increases in Dublin RPPI (y/y terms).
  • 3mo cumulated change in June stood at 2.38% reversing the 3mo cumulated decline of -0.17% in May 2013.
  • 6mo cumulated increase in June was 1.69%, reversing a -1.33% 6mo cumulated drop in may.
  • Relative to peak, Dublin RPPI is now down 55.24% and relative to absolute low the index is up only 5.06%.
  • 3mo MA at 59.43 in June 2013 is the best 3mo MA reading since January 2013.
  • Against the peak, current reading brings us back to the levels last seen in December 2011-January 2012.
Chart to illustrate:


Top line conclusions:  Dublin RPPI is showing most significant and lasting gains of all sub-indices, backed also by medium-range volatility (STDEV for m/m changes is 1.38 for Dublin RPPI).

How significant was the skew in All Properties RPPI due to movements in Apartments? Very significant. 
  • All RPPI was up 1.2% y/y in June 2013
  • National Houses RPPI was up 0.9%
  • National Apartments RPPI was up 5.3%
  • Ex-Dublin, All RPPI was down -1.0%, Ex-Dublin Houses RPPI was down 0.9% (close to All RPPI ex-Dublin)
  • Dublin All RPPI was up 4.2% with Dublin Houses RPPI up 3.6% and Dublin Apartments RPPI up 9.7%.
Hence, overall RPPI was strongly pushed up by Apartments and Apartments index was pushed up by Dublin Apartments.

Saturday, June 29, 2013

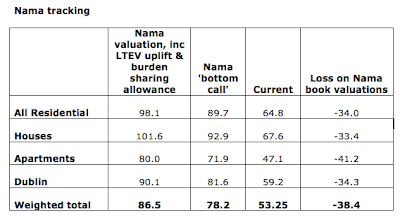
29/6/2013: Nama valuations update to May 2013

In the previous post I looked at the latest prices trends in Irish property markets. Now, as promised, an update on Nama valuations.

Note: these numbers are indicative, rather than exact estimates.


29/6/2013: Irish Residential Property Prices: May 2013


This week, CSO released Residential Property Price Index (RPPI) for May. Here's the update on trends and changes. Nama valuations update will be posted in a follow-up post.

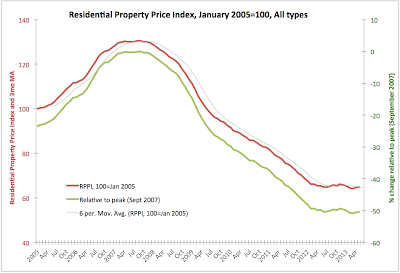
Per CSO data, All properties RPPI rose marginally from 64.6 in April to 64.8 in May, 2013. The index is now in the range of 64.1-64.8 for four months in a row, suggesting no change to the overall flat trend at around 65.2. The flat is now running from February 2012, and we are currently below the trendline by about 0.6%.

Year on year, index is down 1.07% and in April it was down 1.22%. Over the last 3 months, All-RPPI rose 0.62% cumulatively, which reverses 1.22% loss on 3mo through April 2013. On 6mo basis, cumulative, All-RPPI is down 0.33% which is an improvement on 1.22 loss over 6 months through April 2013.

2013 is not shaping that great so far, as All-RPPI is down 1.52% since December 2012 end.

Overall, All-RPPI is down 50.34% on all-time peak and in May 2013 it was up only 1.09% on all-time low of 64.1 reached in March 2013.


Houses sub-index rose from 67.3 in April 2013 to 67.6 in May - another marginal improvement. Y/y index is down 0.88% and in April it was down 1.17%. 3mo cumulated gain through May 2013 was 0.9% and there was a 6mo cumulated loss of 2.17%. Relative to peak, the series are down 48.79% and the sub-index is 1.2% above the all-time low.


Per chart above, Apartments sub-index is again in decline, falling from 48.4 in April 2013 to 47.1 in May. Y/y sub-index is down 3.09% and previous y/y decline was 2.42%. 3mo cumulative move in May 2013 was -8.54%, while on 6mo basis, the index is up 3.06%. There is huge volatility in the index by historical standards, which suggests that the market is subject to some very concentrated volume swings in sales.

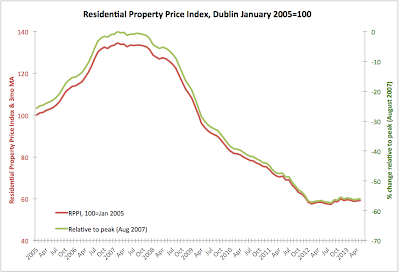
Dublin sub-index has been used before to drum up the evidence that Irish property markets are returning to life. Chart below shows a marginal positive sloping of the trend since the historic lows of H1 2012.

However, at 59.2, May reading came in only marginally better than 58.9 in April 2013. Year on year, Dublin sub-index is up 1.37 and on cumulated 3mo basis, May reading is down 0.17%. On cumulated 6mo basis, the decline is -1.33% through May. There is zero gain since the end of December 2012. 6mo average reading is now 59.2 - bang on with May 2013 reading. 12mo average is at 58.74, less than 0.8% away from the current reading. For all intent and purpose, current trend is flat at around 58.7-59.0 range. Overall, Dublin prices are down 55.99% on peak and are 3.32% up on absolute low.


Friday, June 14, 2013

14/6/2013: Scary table of the week: Irish Property Prices 'Recovery' Dating

Updating my databases, I came across an old exercise of estimating the property prices recovery paths for Ireland based on the CSO Residential Property Price Index. Here's an updated table of dates of expected recovery according to three basic scenarios:


There is virtually no point of repeating the same exercise for real values, albeit the closest this comes to such an attempt is Scenario 3.

All calculations are based on CSO data.

Friday, April 26, 2013

26/4/2013: Where's that 'recovery' thingy? Irish Residential Property Prices, March 2013

Various Irish ministers and Government 'analysts' have been on the media in recent months extolling the virtues of 'recovery'. In a society still obsessed with property prices, one of the key tenets of the 'recovery is upon us' proposition is the view that Irish property prices are rising once again usually followed by the claims that hordes of 'foreign investors' and 'domestic cash buyers' are fighting to get their hands on prized Irish properties.

Of course, a major point of internal contradiction for all these 'green jersey' claims is that if property prices are rising, then the cost of doing business in Ireland should be rising as well, just as the 'analysts' are claiming that it is falling, especially when it comes to rents and property costs. You see, one can't really have both: deflation in costs is incompatible with rising prices on assets underlying these costs.

Meanwhile, as usual with the Government's exhortations, reality has been having a mind of its own.

Latest numbers from CSO, covering the Residential Property Price Index for Ireland, show exactly how out of touch the folks peddling are.

All properties RPPI fell 3.03% y/y in March and this accelerated 2.57% y/y fall recorded in February. M/m property prices were down 0.47%, which is better than 1.59% m/m drop in February, but marks 4th consecutive month of monthly prices drops. Last time Irish residential property prices were up was in November 2012 and since then we have seen a cumulative decline in prices of 3.03%.

6mo cumulative decline in RPPI stands at 2.58% against previous 6mo cumulative drop of 1.23% and against average m/m drop over the last 6 months of 0.43%.

In fact, All Properties index has fallen to an all-time low in March 2013 despite numerous proclamations of recovery by the Government. Property prices are now down 50.88% on their peak and are statistically significantly below crisis period average.


The distance to 6mo MA line is now widening, which suggests that we might be in a medium-term secular change in trend downward from the previous trend that was just flat. As a note of caution: this remains to be confirmed over time.

House prices also hit an all-time low in March 2013 with index sliding 3.05% y/y, against 2.90% decline recorded in February, and 0.3% down on m/m basis. 3mo cumulated change is now -3.04%, 6mo cumulated change is at -2.77% and previous 6mo cumulated change was -1.47% so things are getting worse faster. House prices are now down 49.39% on peak.

Apartments prices have decline 1.44% in March on y/y basis, having posted 6.4% rise y/y in February. Monthly change in Apartments prices was -6.99%. 3mo cumulated change in prices is still +2.13%, with 6mo cumulated change of +2.13% down from previous 6mo cumulated change at +9.81%. Relative to peak, Apartments prices are running down 61.34% and relative to all-time low they are up just 4.81%.


Dublin prices were most often cited as showing significant gains in the current 'recovery'. These are still up 1.38% y/y in march, but they were up 2.95% y/y in February. Monthly drop in Dublin residential properties was -0.84% m/m and this marks second consecutive m/m drop. 3mo cumulated change in prices was -0.68% against -1.17% in previous 3mo period, 6mo cumulated change is now at +0.17% against +3.49% increase on previous 6mo period. Dublin prices are now down 56.28% on peak and are up 2.62% on absolute low.


In short, to conclude:

  1. As I have maintained throughout recent months, Irish residential property prices are trending flat overall.
  2. Flat trend is now being challenged to the downside, with some indications that it is turning to negative, though this requires more data to make any conclusion firm.
  3. Prices are seeking some catalyst in the market and despite all the efforts by the Government to 'talk the talk' on recovery, there are no indications from the property market that such 'recovery' is anywhere in sight.

Tuesday, April 2, 2013

2/4/2013: Confused or spun? Property prices in Ireland


So foreign investors are allegedly flocking in thousands to Irish commercial real estate markets, snapping anything they can get their hands on... right
http://www.independent.ie/business/world/number-of-empty-office-buildings-soars-by-67pc-29167687.html

Meanwhile, of course, residential property is on a 'recovery path' (aka flat-line dead) per latest CSO figures for the Residential Property Price Index.


In February 2013, RPPI for all properties fell from 65.4 in January to 64.4 (a decline of 1.53% - the steepest rate of m/m drop since February 2012 and worse than the year-to-date average m/m decline of 1.07%). The index is now down 2.57% y/y.

Looking at slightly smoother 3mo figures: 3mo cumulative change on previous 3 months was -2.57% which signals acceleration in decline compared to 6mo change on previous 6 mo at -1.23%. Thus, relative to peak, RPPI hit absolute bottom at -50.65% with previous record drop of -50.34% recorded in June 2012.


The Government needs some serious spin to paint house prices dynamics in anything but bleak terms. Per RPPI, House prices are deteriorating, slipping to 67 in February 2013 from 68.1 in January 2013 and setting an all-time record low. House prices are down 1.62% m/m and 2.90% y/y. 3mo cumulated change is -3.04% and 6mo cumulated change is -1.47% so things are getting worse, not better, over time once again.

RPPI overall, however, was supported to the upside by the price changes in sub-index covering Apartments. Apartments prices sub-index rose to 51.5 in February from 48.1 in January (+7.07% m/m) which suggests that a single outlier transaction might have distorted the cumulative figures. Nonetheless, in terms of 3mo MA this only brings sub-index to the levels of May-June 2012.


Lastly, Dublin sub-index showed once again that flat-line can actually be associated with both down and up volatility. In February 2013 Dublin sub-index slipped to 59.3 from 59.5 in January, which means that the index is now up 2.95% y/y. Happy times? Somewhat. But note that 6mo cumulated change through February 2013 was at +3.49% while 3mo cumulated change through February is -1.17%, so dynamically things are worrisome, rather than encouraging.


Funny thing this recovery, folks... Government & Green Jerseys say one thing, their own data says another... confused.com? or maybe spin.ie?

Saturday, March 30, 2013

30/3/2013: A simple, yet revealing, exercise in house prices


Based on the latest reading for the Irish Residential Property Price Index, I computed three scenarios for recovery, based on 3 basic assumptions of:

  1. Steady state growth of 5% per annum in nominal terms (roughly inflation + 3% pa)
  2. Steady state growth at the average rate of annual growth clocked during 2005-2007 period, and
  3. Steady state growth at inflation + 1% pa
Note, Scenario 3 is the closest scenario consistent with the general evidence from around the world that over the long run, property returns are at or below inflation rates.

Table below summarises the dates by which we can expect to regain 2007 peak in nominal terms:


Yep, turning the corner (whenever we might do that) won't even be close to getting back into the 'game'...

Thursday, February 28, 2013

28/2/2013: Boring, Boring Property Prices in January


When one is bored, truly deeply bored, it is hard to muster much strength to go through the twists and turns of the data. And I am bored, folks. Irish property prices data, released by CSO today, is simply equivalent to watching a fish flopping on hot asphalt - it is simply, clearly, obviously, patently... not going anywhere.

That is the story with the stats from Ireland nowadays - the flatline economy, punctuated by the occasional convulsion up or down.

Alas, to stay current we simply have to go through the numbers, don't we?

Let's first do a chart. Annual series for 2012 are finalised and were revised slightly down on the aggregate index compared to the previous release:


The chart clearly shows that despite all the talk about 'bottoming out' house prices, and 'buyers throwing deposits on unfinished homes' is a quasi-2006 frenzy, property prices in Ireland fell over the full year 2012.

Recall the prediction by some economists that property prices are likely to stabilise around -60% mark on peak? I made similar claim, but referencing in the medium term Dublin and larger urban areas, while stating that nationwide prices will be slower to react due to rural and smaller towns' property markets being effectively inactive. Guess what? Dublin prices were down 56.3% on peak in 2012. Not exactly that badly off the mark. Apartments prices - down 61.1% on peak. Exceeding the mark. Nationwide, properties were down 49.5% on peak, still some room to go, but in my view, we are still heading in the direction of 60% decline.

Now, onto monthly series.

Nationwide Property Prices: 

  • All properties RPPI declined from 65.8 in December 2012 to 65.4 in January 2013 (down 0.61% m/m) and is down 3.25% y/y. 
  • Despite all the 'stabilisation claims', overall RPPI has not posted a single month y/y increase since January 2008. 
  • The 'good news' is that RPPI rate of decline (in y/y terms) has slowed down for the 9th consecutive month in January 2013.
  • 3mo MA has been static now over the last 3 months at 65.77, which simply means that half of the gains that were made from the historical trough of 64.8 in June 2012 to the local peak of 66.1 attained in November 2012 were erased when the index fell to 65.8 in December. January rise is a tiny correction back up.
  • Let's put this differently. January 2012 index returned us back exactly to the level of prices recorded in April 2012 and then repeated in October 2012. 
  • The market is... lifeless. Irony has it: 3mo cumulated gains through December 2012 were exactly zero. 3mo cumulated change in the index through January 2012 is exactly zero.
  • 6mo cumulative gains are more 'impressive' at +0.77%.
  • But put this into perspective: this rate of 'growth' implies annualised rate of +0.878%. At this rate of annual expansion, the next time we shall see 2007 peak level prices for properties, expressed in nominal terms, will be 2092. 
Dublin:
  • Prices in Dublin corrected slightly up in January to 59.5 from 59.2 in December 2012. Latest reading is still below 60.0 local peak recorded in November 2012, so the correction is so far very much partial.
  • Y/y prices are now firmer at +2.06% in January, having posted -2.47% decline in December. January marked the first month that we had y/y increases in prices since November 2007.
  • The rate of price increase in January in y/y terms, however, is basically solely correcting for inflation, which means that for anyone with a mortgage payable today, property 'wealth' is continuing to drop in real terms. Obviously, that is too far advanced of an analysis for the Government and its cheerleaders who think 2.06% increase in just one month over 62 months is a firm sign of a 'turnaround' or worse, 'recovery'.
Instead of boring you with the discussion of detailed stats on dynamics, here are the main charts:


All of the above show basic reality of an L-shaped 'recovery' we have been having to-date. May be, one might hope or one might dread, the prices will move up from here in a more robust fashion. Reality is - so far, they are not... When that reality changes, I will let you know.


Tuesday, January 22, 2013

22/1/2013: RPPI, Ireland: December 2012


In the previous post I took a quick look at the Residential Property Price Index (RPPI) annual series. Here are monthly frequency observations.

All properties:


  • December 2012 All Properties RPPI stood at 65.8, the same level the index was at back in between March and April 2012 and again in September 2012. In Other words, the index de facto is running flat.
  • Put differently, the index has now fully erased the miraculous gain of November 2012 and returned prices back to September levels.
  • Monthly rate of change in the index was negative at -0.454% and the index is running well below 65.77 12mo MA.
  • Year on year the index fell 4.5% in December 2012, after posting a 5.71% decline in November. Thus December represents the slowest y/y rate of decline in the series since May 2008. Which is good-ish sort of news.
  • For Nama valuations, latest data suggests a fall in values of 33.26% net of burden sharing cushion.
  • 12mo MA monthly rate of change is at -0.378% which is shallower than December 2012 m/m decline of 0.454%
  • Putting things into a bit more longer term perspective, simple average of RPPI for the period from January 2008 through present is 90.02, which stands contrasted with 2012 average of 65.73 and 2011 year average of 75.37.
  • On shorter term comparatives: H1 2012 average reading was 65.92 against marginally lower H2 2012 average of 65.53. 
  • Relative to monthly peak, RPPI stood at -49.58% or comfortably rounded off to 50%. This reading for December 2012 was statistically indistinguishable from the 'nominal' monthly low of -50.34% set back in June 2012.
  • Thus, monthly volatility aside, there is no increase in prices. As I noted in November data analysis, we are bouncing along the bottom, which may or may not be a 'true' bottom or a 'false' bottom. This conclusion is further supported by the factors that are likely to impact prices going forward that I outlined in September 2012 data analysis (link here).


House prices sub-index:

  • House prices subindex declined marginally from 69.1 in November to 68.7 in December, thus erasing completely any gains delivered from September 2012. 
  • House price dynamics are virtually identical to those of the overall RPPI as outlined above.
  • 2012 year monthly average index reading was 68.57, slightly behind 68.7 recorded in December. However, 6mo average through H1 2012 was 68.7 and this has fallen to 68.43 average for H2 2012. 
  • Y/y index fell 4.18% in December, marking the shallowest rate of decline in the series since May 2008.
  • Frankly, all of the changes are within the range of being statistically insignificant, so the theme of 'flat line market' continues unabated.


Apartments show the same dynamics as Houses, so let's avoid repetition and note that

  • Houses prices are down 47.95% on peak, while Apartments prices are down 62.15% on peak.


The index has been criticised, for the n-th time by the realtors for failing to reflect the 'great demand' from the cash buyers. Alas, my view is that cash buyers are not, repeat, not a normal market, but rather an aberration that is bound to be short-lived. In this sense, if we want a gauge of real market activity, then the CSO data provides a far better picture than testosterone-fuelled hype of few whales with cash stashed from CPOs of the old days bidding each other out to land a 'family home suitable for conversion into student bedsits'.


Dublin, last.


  • Property prices in Dublin slid from 60 in November to 59.2 in December, marking 1.33% decline m/m and 2.47% drop y/y. 
  • Relative to peak, Dublin market is down 55.99%. Which is above the absolute low of 57.40 achieved in August.
  • On dynamics side, 12mo average is running at 58.32, worse than December reading, but well below 2011 average of 67.86. H2 2012 average is at 58.57 and virtually identical to H2 2012 average of 58.07. In other words, medium-term dynamics are flat. Flatlining is the theme here again.


Saturday, January 12, 2013

12/1/2013: House Prices Valuations via The Economist


An interesting table from The Economist (link) on house prices in select countries (H/T to @greentak ):


Note, obviously, Ireland. Not the bits on changes in prices, but the -1% under-valuation on rents side and -5% under-valuation on disposable income side. This is interesting because, in my opinion, the prices currently are in a 'bounce-along-the-bottom' pattern.

Here are some points of thought:

  • Usually, house prices over-correct, overshooting the longer-term equilibrium levels. This implies that if we are currently close to the bottoming-out of prices (I am not saying we are), then there is a fundamentals-driven upside of small proportion. 1-5% might be a reasonable range.
  • Another feature is the gap in 'under-valuation' between rents-implied and incomes-implied. We have no idea what disposable income The Economist has in mind (GNI? earnings? etc - and these are non-trivial), but we do know they have 'per person' metric. Per person of working age? or children counted in as well? Setting these and other issues aside, the gap between the two is, roughly, reflected in probably two main factors: supply of rentable accommodation relative to demand (which is keeping rents lower, relative to income) and distribution of income (with more potential renters in lower income brackets, while more existent homeowners in higher, implying that renters can't convert into purchasers, while feasible purchasers have no need to go into the market). In other words, the gap is very wide and is significant, in my view, of the tenuous nature of income-based price assessments.
  • The 1-5% undervaluation today, on the slope as steep (-49.4% since 2007) is highly unlikely to be the range of reasonable overshooting of the longer-term prices. In other words, if past experiences are a guide, Irish house prices can easily fall another 10% or more even if we consider the above table-listed drivers alone.
Now, as per arguments that these under-valuations are going to drive the market up, just look at Germany. According to The Economist, German house prices have an upside of 17% both on rental valuations and income valuations bases. Good luck, if you expect that to materialise. 

In short, I am not so sure the above table is meaningful in any sense. Nice to see that someone out there thinks Irish housing markets are undervalued, but I am still to be convinced that this is (a) real, and (b) likely to lead to sustained values increases. 

If you are keen to look at some interactive charts on the above data, go here.

And if you are keen on checking out one crazy property market... look here:


Sunday, November 11, 2012

11/11/2012: Property prices bust 2008-2012


House prices changes peak-to-2009 then 2009-present:


Via Goldman Sachs.

With core driver - fundamentals:


Note Spain (my analysis): fundamentals-driven house prices are yet to travel down to below Irish markets drop... This, of course, is not a precise fully deterministic model (feed-back loops from unemployment to house prices are also going from house prices to unemployment), but it is clear that Spanish property is still 'overvalued' grossly relative to fundamentals.

And here's some other 'bad' news:
Taking the comparative above (again, my reading of the chart), a combination of fiscal direction and debt levels implies Irish house prices are still overvalued by up to 20% or so. Spanish ones - by about 10-15%...

Full note here.

Note: these are not my forecasts. I am only pointing out the direction that the above figures above imply in my view for the property markets.

Friday, September 14, 2012

14/9/2012: Another Indo 'Property Boom Cometh' Missive


An interesting article in the Indo on house prices vs debate about the property tax or site value tax - link here.

A key phrase that caught my eye is: "CSO reports show that prices increased in Dublin".

The latest CSO report we have is that covering data through July 2012, which states:

  • Dublin All Residential Properties: June prices down 1.0% m/m (down 0.3% on 3 mo before June, down 16.4% on 12 month to June 2012); July prices down 0.3% m/m (down 1.2% on 3mo before and down 16.6% on 12 mo before);
  • Dublin Houses: June down 0.8% m/m (0.2% on 3 mo ago, down 16.4% y/y) and July down 0.2% m/m (down 0.5% on 3mo ago and down 16.7% on a year ago);
  • Dublin Apartments down m/m, on 3mo and y/y in May, June and in July down 3.9% m/m, down 8.6% on 3 mo previous and down 19.6% on 12 mo ago.
So unless Indo has either discovered some new data set from CSO, or it has some CSO data on dog houses and parking spots in Dublin (all of which might have gone up in July), then what on earth are they talking about?


Sunday, May 27, 2012

27/05/2012: Residential Property Prices: April 2012

Much has been made in the media on the foot of the latest (April 2012) data for residential property prices in Ireland.

In light of this, let's do some quick analysis of the data. The core conclusions, in my opinion are:

  1. Data from CSO - the best we have - only covers mortgages drawdowns reflecting actual sales. So this is tied to mortgages issuance activity and is of limited use in the markets where cash sales are significant.
  2. If increases in prices are sustained, mortgages drawdowns might be reflective of improved credit flows or credit flows fluctuating along the bottom trend.
  3. The above two points strongly suggest that we need to see more sustained trend to draw any conclusions on alleged 'stabilization' of the market.
  4. Aside from seasonality, the data shows patterns of false bull-runs or 'stabilization' episodes in the trends that usually were followed by downward acceleration on the pre-stabilization trend. Not surprisingly, the core improvements in March-April 2012 are in exactly the segments of the markets where such false starts have been more pronounced in the past.
So caution is warranted. 

Top stats:
  • Residential property price index has fallen from 66.1 in February and March 2012 to 65.4 in April implying m/m change in overall prices of -1.06% - the shallowest monthly decline since July 2011, other than zero change in m/m prices recorded in March 2012. 
  • This m/m pattern of slower decline (to near zero rate of fall) from a steep previous drop, followed by re-acceleration in decline is something that is traceable to October 2010-January 2011, June-August 2011, July-September 2010, February-April 2010, October-December 2009, so caution is warranted in interpreting short-term 'stabilization' episodes.
  • Y/y index fell 16.37% in April, an acceleration on March 2012 y/y decline of 16.32%, but a very slight one. Current y/y decline is the second shallowest since November 2011, so no signs of stabilization here either. In fact, April 2012 y/y rate of decline was the 5th sharpest for any month since January 2010.
  • Index reading continues underperforming its 3mo MA which currently stands at 65.87.
  • Relative to peak, the index is now down 49.89%.
  • Thus, overall, by both, its absolute level, and its 3mo MA, as well as relative to peak, the index is at its new historic low. Stabilization is not happening anywhere at the levels terms.


Chart below shows sub-indices performance for houses and apartments. While it is clear that houses sub-index is the driver of overall prices, the apartments sub-index received much of attention in recent months. The reason for it is two consecutive months of increases in apartments prices. Details are below:


  • Overall, House prices fell in April 2012 to index reading of 68.1 from 68.9 in March, registering a m/m drop of 1.16%. This represents an acceleration from -0.14% m/m decline in March 2012. However, April m/m drop is the shallowest since July 2011. 
  • Despite the above, bot the index and the 3mo MA have again hit their lowest point in history of the series.
  • Y/y house prices are down 16.24% and this is the fastest y/y decline since November 2011. 
  • Relative to peak house prices are now down 48.41%.
  • Apartments prices index has improved from 48.6 in March 2012 to 49.6% in April 2012 (m/m rise of 2.06% following a 0.41% rise in March 2012).
  • However, m/m rises are not rare for the sub-index. Apartments prices subindex rose - in m/m terms - in November 2011 (+2.68%), December 2010 (+0.31%), December 2007 (+0.50%) and posted falt or near-flat (1/4 STDEV from zero reading) in February 2008, January 2011, May 2011, and December 2011. 
  • 3mo MA is now at 48.87% and this is the lowest on the record 3mo MA reading for the sub-index.
  • Y/y the decline in April was 17.88% while March 2012 y/y decline was 20.33%. This is the lowest y/y decline reading since January 2012. However, back in April 2011, y/y decline was 'only' 15.29% - shallower than in April 2012.
  • Relative to peak apartments prices are now down 59.97%.

Conclusion: any talk about 'price trends improvement' in apartments will have to wait for further confirmation of the upward trend.

Chart below shows trends for prices in Dublin - another focal point of attention for those claiming substantive change in property prices trends.


  • Dublin property prices sub-index has improved from 58.0 in march 2012 to 58.3 in April 2012, reaching exactly the same level as in January 2012. Thus, m/m index rose 0.52% which is slower than March 2012 m/m rise of 0.69%. Last time the sub-index posted non-negative m/m change was in July 2011 when it remained unchanged m/m and last time sub-index actually posted positive growth was in May 2011.
  • To see two consecutive monthly rises in the index, however, is rare. We would have to go to January-February 2007 for that. However, index posted a number 'near trend reversals' in the past marked on the chart. All turned out to be false calls and virtually all led to re-acceleration of the downward momentum compared to pre-event.
  • Y/y sub-index posted a decline of 17.30% against 18.31% in March 2012. In April 2011 y/y change was 12.96% - much shallower than current y/y decline.
  • 3mo MA is unchanged in April 2012 at 57.97 compared to March 2012, and is much lower than 71.27 registered in April 2011.
  • Relative to peak, house prices in Dublin are now 56.65% down which is identical to their position in January 2012.

Overall, all data points to potential stabilization that is in a very nascent state. However, this is certainly a local phenomena for now - with Apartments and Dublin properties showing some potential signs of improvement. Only the future can tell if:
  1. we are witnessing actual flattening of the trend, and/or
  2. we are witnessing a reversal of downward trend toward a positive (sustained) trend.

Thursday, March 8, 2012

8/3/2012: Economy on a flat-line: Sunday Times 4/3/2012


This is an unedited version of my article in Sunday Times March 4, 2012.


This week, the conflicting news from the world’s largest economy – the US, have shown once again the problems inherent in economic forecasting. Even a giant economy is capable of succumbing to volatility while searching to establish a new or confirm an old trend. The US economy is currently undergoing this process that, it is hoped, is pointing to the reversal in the growth trend to the upside in the near future. The crucial point, however, when it comes to our own economy, is that even in the US economy the time around re-testing of the previously set trend makes short-term data a highly imperfect indicator of the economic direction.

In contrast to the US economy, however, Irish data currently bears little indication that we are turning the proverbial corner on growth. It is, however, starting to show the volatility that can be consistent with some economic soul-searching in months ahead. Majority of Irish economic indicators have now been bouncing for 6 to 12 months along the relatively flat or only gently declining trend. Some commentators suggest that this is a sign of the upcoming turnaround in our economic fortunes. Others have pointed to the uniform downward revisions of the forecasts for Irish growth for 2012 by international and domestic economists as a sign that the flattening trend might break into a renewed slowdown. In reality, all of these conjectures are at the very best educated guesswork, for our economy is simply too volatile and the current times are too uncertain to provide grounds for a more ‘scientific’ approach to forecasting.

Which means that to discern the potential direction for the economy in months ahead, we are left with nothing better than look at the signals from the more transparent, real economy-linked activities such as monthly changes in prices, retail sales and house price indices, and longer-range trade flows statistics, unemployment and workforce participation data.

This week we saw the release of two of the above indicators: residential property price index and retail sales. The former registered another massive decline, with residential property prices falling 17.4% year on year in January 2012, after posting a 16.7% annual decline in December 2011 and 15.6% decline in November 2011. With Dublin once again leading the trend compared to the rest of the country, there appears to be absolutely no ‘soul-searching’ as house prices continue to drop. House prices, of course, provide a clear signal as to the direction of the domestic investment – and despite all the noises about the vast FDI inflows and foreign buyers ‘kicking tyres’ around empty buildings and sites – this direction is down.

More interesting are the volatile readings from the retail sales data.

The headline indices of retail sales volumes and values for January 2012, released this week were just short of horrific. Year on year, retail sales declined 0.34% in value terms and 0.76% in volume terms. Monthly declines were 3.7% across both value and volume. Relative to peak, overall retail sales are now down 25% in value terms and 21% in volume. January monthly declines in value and volume were the worst since January 2010. Stripping out motor trade, on the annual basis, core retail sales fell 1.94% in value terms and 2.74% in volume terms, although there was a month-on-month rise of 0.3% in value index. Monthly performance in volume of sales was the worst since February 2011.

Looking at the detailed decomposition of sales, out of twelve core Retail Businesses categories reported by CSO, ten have posted annual contractions in January in terms of value of sales. The two categories that posted increases were Fuel (up 5%) and Non-Specialised Stores (ex-Department Stores) (up 1.7%). The former posted a rise due to oil inflation, while the latter represents a small proportion of total retail sales – neither is likely to yield any positive impact on business environment in Ireland. In volume terms, increases in sales were recorded also in just two categories. Non-Specialised Stores sales rose 1.0%, while Pharmaceuticals Medical and Cosmetic Articles rose 1.5% year on year. Overall, only one out of 12 categories of sales posted increases in both value and volume of sales. All discretionary consumption items, including white goods and household maintenance items posted significant, above average declines in a further sign that households are continuing to tighten their belts, cutting out small-scale household investment and durables. The trend direction is broadly in line with November 2011-January 2012 3-months averages, but showing much sharper rates of contraction in demand in January.

The above confirm the broader downward trend in domestic demand that is relatively constant since Q1 2010 and is evident in value and volume indices as well as in total retail sales and core sales. More importantly, all indications are that the trend is likely to persist.

One of the core co-predictors – on average – of the retail sector activity is consumer confidence. Despite a significant jump in January 2012, ESRI consumer confidence indicator continues to bounce along the flat line, with current 6 months average at 56.5 virtually identical to the previous 6 months average and behind 2010-2011 average of 57.3. Based on the latest reading for consumer confidence, the forecast for the next 3 months forward for retail sales is not encouraging with volumes sales staying at the average levels of the previous 6 months and the value of sales being supported at the current levels solely by energy costs inflation.

Lastly, since 2010 I have been publishing an Index of Retail Sector Activity that acts as a strong predictor of the future (3 months ahead) retail sales and is based both on CSO data and ESRI consumer confidence measures, adjusted for income and earnings dynamics. The Index current reading for February-April is indicating that retail sales sector will remain in doldrums for the foreseeable future, posting volume and value activity at below last 6 months and 12 months trends.

Which means that the sector is likely to contribute negatively to unemployment and further undermining already fragile household income dynamics for some of the most at-risk families. During the first half of the crisis, most of jobs destruction in both absolute and relative terms took place in the construction sector, dominated by men. Thus, for example, in 2009 number of women in employment fell 4.2%, while total employment declined 8.1%. By 2010, numbers of women in employment were down 2.8% against 4.2% overall drop in employment. Last year, based on the latest available data, female employment was down 2% while total employment fell 2.5%. In other words, more and more jobs destruction is taking place amongst women, as further confirmed by the latest Live Register statistics also released this week, showing that in February 2012, number of female claimants rose by 3,479 year on year, while the number of male claimants dropped 8,356 over the same period.

The misfortunes of the retail sector are certainly at play in these. Per CSO, female employment in the Wholesale and Retail Trade sector has fallen at more than double the rate of overall retail sector employment declines in 2010 and 2011. Relative to the peak, total female employment is now down 10.2%, while female employment in retail sector is down 17.9%.

Traditionally, acceleration of jobs destruction amongst women is associated with increasing incidences of dual unemployment households. This is further likely to be reinforced by the increasing losses of female jobs in the retail sector, due to overlapping demographics and relative income distributions. Such development, in turn, will put even more pressure on both consumption and investment in the domestic economy.

CHART

Source: CSO and author own calculations

Box-out:

The forthcoming Referendum on the EU Fiscal Compact will undoubtedly open a floodgate of debates concerning the economic, social and political implications of the vote. Yet, it is the economic merits of the treaty that require most of the attention. A recent research paper by Alessandro Piergallini and Giorgio Rodano from the Centre for Economic and International Studies, University of Rome, makes a very strong argument that in the world of distortionary (or in other words progressive) taxation, passive fiscal policies (policies that target constitutionally or legislatively-mandated levels of public debt relative to GDP) are not feasible in the presence of the active monetary polices (policies that focus solely on inflation targeting). In other words, in the real world we live in, the very idea of Fiscal Compact might be incompatible with the idea of pure inflation targeting by the ECB. Which is, of course, rather intuitive. If a country or a currency block were to pre-commit itself to a fixed debt/GDP ratio, then inflation must be allowed to compensate for the fiscal imbalances created in the short run, since levying higher taxation will ultimately lead to economic distortions via household decisions on spending and labour supply. Given that ECB abhors inflation, the Fiscal Compact must either be associated with increasingly less distortionary (less progressive) taxation or with the ECB becoming less of an inflation hawk.

Tuesday, January 24, 2012

24/1/2012: Residential property prices - 2011 highlights

Latest Residential Property Price Index (RPPI) from CSO posts another monthly decline in the price series and marks deep drops in the property prices in 2011. Here are top of the line figures - end of year readings:


And updated Nama valuations referencing:

So to summarize (note - there will be more detailed analysis of this data coming up in later posts):

  • All properties index is now 31.1% below January 2005 levels
  • Houses are now down 28.3% below January 2005 levels
  • Apartments are now down 46.5% below January 2005 levels
  • Dublin all properties are now down 39.3% below January 2005 levels
  • Rates of decline (monthly) are greater than 1.5% (12mo average) for 3 months in a row for all properties and for houses.

Sunday, January 8, 2012

8/1/2012: Irish property prices - History, Equilibrium & Directions to Nowhere Fast

A quick footnote to Brian Lucey's post on house prices:

I often hear people referring to 'historical averages' as price equilibrium indicators. Hmmm... historical and histrionic - here's a snapshot from The Economist data plot:
That pretty much does the trick for anyone still saying we have crossed some sort of the long term equilibrium level... 

Tuesday, December 20, 2011

20/12/2011: Residential property prices for November

Today's data focus for Ireland is on residential property price index for November.

Prior to today's release, in the 12 months through October 2011, residential property prices were down 15.1% year on year - steeper decline than in July-September 2011 (12.5%, 13.9% and 14.3% respectively). In 12 months through October 2010 the rate of prices decline was 11.1%, shallower than in the 12 months through last October. So price drops were accelerating before November data release. In fact, mom prices dropped 2.2% in October, against 1.5% mom decline in September.

The latest data, therefore, was expected to come in with some moderation in the rate of decline. And in that, there was no surprise - mom change for November is at -1.54%, ahead of September, but behind October reading. 


November index of all residential properties prices is now at 70.1, down from october 71.2. 3mo MA is down to 71.37 from October reading of 72.63. We have to go back to November 2007 to see the first time that the overall index did not decline (it stayed flat in that month) and back to September 2007 to see the last monthly increase in the index. 12 mo MA of monthly changes is now at -1.41% mom and year-to-date monthly average change is -1.49%.


Nama is continuing taking a hit on its valuations. Referencing back to November 30, 2009 Nama valuations cut-off date, November 2011 prices are down 25.35%, which, adjusting for LTEV uplift applied by Nama implies that Nama valuations on its residential properties portfolio are 32.13% under water. Correcting the above for 'burden sharing' cushion applied by Nama legislation, Nama is nursing a loss of 28.9% on its residential properties-related holdings.


As chart above shows, overall residential property prices are now 46.28% down on the peak and year on year the prices are down 15.64%.

Houses prices index has fallen from 74.3 in october to 72.9 in November - down 1.88% mom, In October, monthly rate of decline was -2.24%, but November decline is second sharpest in the last 5 months. Year on year, house prices are down 15.72%, while in october the same rate of decline was 14.89%. Relative to peak, house prices nationwide are 44.78%.

Apartments fared better this time around, with index reading improving from 52.2 in October to 53.6 in November, a monthly rise of 2.68%. The index is also more volatile than that for all residential prices and house prices. Last time we saw a rise in house prices mom was in August 2010, and last time we saw monthly increase in apartments prices was in December and January 2010.

Apartments prices are now -16.89% down yoy and this marks an improvement on -19.82% decline yoy through October. Relative to peak, apartments prices are down 56.74%.


In my view, the divergence between apartments prices and house prices, if sustained over time, will be signaling the overall collapse of the purchasing power by the first time buyers, as well as demand push toward lower cost commuting locations as cost of transport continues to climb up courtesy of the Government policies. It can also signal the reflection of improving rental yields for some, especially city centre-located - properties. It is worth noting that Dublin apartments drove the monthly change for nationwide figures reported above, with Dublin apartments price index increasing from 50.8 in October to 53.2 in November a strong gain of 4.7% mom and driving year on year decline to -16.1% in November against -21.2% in October.


Prices in Dublin (all properties) posted index reading of 62.2 in November, down 1.43% mom on October reading of 63.1. This was the shallowest monthly decline since July 2011 when the index posted no change mom. Yoy index is now down 17.62% in November from 17.52% in October. Relative to peak the index is down 53.75%.


Updating annual forecasts, I expect overall RPPI to post a reading of ca 71.27-71.30 or a decline of 41.7% relative to peak. For houses, I expect index to run at 74.5-75.1 for 2011, marking a decline of 39.7% relative to peak annual index, while for apartment the same forecasts are for 56.5-56.7 index reading and a decline relative to peak of 49.7%. Dublin prices are expected to end the year on an index reading of 63.5-64.0 - a decline of 47.9% on peak. Mid-points are illustrated below:


So, overall, no surprise - another month of declines, another month on the road toward the average price around 60% off the peak. One to watch here is the sub-index for apartments prices, especially in Dublin.


It's worth noting here that per NTMA (source: Nama, December 2011), commercial property yields have been rising strongly in recent months. See chart below. This can also correlate positively with the rental yields for Dublin apartments, especially for centrally located properties.