Monday, October 26, 2020

26/10/20: ifo Institute: German Economic Conditions Deteriorated in October

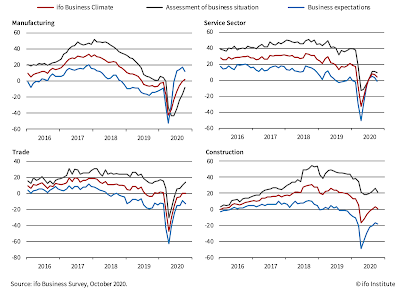
ifo Institute's latest Business Climate survey data for Germany is pointing to continued weakness in the recovery momentum:


Notably, all four sectors covered remain under water:


Current conditions are deteriorating month-on-month in two sectors, expectations have deteriorated in all four sectors.

25/10/20: COVID19: U.S. Excess Deaths are 130,000 at a lower end of estimates

I have been running EU vs U.S. comparatives for COVID19 pandemic dynamics for some time now, and as those reading this blog would know,  some months ago I added an estimate - based on mortality figures - of the excess U.S. deaths compared to the EU27. These currently - by my estimate - stand at 114,621 (see latest estimate here: https://trueeconomics.blogspot.com/2020/10/231020-covid19-update-us-vs-eu27.html). 

My estimate is crude. It is based on timings, population size and mortality rate adjustments. 

A more accurate recent estimate has been provided by the Columbia University study (https://resiliencesystem.org/columbia-university-says-trump-could-have-avoided-over-130000-covid-19-deaths-more-robust-pandemic) that puts the number at 130,000-210,000 'avoidable deaths'.  That is some range, of course. Per study: "If "the U.S. had followed Canadian policies and protocols, there might have only been 85,192 U.S. deaths – making more than 132,500 American deaths 'avoidable,'" the authors wrote. "If the U.S. response had mirrored that of Germany, the U.S. may have only had 38,457 deaths – leaving 179,260 avoidable deaths."

One way or the other, there are at least 100,000+ Americans dead because of the completely shambolic public health system and policy responses by the current Federal and State leaderships in the U.S. 

Columbia study seems to nail some of these factors: "The country's disproportionate death toll stems from delayed federal action, an insufficient testing regimen, a lack of consistent mask-wearing guidance, and the failure of top officials, notably Trump, to model best practices". Alas, predictably (mythology of the American culture), it misses the elephant in the room: the U.S. healthcare system itself. American approach to distributing access to healthcare based on private insurance (plus Medicare and Medicaid) is leaving tens of millions of Americans outside the basic safety net. Those without insurance as well as countless more with the atrociously large deductibles and co-pays are too afraid to present themselves to the hospitals designed to bankrupt people of modest means to seek early support and help. It matters little how much the U.S. authorities test the public (and, yes, tests are highly rationed, still, despite all the bluster from the White House), if people do not seek help in fear of being destroyed financially. 

In 2020, the average annual deductible for single, individual coverage is $4,364 and $8,439 for family coverage. Co-pay normally ranges 10-40% of the bill, though it is more complicated, since there are various caps and step-downs in co-payments. (https://www.ehealthinsurance.com/resources/individual-and-family/how-much-does-individual-health-insurance-cost#:~:text=Deductibles%20and%20cost%2Dsharing%20expenses,and%20%248%2C439%20for%20family%20coverage.)

The typical American household has an average of $8,863 in  a bank or credit union account. There are serious variations by age and type of household, with couples 34 and younger, couples without children have an average of $4,727 in savings, while single people without children have an average of $2,729 in savings. Couples with children between the age of 35 and 44 have an average of $10,399, couples aged 45-54 with children average $15,589. (https://www.cnbc.com/2019/03/11/how-much-money-americans-have-in-their-savings-accounts-at-every-age.html)

Meanwhile, the median charge for COVID-19 inpatient care was $45,683 for people aged 51 to 60 and $34,662 for those in the 23 to 30 age bracket, according to a recent study. This was the median billed to people without insurance or those who were forced to be treated out of network. The highest average allowed amount paid to the provider under an insurance plan was $24,012 for people aged 51 to 60 and, at its lowest, $17,094 for people above age 70. (https://www.thehealthcareloop.com/hospitalized-care-for-covid-19-averages-34662-to-45683-varying-by-age/

So a person visit for COVID19 treatment, counting lost wages, would wipe out between 1/2 and all of the savings held by average household. Contagion within the family would be a near insolvency event.

Anyone surprised American system is killing the U.S. citizens and residents?


Saturday, October 24, 2020

24/10/20: America's Scariest Charts: Duration of Unemployment & Employment Index

Two previous posts covered some core labor markets data for the U.S.:

Here, let's take a look at the weekly (higher frequency) data unemployment claims.

First, initial unemployment claims, with data coverage through the week of October 17th:


The above chart shows 1-month cumulative initial unemployment claims, smoothing some of weekly volatility in the series.

Current reading stands at 3,194,750 which is above the 2008-2011 crisis peak of 3,169,786 and only slightly below all-time pre-COVID19 high of 3,313,000 attained in January 1975.

In absolute level numbers, preliminary first-time claims for the week of October 17, 2020 stand at 756,617 which is still 3 times the rate of first-time claims filings in the last week before COVID19 pandemic onset (March 14, 2020). The good news is, preliminary estimate for the new claims for the week of October 17 suggest a decline in new claims filings of 73,125 on week prior - the fastest rate of reductions in 10 weeks. However, overall average weekly decline in first-time claims over the last 10 weeks has been rather unimpressive at 8,212. At this rate of improvement, it will take almost 62 weeks to draw current first-time claims down to the levels seen in the last pre-COVID19 week.


In line with the crisis timing, average duration of unemployment is climbing up, too:


Based on monthly data through September 2020, average duration of unemployment is about to hit pre-crisis average in October. This sounds like a good thing, until you realise that the duration of unemployment fell to historically low levels as COVID19 crisis unfolded because of the unprecedented rate of jobs losses and unemployment claims increases (see net chart below). It remains to be seen how it will behave in months ahead. 

Past three recessions have been associated with increasing average duration of unemployment through recovery periods. They have also been associated with longer periods of elevated duration. In fact, in the last three recessions, average duration of unemployment never reached pre-recession levels, implying that long-term unemployment got worse in every recovery period since 1990 on. If this trend is consistent with the COVID19 recession, U.S. long term unemployment duration will rise once again. 


For the last chart, consider employment index dynamics though September 2020:


Despite the headline 'historically fast' recovery, actual employment remains in dire state, with current dynamics through September 2020 indicating the third worst employment performance in the history of the modern economy. Based on the 3-months average gains in seasonally-adjusted employment, it will take us another 8 moths before we regain pre-crisis peak employment levels, implying the 5th fastest recovery in employment in history. Based on September rate of improvement, the process will take another 16 months, which would make the current recovery the fifth slowest on record. Based on the dynamics of change in the jobs recovery since May 2020, we can expect the jobs recession to last 45 months, which would make it the 3rd worst recession in history. So far, the average rate of decline in the jobs gained per month during the recovery is 15% per month. 

In the Great Recession, it took the economy 76 weeks to recover from trough of the recession to pre-recession peak employment. The average monthly rate of recovery from the trough until regaining pre-recession peak was 0.128% per month. This would put the month when we would recover from the COVID19 pandemic to July 2025, making the COVID19 pandemic a second worst recession in history after the Great Recession.

24/10/20: America's Scariest Charts: Non-farm Payrolls

In the previous post, I covered data for the U.S. Labor Force Participation and Employment to Population Ratios (see https://trueeconomics.blogspot.com/2020/10/241020-us-labor-force-participation.html). Now, let's update the data for Total Nonfarm Payrolls through September:


At the end of September, total non-farm payrolls stood at 141,855,000 - up 1,137,000 on August, and still down 11,322,000 on pre-COVID19 peak. We are now just over half-way to the recovery from COVID19 trough of 130,317,000 reached in April 2020. Since reaching trough, non-farm payrolls rose, on average, at a monthly rate of 2,308,000, which means that the latest increase over the month of September has been substantially slower than the average rate of recovery. 

At September rate of jobs recovery, it will take us almost 10 months to regain pre-COVID19 peak. 

Current levels of payrolls are consistent with February 2016 levels, implying that even after we are still missing some 4.5 years worth of jobs creation. 

Here is a genuinely scary table, highlighting the fact that in the COVID19 pandemic, the U.S. sustained jobs losses of the combined magnitude equivalent to those suffered in all recessions from 1980 through the Great Recession:


And while the recovery is clearly under way, broader indicators of the jobs markets trends are still pointing to a horrific aftermath of the first of this pandemic, with the second wave now in full swing (see more on this here: https://trueeconomics.blogspot.com/2020/10/231020-covid19-update-us-vs-eu27.html


24/10/20: U.S. Labor Force Participation Rate is Falling, Again

One of thee major casualties of the COVID19 pandemic has been the U.S. labor market. However, with an allegedly robust recovery under way, we are seeing significant improvements across some metrics of labor markets health. In some, but not all.

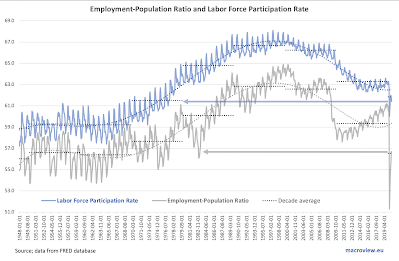
Take labor force participation rate:


Labor force participation rate is a critical metric for gauging employment conditions in the economy, because it reflects not only the availability of jobs in the market, but the perception amongst the workers of thee health of the market. Since the start of the pandemic, LFP rate fell to its 2020 low of 60.0 in April, before recovering to the pandemic period high of 62.0 in July. Since then, it trended down once again and in September fell to 61.4. 

Let's consider this for a second. During the Great Recession and the Global Financial Crisis, the lowest LFP rate reached was 63.8. In the Dot.Com recession, that number was 65.9. In the 1990s recession it was 65.5. For the entire decade of the 1980s, the lowest reading for LFP rate was 63.0. In fact, the only decade with lower LFP rate than current is the decade of the 1970s. February 1977 was the last time we saw LFP rate at the level below September 2020 reading.

Things are marginally better for another measure of labor markets health: the Employment to Population Ratio (EPR), which currently sits at 56.7, lower than any recession reading prior to the COVID19 pandemic since the first recession of the 1980s. March 1983 was the last time we saw this reading until the COVID19 hit.

Give it a thought, folks, a 'historical recovery' is the one where there are just 567 people working (part time or full time. minimum wage or living wage) per each 1,000 working age adults. Or, described differently, an economy where only 614 working age adults our of 1,000 are either in employment or confident enough of their prospects for finding a job to bother searching for one.

23/10/20: COVID19 Update: Nordics

My last update on Nordics vs Sweden comparatives was a month ago, although I did post some more recent data trends on Twitter since then. Here are the latest numbers:


New deaths counts are relatively benign, both in Sweden and (at a higher rate) in the rest of the Nordics. However, new daily counts in thee Nordics ex-Sweden are literally out of control as a new, and much larger wave of the pandemic sweeps EU27. 

Sweden entered the second wave of the pandemic with a delay, compared to other European states, so its numbers are still lagging those in other Nordic states. 

I commented on the often-heard argument in favour of Sweden's 'herd immunity' strategy earlier today and you can read it here, if you missed it (bottom of the post): https://trueeconomics.blogspot.com/2020/10/231020-covid19-update-countries-with.html

It appears, based on Sweden's (amongst others') experiences, that we really have very limited options in terms of public policy response to the pandemic. My five cents, based on multiple observations of experts' advice: we need 

  • Fully enforceable and strongly policed public distancing measures, 
  • Mandatory masks in all public places,
  • Restricted (though, probably, not banned) access to public commons and public places,
  • Effective and wide-spread free testing on demand, 
  • Aggressive tracing and strictly enforced quarantines,
  • Improved separation of COVID19 patients from all general health facilities (in order to ensure that normal health services provision is not impacted by the pandemic), and
  • Significant increase in spending on public health and education so both key sectors of the society can be opened safely and sustainably.
There has to be public and state-level zero-tolerance view toward anyone failing to comply with these measures.  

Anything short of these will result in stop-and-go swings of the pandemic and knee-jerk policy reactions with rolling shutdowns of the entire economies. 


23/10/20: COVID19 Update: Russia

Two weeks ago I pointed out the fact that Russian COVID19 numbers are going exponential as the pandemic clearly entered a new wave dynamic. This trend is still there and death counts are rapidly accelerating as well.


If the chart isn't clear enough, here are the numbers: 


This isn't a fluke, nor a product of increased testing, though the latter factor contributes to higher detection numbers, it should be pushing down deaths (earlier interventions should be consistent with better treatment options and outcomes). 

Around two weeks ago, Russia new cases went exponential. Now, there are signs of a similar dynamic in the already rising daily death counts.


23/10/20: COVID19 Update: Countries with > 100,000 cases

Some interesting updates to the league tables for countries with > 100,000. Since the last update, five more countries joined the rather sad club, including Sweden (more on this later), and there are now 47 countries around the world with more than 100,000 cases of the disease recorded. 

The tables below are organized as a heat map, with green cells reporting statistics that put a country in the 'better than average' category, while orange cells marking countries statistically worse than average:


  • The EU27 - ranked relative to the countries, though excluded from the national level statistics inputs - is ranked 17th worst in the table.
  • The U.S. is now jointly ranked 7th worst with the UK - a one point deterioration in performance for thee U.S. since the earlier update.
  • Sweden ranks 15th worst - poorer performance than the EU27, but not by much.
  • Globally, the worst impacted country is Peru, followed by Belgium and Bolivia (tied for the 2nd rank), Brazil (4th) and Chile (5th).
  • The U.S. accounts for 4.34% of the world population, but holds a steady 20% share of global cases and deaths.
  • The EU27 accounts for 5.92% of the world population, and holds 11% of world's cases and 14% of world's deaths.
  • BRIICS+ Turkey account for 46.5% of world's population, 39% of world's cases and 30% of world's deaths.
A note regarding Sweden: it is fashionable these days to advance an argument that Sweden has attained the imaginary 'herd immunity' and has avoided shutdown of the economy while successfully crushing the pandemic. The arguments are absolute dross (more on this in a separate post). Sweden ranks poorly when it comes to absolute numbers and it ranks poorer than the EU27 (even with Sweden included in the EU numbers). 
  • Sweden's infection rate is 25th highest in the world, which is basically identical to the EU's ranks of 26th. In actual numbers, Sweden's rate is only 1.68% higher than that of the EU27.
  • However, Sweden ranks 15th in the mortality rate per capita of population (575.95 per 1 million of population), where as thee EU27 ranks 19th (361.33 per 1 million of population). Actual rate in Sweden is 59.4% higher than in the EU27.
  • Sweden also ranks much worse than the EU27 in the COVID19 deaths per infection rate: Sweden is ranked 8th worst in the world, against the EU27 rank of 12th worst. Sweden has COVID19 mortality rate of 54.5 per 1,000 cases, the EU27 rate is 34.7. 
  • Sweden did not shut down its economy. But it is not doing better than all other economies that did. There are a total of 39 advanced economies in the world, including Sweden. In 2020-2021 growth outlook (cumulated forecast over 2 years), Sweden ranks 16th highest growth. Not exactly terribly, but not great either. 
  • In 2020-2021, based on IMF's October 2020 forecasts, Sweden's real GDP is expected to end 2021 at 98.59, relative to 100 for the end of 2019. Worse than Norway at 100.62, and Finland at 99.45 and Estonia at 99.07 and Denmark at 98.84, but better than the Netherlands at 98.43.
  • Hardly an impressive performance for a 'herd immunity' country that is in more recent weeks enjoying post-peak troughs.
More on Sweden vs Nordics in a separate post to come.

23/10/20: COVID19 Update: U.S. vs EU27

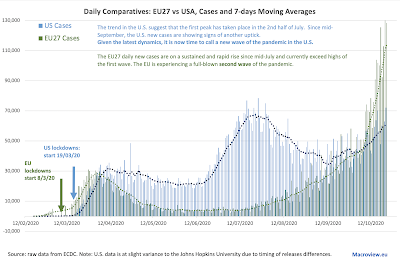
 Things are running out of control in the EU27 and remain out of control in the U.S. of A. Here are the latest daily numbers:


Overall:

  • The U.S. has a vastly higher death rate per 1 million population than the EU27 rate: 
    • Current death rate per 1 million of population in the U.S. is 681.7
    • Current death rate per 1 million of population in the EU27 is 361
    • Put differently, current U.S. death rate per capita is 89 percent above that for the EU27, although this gap is now slowly closing, down from 91% in the prior update
  • Overall counts of deaths in the U.S. are now above the EU27, since July 12
    • Current excess gap is at +67,397. Adjusted for population and pandemic timing differences, the gap is 114,621
  • The EU27 are now experiencing a second wave of infections. As the result, over October to-date, EU27 new case numbers have surpassed the U.S. in all but 2 days and deaths on 7 occasions


Monthly averages tell the story:
  • In the U.S. pandemic continues to rage and re-accelerating from August-September slowdown. Deaths are lagging, but still running at elevated levels and are more recently rising once again.
  • In the EU27, the pandemic is back with more than a vengeance: daily new cases counts are vastly above anything we have seen in the first wave. Death counts are lagging behind the prior peak, but a re massively above June-September numbers and climbing up.
Shorter-term averages confirm the above analysis:

These dire numbers come on top of already substantial levels of past infections, especially in the U.S., with improved testing and tracing, with improved treatments of cases, with better surveillance and controls in the places of higher concentration of more vulnerable population groups and with all the lessons allegedly learned from the first wave of the pandemic. The fact that we are seeing the massive second wave emerging in Europe and re-acceleration of the trend in the U.S. clearly shows that we have no control over the pandemic.

Expect things to get worse. Much worse. The U.S. is now forecasting 500,000 deaths by the end of 2021. The EU27 has no forecasts, but I will not be surprised if the EU27 pandemic development catches up with that in the U.S. These risks are especially salient in the light of widespread denial and fatigue sweeping both populations when it comes to any serious public health responses to the crisis. 


Friday, October 23, 2020

23/10/20: COVID19 Update: Worldwide Cases and Deaths


The global pandemic is accelerating, not abating:


New cases numbers have set all-time records in the last two days, and daily counts ranked in top 10 in the last 10 days on eight occasions, with the balance two occasions coming in ranked 13th and 15th, respectively. Despite the rising public complacency and fatigue to the pandemic numbers, globally, we are yet to attain the first peak of the pandemic, suggesting that when this does happen, we are likely to be set for an even worse second wave of infections.

Overall, 7-days average for new infections is at a jaw-dropping 390,097, more than 3 times the historical median and up on the 30-days average of 333,024 cases per day. 

In deaths counts, things are not looking great either.


Globally, new daily deaths counts peaked back in April 2020. This peak was generated by severe lags in reporting past deaths and changes in methodologies for reporting deaths, primarily in Europe, as the world developed statistical tools for tracking deaths and accounting for them. Since then, the more accurate peak took place around the first half of August.

In the months since August local peak, we have seen virtually no meaningful moderation in deaths counts. Current 7 days average of new daily deaths is 5,616 per day, slightly up on the 30 days average of 5,573 - a rather discouraging sign, given rapid improvements in treatments availability and a marked shift of the infections toward younger cohorts of population. Mortality rates per confirmed case are more subdued today, of course, but this is hardly a reflection on any changes in the underlying severity of the diseases, and more likely reflects improved and earlier detections and improved quality of interventions. Interestingly, the new evidence from the second wave sweeping across Europe suggests longer lags between new cases detections and increase in hospitalisations. Despite this lag, however, it now appears that hospitalisations are once again on a rise in the EU27.

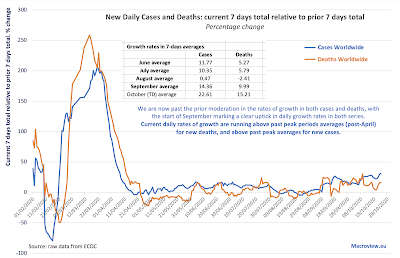
Growth rates in new cases and deaths are alarming:

Both, growth rates in new cases and in daily reported deaths are now significantly in excess of anything observed since the flattening out of the growth curve starting with mid-May. October rates of deaths and cases are substantially ahead of September rates, indicating that the pandemic is accelerating, not abating.

Thursday, October 22, 2020

21/10/20: Pollution Shifting and Heterogeneity in Local Regulatory Coverage


States, like California within the U.S., and some individual member states within the European Union tend to adopt own-level regulations on harmful emissions in an effort to 'pave the way' for other peer states. These regulations, of course, only apply to the economic agents 'captive' in the state. They do not apply to more mobile companies that can shift their emissions across borders to minimize the impact of more stringent regulations. Even Federal-level standards on pollution abatement are often subject to local applicability variations, resulting in pollution shifting across states' borders in line with the above.

A recent study by Feli Soliman, titled "Intrafirm Leakage" published by CESifo as a Working Paper No. 8619 (https://ssrn.com/abstract=3712780) provides some empirical evidence of exactly such pollution shifting. The study finds that "...multiplant firms partially regulated under the ozone regulations of the US Clean Air Act offset regulation-induced reductions among regulated plants with spillovers to unregulated plants and by moving plants out of regulated areas." Crucially, however, the offsetting decisions are  more than sufficient to render overall pollution output un-impacted by the more stringent local regulations:  "Taken together, these leakage effects fully offset emissions reductions at regulated plants."

Another interesting finding in the study is that thee effects of this pollution shifting "are strongest among highly productive firms and those operating in tradable industries." In other words, the companies that hold prospect for future growth (and expansion of their pollution output) and have higher likelihood of survival are the very same firms that gain from pollution arbitrage across borders.

Overall, the author concludes that "By themselves, these results imply that expanded ozone regulation under the [Clean Air Act] has not contributed to the clean-up of US manufacturing"

Saturday, October 17, 2020

17/10/20: COVID19 Update: Russia


Russian pandemic numbers are getting seriously out of control, once again, and this outrun was pretty much predictable based on early eit from serious restrictions.


Russia managed to lower, but not crush, pandemic pressures between the first wave peak of the second week of May 2020 and the start of July. By mid-August, both new cases and daily deaths counts fell to their post-peak lows. However, starting with September, the pandemic evolved into a second wave, with exponential increase in new cases through today, and deaths following the same trend path.

Here is a summary table of the second wave dynamics:


And here are Russia comparatives in comparison to some of the peers in the table of countries with more than 100,000 cases:

At current rates of new cases arrivals, Russia will still be able to cope with the pandemic from the public health system capacity perspective, but absent strict lockdowns, the new wave is likely to continue expanding. Upcoming winter weather is likely to keep the acceleration pressures on the new cases and with this, Russian hospitals capacity could be severely tested comes mid- to late-November.