Showing posts with label employment #population ratio. Show all posts

Friday, April 2, 2021

2/4/21: U.S. labor force participation and employment to population ratio


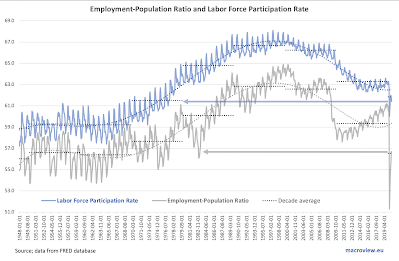
In the previous post, I covered U.S. continued unemployment claims: https://trueeconomics.blogspot.com/2021/04/2421-us-continued-unemployment-claims.html, noting that decreases in unemployment counts are, in part, driven by workers dropping off unemployment rolls due to exits from the workforce and/or expirations of unemployment benefits. Here is the data on U.S. labor force participation rates and employment to population ratio through March 2021:


Things are still ugly when it comes to these two measures of labor markets health in the U.S: 

  • Latest reading for U.S. labor force participation rate at 61.5 is just a notch up on February's 61.3, but is unchanged on November 2020. Pandemic period average labor force participation rate is woefully low at 61.7, which is still higher than March 2021 reading. March reading is equivalent to the average reading for the decade of the 1970s which was marked by stagflation and high unemployment.
  • Latest reading for U.S. employment to population ratio is at 57.7 - an improvement on February reading of 57.3, and better than the pandemic period average of 56.9, but still comparable to the levels seen only in the early 1980s. 
Both metrics show the brutal nature of the current labor markets, where demand for skills is rising, including in manufacturing, while services jobs (and lower-skilled B2C services jobs in particular) are still hard to find.

Thursday, February 4, 2021

4/2/21: U.S. Labor Markets: America's Scariest Charts, Part 2

In the previous post, I covered the first set of data - Continued Unemployment Claims (https://trueeconomics.blogspot.com/2021/02/4221-us-labor-markets-americas-scariest.html) - that highlights the plight of American economy in the current crisis. Now, let's take a look at Labor Force Participation rate and Employment to Population ratio:


The chart and the table above highlight continued serious problems in the structure of the U.S. labor markets. While official continued unemployment claims are inching back toward some sort of a 'norm', much of so-called improvement in unemployment dynamics is actually accounted for by the dire state of labor force participation which is still trending below anything one might consider reasonable. Current labor force participation rate is 61.5 which is well below anything seen before the onset of the pandemic in March 2020. By a mile below. And in terms of historical perspectives, we have no modern recession (from 1980 onwards) that matches these lows of labor force participation. Structurally, this means that instead of gaining jobs, the unemployed simply roll off the cliff of unemployment assistance and drop out of the labor force, discouraged by the lack of meaningful decent jobs in the market. 

Employment to population ratio is a little better, but it is still stuck below pre-pandemic levels and is low compared to prior recessions' troughs. 

The conditions in the U.S. labor markets might be improving somewhat off the pandemic lows, but the situation overall remains dire. 


Saturday, October 24, 2020

24/10/20: U.S. Labor Force Participation Rate is Falling, Again

One of thee major casualties of the COVID19 pandemic has been the U.S. labor market. However, with an allegedly robust recovery under way, we are seeing significant improvements across some metrics of labor markets health. In some, but not all.

Take labor force participation rate:


Labor force participation rate is a critical metric for gauging employment conditions in the economy, because it reflects not only the availability of jobs in the market, but the perception amongst the workers of thee health of the market. Since the start of the pandemic, LFP rate fell to its 2020 low of 60.0 in April, before recovering to the pandemic period high of 62.0 in July. Since then, it trended down once again and in September fell to 61.4. 

Let's consider this for a second. During the Great Recession and the Global Financial Crisis, the lowest LFP rate reached was 63.8. In the Dot.Com recession, that number was 65.9. In the 1990s recession it was 65.5. For the entire decade of the 1980s, the lowest reading for LFP rate was 63.0. In fact, the only decade with lower LFP rate than current is the decade of the 1970s. February 1977 was the last time we saw LFP rate at the level below September 2020 reading.

Things are marginally better for another measure of labor markets health: the Employment to Population Ratio (EPR), which currently sits at 56.7, lower than any recession reading prior to the COVID19 pandemic since the first recession of the 1980s. March 1983 was the last time we saw this reading until the COVID19 hit.

Give it a thought, folks, a 'historical recovery' is the one where there are just 567 people working (part time or full time. minimum wage or living wage) per each 1,000 working age adults. Or, described differently, an economy where only 614 working age adults our of 1,000 are either in employment or confident enough of their prospects for finding a job to bother searching for one.