Wednesday, October 14, 2020

14/10/20: BRIC: Composite economic activity indicators Q3 results


We covered in detail strong recovery in BRIC Manufacturing PMIs (https://trueeconomics.blogspot.com/2020/10/141020-bric-manufacturing-pmis-q3.html) and fragile recovery in Services PMIs (https://trueeconomics.blogspot.com/2020/10/141020-bric-services-pmis-q3-results.html). Here is a summary chart:


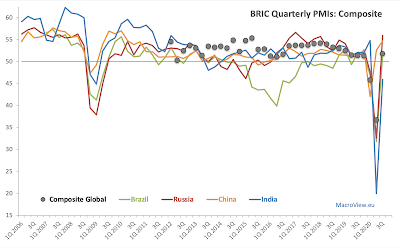
Now, let's take a look at BRIC Composite PMIs for 3Q 2020:

Brazil Composite PMI ended Q3 2020 on a reading of 51.6 - an improvement on 31.8 in 2Q 2020. Brazil's Composite PMIs have run sub-50 recessionary reading in 1Q and 2Q 2020, returning to growth in 3Q 2020, albeit at the levels not consistent with a V-shaped recovery.

Russia Composite PMI stood at a strong 55.9 reading in 3Q 2020, up on 32.6 in 2Q 2020 and signaling an end to 2 consecutive quarters of sub-50 readings. This marks the fastest pace of growth since 1Q 2017, but is also consistent with the levels of current activity being still below pre-COVID19 pandemic period. 

India Composite PMI remained in recessionary territory in 3Q 2020 at 45.9, an improvement on 19.9 in 2Q 2020. Overall, Indian economy has suffered the sharpest hit from the pandemic, compared to all other BRICs. It is continuing to exhibit recessionary dynamics to-date. 

China Composite PMI ended 3Q 2020 at 54.7, marking the second consecutive quarter of recover (2Q 2020 reading was 52.6). 3Q 2020 reading is the highest since 1Q 2020, and suggests that the Chinese economy is getting close to recovery in its activity levels to pre-pandemic position. 

Overall, BRIC block activity indices imply lagging momentum in the recovery in services, and faster than global pace of recovery in manufacturing. Statistically, BRIC growth momentum in 3Q 2020 is within historical average, however, growth dynamics in 1Q and 2Q 2020 were significantly below historical averages, which implies that 3Q 2020 PMIs indicate incomplete or only partial recovery in the BRIC economies post-pandemic so far.


14/10/20: BRIC: Services PMIs Q3 results


BRIC Manufacturing has rebounded strongly from thee pandemic lows, as covered in this post here: https://trueeconomics.blogspot.com/2020/10/141020-bric-manufacturing-pmis-q3.html. Services PMI for the BRIC economies signal similar, albeit weaker rebound in July-September:


Brazil Services PMI stayed in the recession territory in 3Q 2020, with index reading coming in at 47.5, up on 30.3 in 2Q 2020, but still marking a third consecutive quarter of sub-50 readings. Put simply, unlike manufacturing that is showing rather incredible signs of the recovery, Brazil's services sectors continue to show ongoing contraction, building on 6 consecutive months of contracting activity through August 2020. September monthly reading at 50.4 is statistically indistinguishable from zero growth line of 50.0. In summary, Brazil's services sector is not in a recovery so far.

Russia Services PMI posted very strong recovery signals in 3Q 2020, although September reading slipped to 53.7 (fast growth) from blistering 58.5 and 58.2 in July and August, respectively. 3Q 2020 Russia Services PMI was at 56.8 marking a sharp turnaround from 36.0 in 2Q 2020. This is the fastest pace of quarterly expansion since 1Q 2017.

India Services PMI remains in contraction, with 3Q 2020 reading of 41.9, an improvement on sharper rates of deterioration in 2Q 2020 at 17.2. September marked seventh consecutive month of sub-50 readings in Services sector in India.

China Services PMI came in at 54.3 in 3Q 2020, up on 52.6 in 2Q 2020, marking second consecutive quarter of recovery from the pandemic lows of 1Q 2020 when the index fell to 40.4. 

Overall, BRIC Services Activity Index - an index compiled by me based on GDP shares and Markit monthly PMI data - rose from 40.4 in 2Q 2020 to 51.0 in 3Q 2020. Given the nature of PMIs as signals of monthly changes in activity, 3Q 2020 reading is consistent with the BRIC block services sectors recovering only partially from the pandemic lows. BRIC Services Activity Index ended 3Q 2020 at the levels slightly below the Global Services PMI which stood at 51.4. Global services sectors are also showing more rapid rate of quarterly recovery, rising from 35.6 in 2Q 2020 to 51.4 in 3Q 2020.


14/10/20: BRIC: Manufacturing PMIs Q3 results


BRIC - Brazil, Russia, India and China - economies have posted a significant improvement in Q3 Purchasing Managers Indices in Manufacturing sector:


Brazil Manufacturing PMI rose to 62.6 - the highest on record in 3Q 2020 following 42.0 recessionary reading in 2Q 2020. This is a massive rebound from pandemic lows, and the level of 3Q reading puts into question validity or accuracy of the surveys. On a monthly basis, the index was at 64.7 and 64.9 in August and September. Brazil's manufacturing index was at sub-50 readings in March-May 2020, with a reasonably credible rebound in June and July. August and September readings are literally out of the ball park, both in terms of historical comparatives and in terms of past turning points from recessions to expansions. 

Russia Manufacturing PMI treaded water in 3Q 2020, swinging from 48.4 in July to 51.1 in August and back to 48.9 in September. As the result, Russia posted sub-50 reading for 3Q 2020 at 49.5, the only BRIC economy in this position. This marks 5th consecutive quarter of sub-50 PMIs. Statistically,  the last time Russian manufacturing was in the expansion territory was in 1Q 2019. 

India Manufacturing PMI rose strongly in Q3 2020 to 51.6, well above 35.1 recession trough in Q2 2020. However, statistically, current reading signals relatively weak recovery. September monthly index came in at more robust 56.8, suggesting that the economy may be gathering some momentum and recovery may be accelerating. 

China Manufacturing PMI was basically unchanged at 53.0 in September compared with 53.1 in August. 3Q 2020 PMI is at 53.0, which is an improvement on statistically zero growth reading of 50.4 in 2Q 2020. China's Manufacturing PMI numbers are historically less volatile, so 53.0 marks the fastest pace of expansion since 4Q 2010.

Overall, GDP-weighted BRIC Manufacturing Activity Index stood at 53.0 in 3Q 2020, above the Global Manufacturing Index (51.6) and up on 45.0 in 2Q 2020.

Monday, October 12, 2020

12/10/20: Ireland PMIs and Economic Activity Dynamics for September


September data on Irish Purchasing Managers Indices is now complete (with Construction sector reporting last), and the signals coming from the data are not pretty:


Services sector activity is back in contraction: September reading of 45.8 shows relatively sharp downward momentum, swinging 6.6 points on August reading. September reading is statistically below 50.0 zero growth line, and below historical mean (55.0).

Manufacturing sector reading is at stagnation 50.0 in September, down from 52.3 in August. Statistically, September reading is below historical average of 51.4.

Construction sector is posting a second consecutive month of contraction at 47.0 in September. The reading is statistically below both the historical mean and the median, as well as below 50.0 zero growth line.

This means that official composite PMI (which does not include Construction sector index) is now at 46.9, statistically signalling economic contraction. September index is statistically below index median, although it is statistically indistinguishable for the historical average (which, owing to massive volatility in recent months sits at 49.8).


Chart above shows my own 3-Sectors Index of economic activity, integrating Manufacturing, Services and Construction sectors PMIs, weighted by their relative contributions to Gross Value Added. 3 Sectors Index has fallen from 52.1 in August to 47.5 in September. August reading by itself was not impressive: it was statistically below the historical average and the median, and was barely statistically significantly above 50.0 zero growth line. September reading is very poor, indicating a return of recessionary dynamics in the Irish economy in a critical month of September that normally marks strong growth month for the economy.


Thursday, October 8, 2020

8/10/20: COVID19 Update: Russia

 Russia is now in a full-blown second wave of the pandemic:

  • 14-days MA of deaths has risen since the lows of ca 100/day to current levels of ca 140/day.
  • Stripping out some volatility induced by the timings of reports, deaths are on a rising trend signalling the onset of the second wave of the pandemic around the first week of September.
  • Overall, Russia is now experiencing the second wave of COVID19 that started around the last week of August (in terms of new cases numbers).

Russia recorded an average of 9,474 new cases per day in the last 7 days, up on 7,140 in the prior seven days period. In attributed daily deaths, current 7-days average is 156 against prior 7-days average of 128.

Here are peer comparatives:


8/10/20: COVID19 Update: U.S. vs EU27

 Updating data on pandemic development through 07/10/2020 for the U.S. and EU27:

  • The EU27 are now experiencing a second wave of infections, while the U.S. new infections rate has moderated off the prior peaks, although moderation is relatively weak and daily cases are highly volatile.
  • As the result, in the last 10 days, EU27 new case numbers have surpassed the U.S. on 4 occasions and deaths on 2 occasions. Over the last 30 days, numbers of new cases in the EU27 exceeded those in the U.S. over 9 days, while numbers of daily deaths were higher in the EU27 on four occasions.
Daily averages for each month of the pandemic are summarized in the table below, while daily counts with 7 days average are shown in the charts:


  • The U.S. has a vastly higher death rate per 1 million population than the EU27 rate: current death rate per 1 million of population in the U.S. is 642.5; and current death rate per 1 million of population in the EU27 is 335.2
  • Put differently, current U.S. death rate per capita is 92 percent above that for the EU27.
  • Overall counts of deaths in the U.S. remain above the EU27, since July 12. Current excess gap is at +62,928.
  • Adjusted for population differences, the U.S. has 100,517 more deaths than the EU27. Adjusted for later onset of the pandemic in the U.S., America's death toll from COVID19 to-date is 114,621 higher than that of the EU27.
  • The 7-day moving averages of new cases in the EU27 and the U.S. are now almost identical. The EU27 is already in the second wave of the pandemic, but the U.S. is showing signs of the second wave starting, with a significant uptick in the 7-days average since September 12 lows.
  • Both, the EU27 and the U.S. deaths counts are now running above the levels at which Winter 2020 lockdowns were imposed.
Meanwhile, American leadership is switching to a new strategy in addressing COVID19, called 'Don't Panic: Get Yerself Covided! Suckers!' https://twitter.com/i/status/1313267615083761665. Which totally makes sense for more than 70 million Americans who cannot afford COVID19 treatment without filing for bankruptcy, and another 30-40 million Americans who cannot medically handle COVID19 because of existing conditions. 

Wednesday, October 7, 2020

7/10/20: COVID19 Update: Countries with > 100,000 cases


Updating tables for the countries with more than 100,000 cases of COVID19:


  • There are now 40 countries with >100,000 cases and 12 countries with > 500,000 cases. 
  • The U.S. continues to lead the world in the number of cases and number of deaths: the country accounts for 4.3 percent of world population, 21% of diagnosed COVID19 cases and 20% of attributed deaths.
  • EU27 accounts for 5.9% of the world's population, 7% of all cases, but 14% of world's deaths.
  • BRIICS+Turkey account for 46.5% of world's population, 40% of world's cases and 30% of attributed deaths.
  • 8 of the EU27 countries are on the list of countries with > 100,000 cases.
  • In overall performance rankings, the U.S. is ranked within the group of 'worse-than-average performers' (8th worst in the group of 40), while the EU27 ranks within-average (18th worst performer, if it were a country), the UK ranks 9th worst performer, with Peru remaining the hardest hit country of all countries with > 100,000 cases, with Bolivia second and Belgium third.

7/10/20: COVID19 Update: Worldwide Cases and Deaths


Updating new data for COVID19 new cases and deaths through October 7, 2020 (ECDC data timeline):

Globally, we remain in the first wave of the pandemic both in terms of new cases arrivals and death counts:


What the numbers above are telling us:
  • New cases arrivals trend at 298,196 per day over the last 7 days, albeit with increasing daily volatility due to a number of countries with large case numbers switching to less regular reporting of cases in recent weeks. The daily average for the last 7 days is in excess of the 30-days average of 286,123 and well above the historical average of 130,960. In terms of new cases, therefore, we are still in the first wave of the pandemic, and now past the first period of moderation in the infections spread that took place from, roughly during August.
  • Daily deaths counts are currently at 5,399 for the last 7 days, which is lower than the 30-days average of 5,642, but still well above the historical average of 3,848. Some observers have noted in recent weeks that the deaths curve is down somewhat on the local peak attained around the first week of August. The decline, however, is very shallow and is driven not only by the improved treatment and detection, but also by the changing demographic of new cases (younger and healthier patients becoming impacted). There is, most likely, a residual issue of changes in geographies of new cases, that also impacts reporting and assignment of deaths. In simple terms, core data shows no encouraging trends so far in terms of daily deaths counts: the pandemic's Wave 1 continues. 
The above analysis is reflected in the growth rates. Stripping out some daily volatility, here are 7-day rolling average changes in both deaths and new cases:


The worrying trend in both series shown above is: 
  • We are now past the prior moderation in the rates of growth in both cases and deaths, with the start of September marking a clear uptick in daily growth rates in both series.
  • Current daily rates of growth are running in line with past peak periods averages (post-April) for new deaths, and above past peak averages for new cases.
  • October (to-date) growth rates in both series are not only double-digits high, but are well above June-August averages and historical averages. They are also stronger than September averages. Tables below summarise these facts:


I will update other data sets on COVID19 pandemic evolution in subsequent posts, but the global trends clearly show that we are in a continued state of global pandemic still raging unabated.

Note: for those keen on looking at more recent changes, see my prior post on the same subject here: https://trueeconomics.blogspot.com/2020/09/25920-covid19-update-worldwide-cases.html


Sunday, October 4, 2020

4/10/20: Technological Deepening Is Coming for Our Jobs


In my recent article for The Currency (link here: https://trueeconomics.blogspot.com/2020/09/my-recent-article-on-potential-long.html), I argued that COVID19 will act as an accelerator of technological capital deepening in the modern economies, with a resulting faster displacement of workers (including highly skilled ones) by technology. 

McKinsey survey of the developing trends in businesses strategic responses to the pandemic confirms my hypothesis:


Per above, across all sectors, and (peer charts below) across specific sectors, businesses are planning to prioritize deployment of technology in addressing long-term change in response to the current pandemic. 


McKinsey state that "Fifty-five percent of leaders anticipate that at least half of their organization’s workforce will be fully or partially remote postcrisis. While the expectations vary widely by industry—from 69 percent predicting this level of remote work in technology, telecommunications, and media to 43 percent in advanced industries—even in the industries where manufacturing, patient care, and sales transactions often require people at offices, stores, plants, and other company facilities, a significant portion of the workforce may be partially or fully remote." Source: https://www.mckinsey.com/business-functions/organization/our-insights/the-need-for-speed-in-the-post-covid-19-era-and-how-to-achieve-it. And "Our survey results show that executives are focused on three courses of action ... making good decisions more quickly, improving communication and collaboration, and making greater use of technology."


Saturday, October 3, 2020

3/10/20: Identity & Risk: Financial Services in a Time of Transformation & Uncertainty


Delighted to announce that I will bee keynoting October 22 conference Identity & Risk: Financial Services in a Time of Transformation & Uncertainty.

Details here: https://www.ptools.com/draft/conference-home-page/2020-annual-global-virtual-conference.html.


3/10/20: Eurocoin Leading Growth Indicator 3Q 2020


Eurocoin, a leading growth indicator for the euro area published by CEPR and Banca d'Italia posted another negative (recessionary) reading in September (-0.31) after marking peak growth contraction of COVID19 pandemic period in August (-0.64). This puts Eurocoin in negative territory for the 6th consecutive month since March 2020. 


Current forecast for 3Q 2020 growth remains at -3.5 percent q/q. Deflationary pressures are also building up. Euro area's 12 months average HICP forecast for 3Q 2020 stands at around 0.6 to 0.5.


As the chart above shows, Eurozone remains deeply in a recessionary territory based on Eurocoin forecasts and inflation dynamics. Longer term growth averages are shown in the chart below:


Overall, as noted above, one must take all leading indicators and forecasts with some serious warnings attached: we are in an environment where past models for forecasting economic aggregates become severely challenged.


3/10/20: BRIC: Manufacturing PMIs Q3 2020


Based on July-September data, here are the main takeaways from the BRIC Manufacturing Sector PMIs for 3Q 2020:


  • Brazil Manufacturing PMIs gained serious speed in 3Q 2020 compared to 2Q 2020, rising from a recessionary reading of 42.0 in April-June to signal rapid recovery at 62.6 over the last three months through September. This marks the highest quarterly reading on record for the country Manufacturing sector. Dynamically, growth accelerated in every month since the start of the sector recovery in June 2020.
  • Russia Manufacturing PMI came in at a disappointing and contractionary 49.5 in 3Q 2020, marking the fifth consecutive quarter of sub-50 readings, although still an improvement on the pandemic period low of 39.0 set in 2Q 2020. Adding pressure to the already poor performance, monthly PMI reading slumped from a relatively weak recovery signalled by PMI at 51.1 in August to a recessionary reading of 48.9 in September. 
  • India Manufacturing PMI rose from 52.0 in August to 56.8 in September, with 3Q 2020 reading at 51.6 - a substantial but likely incomplete recovery on the pandemic low of 35.1 set in 2Q 2020.
  • China Manufacturing PMI rose from 2Q 2020 reading of 50.4 to 3Q 2020 reading of 53.0, implying almost a full recovery in the manufacturing sector on 1Q 2020 pandemic period trough of 47.2. September marked a fifth consecutive month of PMI readings above 50.0. 
Overall, BRIC weighted Manufacturing Activity Index (based on monthly PMIs) stood at 53.0 in 3Q 2020, up on 45.0 in 2Q 2020 and 49.1 in 1Q 2020. Current reading signals the fastest q/q growth in the sector since 1Q 2011. The ongoing recovery across the BRIC economies is faster than Global Manufacturing PMI recovery (at 51.6), albeit highly uneven and somewhat suspicious. The core driver for this growth is Brazil, where manufacturing data dynamics is completely out of touch with services data dynamics and looks extremely unreliable.