Tuesday, July 2, 2013

2/7/2013: EU Youth Unemployment: Promises of Urgency Urgently Promised


After much hoopla about the need to do something about youth unemployment, the EU leaders have managed to produce a strategy to do something about youth unemployment. As strategies go, this one is about as likely to deliver on the objectives (which remain undefined in any real tangible sense) as all other EU strategies. But, the good news is, the EU has managed to agree the strategy with the social partners.

So here;s the link to the EU's "comprehensive approach to combat youth unemployment": http://consilium.europa.eu/uedocs/cms_data/docs/pressdata/en/ec/137634.pdf.

The promise is to "speed up implementation of the “Youth Employment Initiative”, which should be fully operational by January 2014, and concentrate spending in its first two years". Now, wait a second, the EU already has a strategy to combat youth unemployment? Yes, it does. And the new over-hyped 'initiative' is to… speed up the old overhyped initiative that worked marvellously so far. Yes, it is.

And there is more: the EU "will also speed up implementation of the “Youth Guarantee”, which is designed to get young people who are not in education, employment or training back to work or into education or training within four months". So again, speeding up the past well-working initiatives is apparently makes for a new initiative, which, of course, will be even better working.

"In addition, unspent funds from the EU budget will be reallocated to support employment, especially for youth, as well as innovation and research. This is made possible by the flexibility of the EU budget, or Multi-annual Financial Framework, for the next seven years." What that? Ah, that will be EUR6 billion that the EU now plans to spend over 2 years to… yes… right… combat youth unemployment.

Perspective: in May 2013, 5.525 million young persons (under 25) were unemployed in the EU27, of whom 3.555 million were in the euro area. So that works out at EUR543 per unemployed youth. Overwhelmingly bold move by Europe, then, to combat the crisis…

Perspective: 26.522 million men and women in the EU27, of whom 19.340 million were in the euro area, were unemployed in May 2013. The other urgent crisis the EU faces, the banking crisis, has cost so far some EUR740bn (http://trueeconomics.blogspot.ie/2013/04/2342013-updating-cost-of-banking-crisis.html) and that runs at around EUR27,901 per each unemployed (not just youth unemployed) in EU27. Let us assume that these net liabilities are at least partially recoverable (you know, those AIB shares are worth something, and the bad loans in bad banks are not all completely and totally bad), so let's say the figure is more like EUR13,900 per unemployed.

Perspectives 1 & 2 imply the relative urgency in the EU strategic responses to the crises as follows (higher number = higher priority): Banks : Unemployed at 12:1.

With that in mind, recall that the "European Council also agreed on measures to promote cross-border mobility, including for vocational training. The “Your First EURES Job” programme will be strengthened and the “Erasmus +” programme should be fully operational from January 2014. High-quality apprenticeships will be promoted via the European Alliance for Apprenticeships to be launched in July." Sounds good? Of course it does, because one might think the programme is going to result in inefficient apprenticeships systems in countries like Portugal or Ireland becoming Swedish-styled or Austrian-styled super-efficient? Not really. This is more about Apprenticeship Programmes Administrators talking to their colleagues at more junkets. So chop down that EUR543 per young unemployed dish-out by few bob to cover the cost of 'cross-border mobility' of junkets.

But do read the document the EU produced, as linked above. it contains real pearls, like the following:

Paragraph 1.1: "All efforts must be mobilised around the shared objective of getting young people who are not in education, employment or training back to work or into education or training within four months, as set out in the Council's recommendation on the "Youth Guarantee". Building on the Commission's communication on youth employment, determined and immediate action is required at both national and EU level."

So basically - no idea what to do here. The Eu leaders admit as much by offering not a single programme solution, but stressing instead that something (anything? whatever?) must be done and that solutions must be 'determined and action is required'.

Overwhelmed yet?

Monday, July 1, 2013

1/7/2013: Summary of education systems stats for Ireland, 2013

Interesting numbers on education system in Ireland, compared to OECD and EU21: http://ec.europa.eu/ireland/press_office/news_of_the_day/pdf_files/2013/ireland_eag2013-country-note.pdf

Summary tables are very informative.

The full OECD publication is available here: http://www.oecd-ilibrary.org/education/education-at-a-glance_19991487

Here's an interesting chart from the publication (click to enlarge):
Basic point - once we exclude international students, Ireland is basically indistinguishable from the OECD average on terms of tertiary education attainment.

Furthermore, with international students counted in, 1.9% is the Irish graduation rate for Advanced Research Degrees (PhDs) which ranks us 12th in the OECD. Removing international students, the rate is 1.6% or 9th.

Another note: Ireland does not report on the proportion of students who enter the third level education and graduate, so we cannot tell how bad is the propensity of Irish system to graduate students once they are into the system. Ireland also does not report completion rates in third and higher levels of education.

In 2011, Ireland had the fifth highest unemployment rate for those with at least tertiary education completion, the third highest rate for those with Upper secondary or post-secondary non-tertiary education and the sixth highest for those below upper secondary education in the OECD.

Employment rate in Ireland for those with Type A and advanced research programmes tertiary education completion stood at 83%, which ranked as 22nd in the OECD. Put differently, that 'best educated' workforce in Ireland was, apparently, one of the least employed.

A caveat to all reading both documents: there are no corrections in the data for foreign workers employed in the country of residence. Which, of course, means that high salaries in ICT services and International Finance, earned by foreign employees working in Ireland are potentially skewing the data on returns to education

1/7/2013: Good Numbers on Trips to Ireland: January-May 2013


Good numbers on trips to Ireland from abroad for January-May 2013:

March-May (3mo) y/y rises were:

  • Trips to Ireland from Great Britain + 5.6% (below the overall rate of rise of 8.1%);
  • Trips to Ireland from Other Europe + 9.6% (above the overall rate of increase);
  • Trips to Ireland from North America + 12.6% (substantially above the overall rate of increase); and
  • Trips to Ireland from Other Areas + 3.2% (well below the overall rate of increase)
January-May (5mo) y/y rises were:

  • Trips to Ireland from Great Britain + 2.8% (below the overall rate of rise of 6.4%);
  • Trips to Ireland from Other Europe + 8.5% (above the overall rate of increase);
  • Trips to Ireland from North America + 12.8% (substantially above the overall rate of increase); and
  • Trips to Ireland from Other Areas + 4.9% (below the overall rate of increase)

1/7/2013: Irish Manufacturing PMI: June 2013


Irish Manufacturing PMI is out today and I can't really report much on the subject - the Investec - Markit continue to put out qualitative analysis in place of what used to be very informative press releases.

The PMI data is seasonally adjusted, which makes y/y comparatives slightly questionable, while normal volatility makes m/m comparatives pretty much meaningless. Note: despite the seasonal adjustment data remains Laplace-distributed. In the past, it was possible to make some educated guesses as to the underlying drivers of the PMI by looking at trends in components. Now - it is impossible.

But ok, let's deal with the headline PMI alone.

The headline PMI reading is not as ugly in June as it was in March and April (PMI average at 48.3), but not pretty either.

We have a statistically insignificant rise in the overall index reading of 0.6 points (bi-directional standard deviation for this data is at 4.37 for full sample, 4.28 since 2000 and 5.21 since 2008).

The increase brings us notionally above 50 to 50.3, for the first time since February 2013, but
1) This is not a reading that is statistically significantly different from 50.0 (STDEV is at 2.19 for difference from 50 and the skew is -1.46, so 0.3 is not significant)
2) Current reading still remains consistent with negative trend set on around 12 months ago. Next 1-2 months will be critical in either confirming the trend or potentially signalling an inflection point. Then again, next 1-2 months will be peak of summer, and will be unlikely to tell us much.
3) 50.3 reading in June is identical to January 2013 and is below 12mo MA of 50.9, and is about identical to the 3mo average through March 2013 at 50.1. 3mo average reading through June is below 3mo averages through June in every year 2010, 2011, 2012.

Core conclusion: output did not, in any normal statistical likelihood, return to growth yet, although PMI reading did come to around 50 from the upside (50.3)… it was also around 50 back in May (49.7) but on the downside.

Per Investec, there was "a further reduction in new orders, although the latest decrease was only fractional, and the slowest in the current four-month period of decline. New export orders, meanwhile, fell at a faster pace than in May." We, of course, have no idea just how far these reductions have taken the two sub-indices, because Investec and Markit are no longer giving us actual sub-index readings.

Charts on dynamics:


Saturday, June 29, 2013

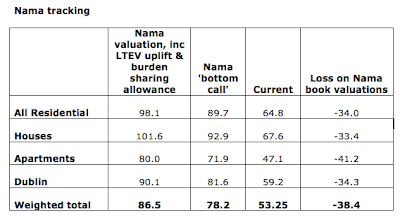
29/6/2013: Nama valuations update to May 2013

In the previous post I looked at the latest prices trends in Irish property markets. Now, as promised, an update on Nama valuations.

Note: these numbers are indicative, rather than exact estimates.


29/6/2013: Irish Residential Property Prices: May 2013


This week, CSO released Residential Property Price Index (RPPI) for May. Here's the update on trends and changes. Nama valuations update will be posted in a follow-up post.

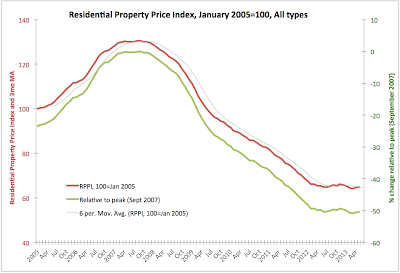
Per CSO data, All properties RPPI rose marginally from 64.6 in April to 64.8 in May, 2013. The index is now in the range of 64.1-64.8 for four months in a row, suggesting no change to the overall flat trend at around 65.2. The flat is now running from February 2012, and we are currently below the trendline by about 0.6%.

Year on year, index is down 1.07% and in April it was down 1.22%. Over the last 3 months, All-RPPI rose 0.62% cumulatively, which reverses 1.22% loss on 3mo through April 2013. On 6mo basis, cumulative, All-RPPI is down 0.33% which is an improvement on 1.22 loss over 6 months through April 2013.

2013 is not shaping that great so far, as All-RPPI is down 1.52% since December 2012 end.

Overall, All-RPPI is down 50.34% on all-time peak and in May 2013 it was up only 1.09% on all-time low of 64.1 reached in March 2013.


Houses sub-index rose from 67.3 in April 2013 to 67.6 in May - another marginal improvement. Y/y index is down 0.88% and in April it was down 1.17%. 3mo cumulated gain through May 2013 was 0.9% and there was a 6mo cumulated loss of 2.17%. Relative to peak, the series are down 48.79% and the sub-index is 1.2% above the all-time low.


Per chart above, Apartments sub-index is again in decline, falling from 48.4 in April 2013 to 47.1 in May. Y/y sub-index is down 3.09% and previous y/y decline was 2.42%. 3mo cumulative move in May 2013 was -8.54%, while on 6mo basis, the index is up 3.06%. There is huge volatility in the index by historical standards, which suggests that the market is subject to some very concentrated volume swings in sales.

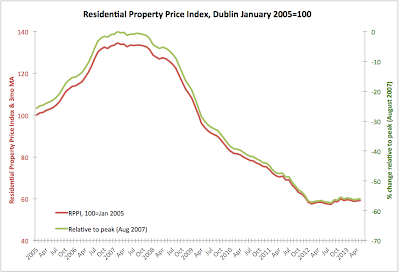
Dublin sub-index has been used before to drum up the evidence that Irish property markets are returning to life. Chart below shows a marginal positive sloping of the trend since the historic lows of H1 2012.

However, at 59.2, May reading came in only marginally better than 58.9 in April 2013. Year on year, Dublin sub-index is up 1.37 and on cumulated 3mo basis, May reading is down 0.17%. On cumulated 6mo basis, the decline is -1.33% through May. There is zero gain since the end of December 2012. 6mo average reading is now 59.2 - bang on with May 2013 reading. 12mo average is at 58.74, less than 0.8% away from the current reading. For all intent and purpose, current trend is flat at around 58.7-59.0 range. Overall, Dublin prices are down 55.99% on peak and are 3.32% up on absolute low.


29/6/2013: Research Funding Does Not Seem to Match Research Performance

Very interesting:

http://www.plosone.org/article/info%3Adoi%2F10.1371%2Fjournal.pone.0065263

From the abstract: "Agencies that fund scientific research must choose: is it more effective to give large grants to a few elite researchers, or small grants to many researchers? Large grants would be more effective only if scientific impact increases as an accelerating function of grant size."

So, the paper examines "the scientific impact of individual university-based researchers in three disciplines funded by the Natural Sciences and Engineering Research Council of Canada (NSERC)", based on "four indices of scientific impact:

  • numbers of articles published, 
  • numbers of citations to those articles, 
  • the most cited article, and 
  • the number of highly cited articles."
All of the above parameters are "measured over a four-year period" and referenced against "the amount of NSERC funding received".

Core findings:

  • "Impact is positively, but only weakly, related to funding" - which is disturbing, as it suggests that funding allocation is not academically efficient. 
  • "Researchers who received additional funds from a second federal granting council, the Canadian Institutes for Health Research, were not more productive than those who received only NSERC funding." Which suggests that the most important agency has trouble identifying and signalling by its grants allocation the academic 'winners'.
  • "Impact was generally a decelerating function of funding." Which is really bad. In basic terms, the more funds were pumped the less was the positive marginal impact. So that "impact per dollar was therefore lower for large grant-holders". Which "is inconsistent with the hypothesis that larger grants lead to larger discoveries". 
  • "Further, the impact of researchers who received increases in funding did not predictably increase." So obtaining a larger grant did not lead to subsequent improvement of the researcher output! 
  • "We conclude that scientific impact (as reflected by publications) is only weakly limited by funding."
  • And a big Boom! "We suggest that funding strategies that target diversity, rather than “excellence”, are likely to prove to be more productive." 
Now, the last point is what all funding agencies around the world are trying to avoid. Everywhere, the policy in funding research is on more concentration and on more winner-picking. Not on funding broader research and research groups.

Incidentally, if you are interested in this topic - what and how should be funded and prioritised in research and education - read my Sunday Times article tomorrow.

29/6/2013: WLASze Part 2: Weekend Links on Arts, Sciences and Zero Economics


This is the second part of my usual Weekend Links on Arts, Sciences and zero economics (WLASze). The first part is linked here.


An insightful piece on what philosophers as a group believe in:
http://www.openculture.com/2013/06/what_do_most_philosophers_believe_.html
Very interesting and can be followed by the very brief (and as such not very deep, but still interesting)
http://www.openculture.com/2010/11/do_physicists_believe_in_god_.html
and by brilliantly extensive http://www.sixtysymbols.com/ .
The latter literally is a sort of a merger of art (of symbol or word or meaning) and sciences.
And while on the above topics, here's John Lennox of Oxford on science and belief… http://johnlennox.org/


Back to art-meets-science, a major mapping/visualization geek alert:
http://www.wired.com/design/2013/06/infographic-this-detailed-map-shows-every-river-in-the-united-states/?cid=co9216134#slideid-152839
Love the images:
Laborious, but beautiful mapping, sadly in relatively low res only...


But blending cheeky with complex does not make it either art or science in the end, in my opinion, of course:
http://www.guardian.co.uk/science/alexs-adventures-in-numberland/2013/jun/26/mathematics
"And when you slice a scone in the shape of a cone, you get a sconic section – the latest craze in edible mathematics, a vibrant new culinary field" Err… not really.


http://www.prokopchik.com/ @pavelprokopchik great photo by Pavel Prokopchik for NY Times: http://www.nytimes.com/2013/06/21/world/europe/a-sea-of-bikes-swamps-amsterdam-a-city-fond-of-pedaling.html?_r=0


Sadly, only in low res quality, again...


Good review via @farnamstreet of a very interesting book on occasionally mindless fascination we hold for scientific explaining away of reality (or is this fascination itself an behavioural bias?):
http://www.linkedin.com/today/post/article/20130607125052-5506908-what-if-capitalism-could-be-artistic?trk=mp-details-rr-rmpost
Which makes me wonder, are biases endogenous to biases? Liam, your suggestions?!. And to MrsG a gentle suggestion: my birthday is coming up...


Bad news:

"Art Southampton Presented by Art Miami for Art Collectors NYC and In-Crowd East Coast with Cars Italia and Galleries Kitsch USA" for the crowd of those who think a horse bronze with polished detail is worth a silver metal couch and all that shines…
You can almost see the parallel to the previous screenshot: animate duo 'racing' to the cocktails counter with an enlightened look about them of a floodlight set to highlight the Maserati... being vs object - all denoting the same fake-ness of the art world that fits a dressed-up-white hangar… in dressed-up Hamptons… Watch the preview slideshow… http://www.art-southampton.com/ it is frightening (and as such so anti-artistic as to become almost artful).

29/6/2013: Banks-Sovereign Contagion: It's Getting Worse in Europe

Two revealing charts from Ioan Smith @moved_average (h/t to @russian_market ): Government bonds volumes held by Italian and Spanish banks:


Combined:

  • Italy EUR404bn (26% of 2013 GDP) up on EUR177bn at the end of 2008
  • Spain EUR303bn (29% of 2013 GDP) up on EUR107bn at the end of 2008
Now, recall that over the last few years:
  • European authorities and nation states have pushed for banks to 'play a greater role' in 'supporting recovery' - euphemism for forcing or incentivising (or both) banks to buy more Government debt to fund fiscal deficits (gross effect: increase holdings of Government by the banks, making banks even more too-big/important-to-fail); 
  • European authorities and nation states have pushed for separating the banks-sovereign contagion links, primarily by loading more contingent liabilities in the case of insolvency on investors, lenders and depositors (gross effect: attempting to decrease potential call on sovereigns from the defaulting banks);
  • European authorities and nation states have continued to treat Government bonds as zero risk-weighted 'safe' assets, while pushing for banks to hold more capital (the twin effect is the direct incentive for banks to increase, not decrease, their direct links to the states via bond holdings).
The net result: the contagion risk conduit is now bigger than ever, while the customer/investor security in the banking system is now weaker than ever. If someone wanted to purposefully design a system to destroy the European banking, they couldn't have dreamt up a better one than that...

Friday, June 28, 2013

28/6/2013: Expenditure Components of GDP: Q1 2013

Having looked at the recession/expansion dynamics in Irish economy on foot of Q1 2013 figures (here),  the dynamics in GDP and GNP in Ireland at the aggregate levels (here), and the mythology of the 'exports-led recovery' (here), let's round up the Q1 2013 QNA cover with a look at the expenditure-lined components of the GNP and GDP.

Below we look at the Seasonally-adjusted Current Market Prices data.

Personal Expenditure on Consumption Goods and Services fell 2.21% in Q1 2013 q/q and was up 0.01% y/y. This compares against much more benign drop of -0.07% q/q in Q4 2012 and a 1.15% rise y/y. Since Q1 2011, when the Coalition came to power, Personal Expenditure is down 1.55%. In terms of q/q changes, Q1 2013 marked second consecutive quarter of declines.

Net Government Expenditure on Current Goods and Services declined 0.1% q/q in Q1 2013 and was down 2.56% y/y. This marks moderation in declines recorded in Q4 2012 when q/q decline stood at -1.90% and y/y decline was running at -2.88%. Net Government Expenditure decline was the shallowest contributor to voerall economic contraction recorded in Q1 2013. Compared to Q1 2011, Net Government Expenditure on Current Goods & Services was down 3.98% in Q1 2013. In terms of q/q changes, Q1 2013 marked second consecutive quarter of declines.

Gross Fixed Capital Formation - the most devastated expenditure component of GNP to-date has fallen massive 7.32% in Q1 2013 in q/q terms and was down whooping 18.74% in y/y terms. This shows dramatic acceleration in decline from -2.16% drop in q/q terms in Q4 2012 and the reversal of the y/y rise of +4.31% recorded in Q4 2012. Relative to Q1 2011, Gross Fixed Capital Formation was down 14.25% in Q1 2013. In q/q terms, Q1 2013 marked second consecutive quarter of declines.

Exports excluding factor income shrunk 0.79% in Q4 2012 on q/q basis and there was 4.93% growth in y/y terms. This was then. In Q1 2013 exports of goods and services fell 4.59% q/q and were down 3.13% y/y. Relative to Q1 2011 exports of goods and services net of factor income payments were up 2.22% in Q1 2013, but we also marked two consecutive quarters of contraction here.

Imports of goods and services, net of factor income payments were down 2.12% q/q in Q1 2013 and -3.13% y/y. This marks significant shift 'South' in the series compared to Q4 2012 when imports shrunk 1.05% q/q and were up 4.57% in y/y terms. Imports are running -0.05% down on Q1 2011 and Q1 2013 marks the second consecutive quarter of q/q declines.


GDP at curent prices, seasonally adjusted fell 0.6% q/q in Q4 2012 and there was annual growth of 0.38%. In Q1 2013, GDP fell 2.16% q/q and there was annual decline of 2.09%. This marks third consecutive quarter of decline in GDP and thus officially, return of the recession is dated to Q4 2012. The average rate of recessionary decline in GDP in the current episode is so far -1.06% per quarter. This is shallower than the previous recessionary episode (Q4 2008-Q4 2009) when GDP contractions averaged 2.76% per quarter. Compared to Q1 2011, Q1 2013 GDP at current market prices stood at -1.04%, or put differently, gross domestic product in Ireland in Q1 2013 stood below the levels attained in Q1 2011 when the current Government came to power.

Net factor income from the rest of the world declined in both Q4 and Q1, with decline accelerating in Q1 2013 to 19.21% q/q from 2.92% in Q4 2012. As the result of this, GNP moved up, in the opposite direction of the GDP.

GNP at current market prices grew 0.68% q/q in Q1 2013, down on 1.18% expansion recored in Q4 2012. On y/y basis, GNP grew 4.12% in Q4 2012 and by 4.26% in Q1 2013. Compared to Q1 2011, GNP is now up 2.46%.

Both Final Domestic Demand and Total Domestic Demand posted second consecutive quarter of q/q contraction in Q1 2013.


To summarise, not a single line of expenditure posted an increase in the Q1 2013 in terms of q/q changes once seasonal adjustments are taken into the account. In other words, the sole positive improvement in the numbers - relating to GNP - was driven exclusively by reduced outflow of funds from MNCs.

Worse, not a single line in the determination of the GDP in Ireland was up in q/q terms in any quarter since the end of Q3 2012. We had, put differently, 6 months of across the board contractions in the economy, when we consider expenditure-based definition of GDP.


28/6/2013: Exports-led recovery: Q1 2013

I covered the headline numbers and trends for the GDP and GNP in previous two posts: here and here. Now, onto some more detailed analysis.

Remember, from the very beginning of the crisis, Irish and Troika leaders have been incessantly talking about the 'exports-led recovery'. Position on this blog concerning this thesis consistently remained that:

  1. Exports growth is great, but
  2. Exports growth is unlikely to be sufficient to lift the entire economy, and
  3. Exports growth projections were unrealistic, while
  4. Exports re-orientation toward services, away from goods was less conducive to delivering real growth in the economy.
Q1 2013 data continues to confirm my analysis.

In Q1 2013, based on real valuations (expressed in constant market prices),
  • Exports of Goods & Services shrunk 6.47% q/q and fell 4.09% y/y. This compares to +1.19% q/q growth in Q4 2012 and +1.28% expansion y/y. Compared to Q1 2011, when the current coalition took over the reigns in the Leinster House, total exports of goods and services are down 0.88% in real, inflation-adjusted terms. Troika sustainability projections envisioned growth of over 6% over the same period of time.
  • Imports of Goods and Services showed pretty much the same dynamics as exports in both Q4 2012 and Q1 2013, but owing to sharper contractions in 2011-2012 these are now down 4.34% compared to Q1 2011.
  • Exports of Goods fell in Q1 2013 by 3.83% q/q and 9.37% y/y, while there were declines of 2.68% q/q and 2.33% y/y in Q4 2012.
  • Exports of Services were down 8.75% q/q but up 1.27% y/y in Q1 2013, and these were up 4.77% q/q and 4.63% y/y in Q4 2012.


  • Trade Balance in Goods and Services fell 4.96% q/q and was down 3.63% y/y in Q1 2013, with Q4 2012 respective changes at -15.91% q/q and +0.98% y/y. Compared to Q1 2011, trade balance is up 15.91%
  • Trade Balance in Goods was down 6.63% q/q in Q4 2012 and this deteriorated to -10.73% growth in Q1 2013. Y/y, trade balance in goods contracted 0.05% in Q4 2012 and shrunk 10.59% in Q1 2013. On Q1 2011, trade balance in goods is down 14.04%.
  • Trade Balance in Services fell from EUR1,130mln in Q3 2012 to EUR132mln in Q4 2012 before improving to EUR601mln in Q1 2013. In Q1 2012 the balance stood at EUR28 million.


28/6/2013: Underlying dynamics in Irish GDP & GNP: Q1 2013

Q1 2013 National Accounts do not make for a pleasant reading. The implications from the business cycle perspective are pretty clear - we are in a continued (3rd quarter in a row) recession, which constitutes the fourth 'dip' since the onset of the Great Recession. The post summarising that evidence is linked here.

In this post, let's take a look at the GDP and GNP in constant prices.

On seasonally-adjusted basis (removing seasonal volatility),

  • GDP at constant factor cost (national output ex-taxes and subsidies) fell 0.65% q/q in Q1 2013, having contracted 0.12% q/q in previous quarter. On an annual basis, the GDP at factor cost declined 1.32% in Q1 2013, accelerating annual rate of decline relative to Q4 2012 when it fell 1.04%.
  • Compared to Q1 2011, when the current Government came to power, GDP at factor cost was 0.72% higher in Q1 2013.
  • Taxes rose 1.04% q/q in Q1 2013, after having posted a decline of 0.64% in Q4 2012. On an annual basis, taxes were down 0.79% in Q4 2012, but they rose 2.32% in Q1 2013.
  • Compared to Q1 2011, taxes were up 1.16% in Q1 2013.
  • To summarise the above, austerity is clearly biting. Taxes are rising at a 60% faster rate than economic activity.
  • Subsidies remained relatively constant in Q1 2013 on an annual basis, implying that net taxes rose strongly.
  • GDP at constant prices (accounting for taxes net of subsidies - the headline metric usually referenced as GDP) fell 0.58% q/q in Q1 2013, which follows a shallower contraction of 0.18% recorded in Q4 2012. On an annual basis, GDP contracted by 1.03% in Q1 2013, following a 1.02% contraction in Q4 2012.
  • Net factor income for the Rest of World (outflows to the rest of the world from factor payments, net of inflows of Irish incomes earned abroad) fell dramatically in Q1 2013, down 16.96% q/q, following a 3.22% decline q/q in Q4 2012. In year-on-year terms, net outflows fell 16.55% in Q4 2012 and by 27.58% in Q1 2013. 
  • It is impossible to tell from QNA the core drivers of the net outflows, however, from the balance of payments data we have reinvested earnings in Q1 2013 by the foreign companies in Ireland at EUR4,753 million, up on EUR4,010 million in Q4 2012 and down on EUR6,768 million in Q1 2012. The gap of Repatriations of earnings from Ireland are not provided for Q1 2013.
  • On foot of significantly reduced outflow of funds abroad, GNP at constant market prices rose in Q1 2013 rose 2.85% q/q and 5.46% y/y, beating growth of 0.51% q/q and 3.01% y/y recorded in Q4 2012. 
  • However, as analysis in the subsequent posts will show, this growth is entirely dependent on reduced outflows of funds abroad. Q/q, net expatriation of funds slowed down by EUR1,204 million, while earnings outflows abroad shrunk by EUR2,015 million.
  • Taking the average net factor payments abroad for Q1 2010-2012 in place of Q1 2013 figure, GNP growth controlling for net factor payments changes would have been around -0.01% y/y and -2.48% q/q.
Charts below summarise seasonally unadjusted series:


The chart below clearly shows that even in y/y terms, we are now in a solid, three-quarters long (so far_ recession.

The GDP/GNP gap has, predictably - given the shrinking of net factor payments abroad - declined from 25-26 percent (seasonally-adjusted and unadjusted) in Q1 2012 to 17.3-17.5 percent in Q1 2013:


It is worth noting in the chart above a significant increase in volatility in the gap, which is reflective of the greater volatility in Ireland's GDP and GNP series as well as destabilisation in growth correlation between GDP and GNP. This new pattern is most pronounced starting with Q1 2008 and is associated with both - the crisis and the underlying re-distribution of growth drivers away from the domestic economy to services exports, especially during the 2010-2011 'recovery'.