Showing posts with label Irish residential property prices. Show all posts

Thursday, October 31, 2013

31/10/2013: Irish Residential Property Prices: September 2013

Updating the Residential Property Price Index data from CSO released earlier this week, here are the core highlights for September 2013:

  • All country RPPI rose to 68.2 in September from 67 in August, marking sixth consecutive month of rises The index is now up 3.65% y/y (in August it was up 2.76% y/y).
  • 3mo cumulated change in RPPI is 3.96% and 6mo cumulated change is 6.4%. 6mo average rise is 0.66%.
  • Nama valuations (with 10% cushion on LTEV uplift and risk sharing) are now 33.97% off the mark.
  • Relative to peak, index now stands at -47.74% and relative to absolute minimum it is at +6.4%.
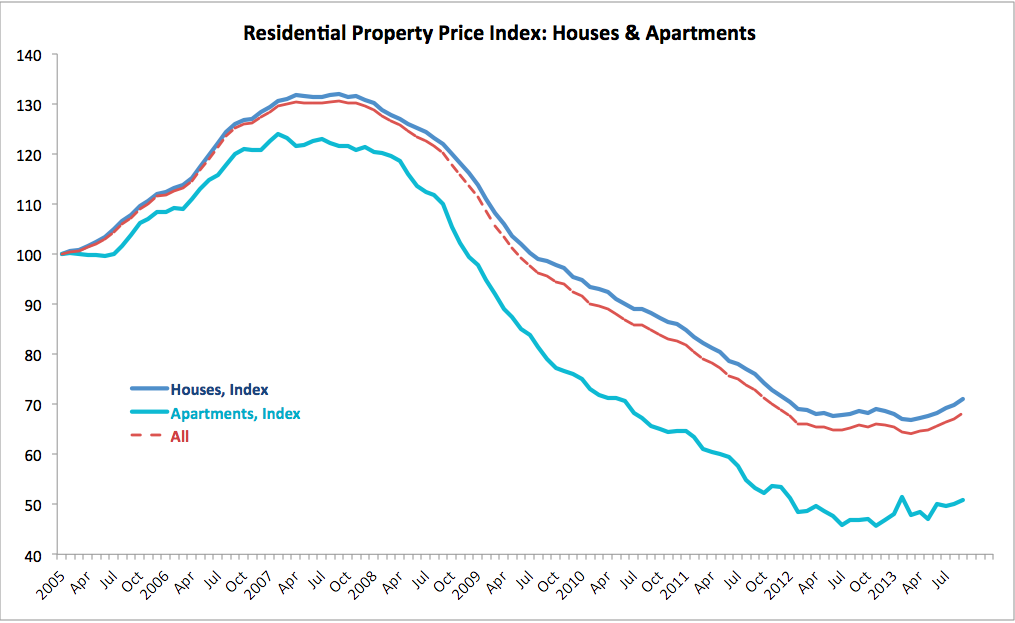
For Houses RPPI:

  • Index rose to 71.0 in September from 69.8 in August and posted a 3.35% rise y/y.
  • 3mo cumulated gains are at 4.11% and 6mo cumulated gains are at 6.29%. Average over 6 months monthly increase is 0.69%.
  • Relative to peak, the index now stands at -46.21% and relative to absolute minimum it is at +6.29%.
  • September marked sixth consecutive month of rises in house prices.
For Apartments:


  • Index rose to 50.9 in September from 50.0 in August and posted a 8.53% rise y/y. 
  • 3mo cumulated gains are at 1.6% and 6mo cumulated gains are at 6.26%. Average over 6 months monthly decrease is -0.41%.
  • Relative to peak, the index now stands at -58.92% and relative to absolute minimum it is at +11.38%.
  • September marked second consecutive month of rises in apartments prices.


Dublin RPPI:

  • Index rose to 65.9 in September from 63.4 in August and posted a massive 12.27% rise y/y.
  • 3mo cumulated gains are at 9.47% and 6mo cumulated gains are at 12.07%. Average over 6 months monthly increase is 1.13%.
  • Relative to peak, the index now stands at -51.0% and relative to absolute minimum it is at +15.01%.
  • September marked sixth consecutive month of rises in Dublin property prices.


Conclusions:
  • Twin convergence toward long-term equilibrium prices is now evident in Dublin markets (upward price pressures) and National ex-Dublin prices (downward pressures). 
  • The core question is when will Dublin prices overshoot their long-run trend and moderate again?
  • Another core question is what the fundamentals determined price levels are for Dublin and for the rest of the country?
  • I have no answers to the above questions and anyone who says they do is most likely talking porkies.
  • What I do know is that there are plenty of risks to the downside and headwinds working through the economy. These include: mortgages arrears, income effects of tax and charges changes in Budget 2014, banks rates on existent mortgages; and new mortgages supply and pricing. 
  • So far, my gut feeling is that we are still on a sustainable upward trend in Dublin and on moderating negative trend in the rest of the country. 

Thursday, September 26, 2013

26/9/2013: Irish Residential Property Prices: August 2013

Residential Property prices Index for Ireland is out today, showing strong gains in property prices in Dublin.

Y/y August 2013 residential property prices increased by 2.8% nationally. This compares with an increase of 2.3% in July and a decrease of 11.8% recorded in the twelve months to August 2012. That is a reasonable number, ahead of inflation rate, which is natural given the contraction in the market experienced so far.

However, several sub-trends are worth noting.

  • Residential property prices grew by 0.9% in the month of August. This compares with an increase of 1.2% recorded in July and 1.3% growth in June. Which implies that the rate of growth has slowed down through August. Seasonality is a factor here. 
  • Annual rate of growth is still rising: from 1.23% in June, to 2.31% in July to 2.76% in August. This means we have: rising rate of growth and three consecutive months of growth. Last time we had three consecutive months of growth was back in 3 months through January 2008.
  • 3mo MA for all properties index is at 66.33 in August, which is the best reading since March 2012. Over the last 3 months property prices rose cumulative 3.4% and over the last 6 months they are up 4.04%
  • August reading is the highest level since January-February 2012, although prices are still down 48.66% on peak.

The above is illustrated in Chart below:


Now, absent other sub-trends, we can be tempted to call a turnaround in the prices at this stage. With two caution notes: (a) this still is subject to adverse risks from the mortgages arrears side, and (b) the above turnaround only applies to Dublin.


Next positive bit: the uptick in the overall index was co-driven by the Houses prices (as opposed to Apartments). Houses prices are more indicative of long-term demand, rather than of short-term lettings demand closer linked to Apartments.

  • Houses price index rose 0.87% m/m and was up 2.65% y/y in August. August annual rate of increase was faster than July (2.06%) and June (0.89%) and marks the third consecutive annual rise. 
  • 3mo MA is now at the levels last seen around March 2012 and the overall index itself is at the levels of January-February 2012. Prices are still down 47.12% on peak.

Chart to illustrate:

Apartments prices have been moving sideways doe the last 8 months, bouncing around 49.5 mean. August reading was weak but slightly up at 50.0.


The core driver for overall RPPI is Dublin:

  • Dublin residential properties prices rose 10.55% y/y in August marking 8th consecutive month of increases. 
  • 3mo MA is at 61.93, the best level since December 2011 and the index itself is at the levels of October 2011.
  • These are solid gains and Dublin market appears to be in full turnaround, although prices are still down 52.86% on peak. Most of these gains was driven by houses, not apartments.

Chart to illustrate:


In brief: 

  • Good news is prices are growing broadly in-line with inflation plus modest recovery in values. 
  • Further good news, Dublin prices are converging up toward national levels - something that should have happened ages ago. 
  • More good news: prices outside of Dublin are slowly correcting down, declining 2.6% y/y in August. 
  • I think we can call turnaround in prices to be sustained for Dublin and getting closer to showing sustained upward dynamics for national level prices. Prices for Apartments and prices for properties outside of Dublin are still in declining or flat mode. 
  • Headwinds and risks remain on the side of mortgages crisis resolution and income dynamics.

Tuesday, July 30, 2013

30/7/2013: It ain't recovery until prices start rising, folks...

You know the myth - the one spun by the realtors and the likes of the various business development bodies around the country - that goes something like: "Irish recovery is showing green shoots, as foreign investors are flocking to the Irish market, kicking tyres and snapping all commercial property they can get their hands on".

As usual, there's a basic logic flaw with much of the internal Irish commercial / business world. Normally, when someone is flocking with suitcases of cash to some destination to buy, demand goes up, and prices rise. In the short run, this logic might fail to hold if there is a supply rise of involuntary sales of properties in the market. In the long run, this demand-price relationship must hold, because both voluntary and involuntary supply of properties adjusts to move along with prices. In other words, even idiot bankers would begin to withhold property from the falling market when there are willing buyers kicking tyres in hope of gaining more on sale.

It has been years, that's right - years - since the reports of the alleged 'tyres-kicking' foreign investors first started to percolate. And yet... oh well... just look at prices:


Yes, per Central Bank chart (above), commercial property is still shrinking in terms of prices. The rate of shrinkage is moderating. But that is not the same as saying that prices are rising. They are falling, falling at a diminished rate, but still falling.

The 'recovery' is much more likely in the housing market, where cash-rich farmers (having made their dosh on pre-bust sales of land and still awash with CAP cash), cash-rich and property-secured senior professionals and retirees (having made their surplus money on pre-bust sales of homes in Donneybrook etc) and cash-rich Googlites and Namanoids (the sub-sects of the South Dublin younger professionals in cushioned jobs) are all chasing prime properties in the upper middle class segment of the market. Aside from that, things are not exactly hunky-dory, like...


Still, the housing market is telling a much better story of a 'recovery' (albeit it is still not a true recovery, yet), than the fabled foreign-investors-teaming commercial property markets... The old Widow Scallan's reincarnation as an ex-Spar 'prime retail' space is out for grabs... There's (allegedly) American investment funds-led bidding war going on across the country... so hurry up...

Tuesday, July 23, 2013

23/7/2013: Irish Residential Property Prices: June 2013

Irish Residential Property Price Index (RPPI) is out today with latest figures for June 2013 offering a snapshot on H1 and Q2 activity in the sector, with some encouraging signs.

From the top line data: the overall property price index has managed to post the first annual increase in June since January 2008. However, overall trend in overall index remains flat, as established from Q2 2012.

  • Year on year, RPPI was up 1.23% in June, having posted -1.07% growth in May 2013.
  • 3mo cumulated change through June 2013 was at 2.34% and this contrasts +0.62% rise in 3 months through May 2013.
  • 6mo cumulated change remains negative at -.03%, but much shallower than -1.97 6mo cumulated change through May 2013.
  • M/m June rise of 1.23% was the largest m/m move up since September 2007.
  • However, on 3mo MA basis, the index June reading was 65.0 - still below the levels recorded in February 2013.
  • Relative to peak the index is down 49.73%, the best reading since December 2012. However, the RPPI is only 2.34% above the all-time low.
Top-line conclusion: RPPI is struggling to lift up above the flat trend despite the unprecedented level of prices collapse to-date.

Chart to illustrate the above trends:


Apartments drove the overall index up on a m/m basis and largely accounted for much of change y/y. The problem is that apartments index is based on thin data, so it is subject to much volatility.
  • Houses RPPI was up 0.89% y/y in June, having posted a y.y contraction of -0.88% in May. M/m index rose 0.89%.
  • 3mo cumulated increase in Houses RPPI was 2.10% in June against a rise of 0.9% in May.
  • 6mo cumulated move in Houses RPPI remains negative at -0.73% - a moderation on -2.17% contraction in May.
  • 3mo MA through June is 67.7, which is the best 3mo MA reading since February 2013 (67.93).
  • Relative to peak, Houses RPPI is down 48.3% and current index reading is only 2.1% above the all-time low.
  • Apartments RPPI reached 50.1 in June 2013, up 5.25% y/y and this contrast in the index being down 3.09% y/y in May 2013. M/m June move stood at +6.37%.
  • 3mo cumulated change through June 2013 stood at +4.59% a strong reversal on -8.54% 3mo cumulated fall in May 2013.
  • 6mo cumulated rise in June stood at 6.82% against 6mo cumulated rise of 3.06% in May 2013.
  • Current reading of the index is 59.56% below the peak and is 9.53% ahead of the absolute low.
  • However, Apartments RPPI STDEV during the crisis period has been at 23.5 against 20.3 for Houses Index. And STDEV for m/m changes was 2.36 for Apartments, against 0.84 for Houses.
  • 3mo MA for Apartments index reached 48.53 in June 2013, which is above May 3mo MA, but below April.
Chart below illustrates Apartments and Houses indices trends:

Top line conclusions: Again, the flat trend remains for the houses index and there is a slight upward trend for the apartments. Both series are relatively anaemic, despite the positive moves. High volatility in Apartments index suggests that caution should be used in interpreting overall RPPI data short-term moves.

Dublin RPPI:
  • Dublin RPPI rose 4.15% y/y in June 2013, having posted a rise of 1.37% y/y in May. June marks sixth consecutive month of increases in Dublin RPPI (y/y terms).
  • 3mo cumulated change in June stood at 2.38% reversing the 3mo cumulated decline of -0.17% in May 2013.
  • 6mo cumulated increase in June was 1.69%, reversing a -1.33% 6mo cumulated drop in may.
  • Relative to peak, Dublin RPPI is now down 55.24% and relative to absolute low the index is up only 5.06%.
  • 3mo MA at 59.43 in June 2013 is the best 3mo MA reading since January 2013.
  • Against the peak, current reading brings us back to the levels last seen in December 2011-January 2012.
Chart to illustrate:


Top line conclusions:  Dublin RPPI is showing most significant and lasting gains of all sub-indices, backed also by medium-range volatility (STDEV for m/m changes is 1.38 for Dublin RPPI).

How significant was the skew in All Properties RPPI due to movements in Apartments? Very significant. 
  • All RPPI was up 1.2% y/y in June 2013
  • National Houses RPPI was up 0.9%
  • National Apartments RPPI was up 5.3%
  • Ex-Dublin, All RPPI was down -1.0%, Ex-Dublin Houses RPPI was down 0.9% (close to All RPPI ex-Dublin)
  • Dublin All RPPI was up 4.2% with Dublin Houses RPPI up 3.6% and Dublin Apartments RPPI up 9.7%.
Hence, overall RPPI was strongly pushed up by Apartments and Apartments index was pushed up by Dublin Apartments.

Saturday, June 29, 2013

29/6/2013: Nama valuations update to May 2013

In the previous post I looked at the latest prices trends in Irish property markets. Now, as promised, an update on Nama valuations.

Note: these numbers are indicative, rather than exact estimates.


29/6/2013: Irish Residential Property Prices: May 2013


This week, CSO released Residential Property Price Index (RPPI) for May. Here's the update on trends and changes. Nama valuations update will be posted in a follow-up post.

Per CSO data, All properties RPPI rose marginally from 64.6 in April to 64.8 in May, 2013. The index is now in the range of 64.1-64.8 for four months in a row, suggesting no change to the overall flat trend at around 65.2. The flat is now running from February 2012, and we are currently below the trendline by about 0.6%.

Year on year, index is down 1.07% and in April it was down 1.22%. Over the last 3 months, All-RPPI rose 0.62% cumulatively, which reverses 1.22% loss on 3mo through April 2013. On 6mo basis, cumulative, All-RPPI is down 0.33% which is an improvement on 1.22 loss over 6 months through April 2013.

2013 is not shaping that great so far, as All-RPPI is down 1.52% since December 2012 end.

Overall, All-RPPI is down 50.34% on all-time peak and in May 2013 it was up only 1.09% on all-time low of 64.1 reached in March 2013.


Houses sub-index rose from 67.3 in April 2013 to 67.6 in May - another marginal improvement. Y/y index is down 0.88% and in April it was down 1.17%. 3mo cumulated gain through May 2013 was 0.9% and there was a 6mo cumulated loss of 2.17%. Relative to peak, the series are down 48.79% and the sub-index is 1.2% above the all-time low.


Per chart above, Apartments sub-index is again in decline, falling from 48.4 in April 2013 to 47.1 in May. Y/y sub-index is down 3.09% and previous y/y decline was 2.42%. 3mo cumulative move in May 2013 was -8.54%, while on 6mo basis, the index is up 3.06%. There is huge volatility in the index by historical standards, which suggests that the market is subject to some very concentrated volume swings in sales.

Dublin sub-index has been used before to drum up the evidence that Irish property markets are returning to life. Chart below shows a marginal positive sloping of the trend since the historic lows of H1 2012.

However, at 59.2, May reading came in only marginally better than 58.9 in April 2013. Year on year, Dublin sub-index is up 1.37 and on cumulated 3mo basis, May reading is down 0.17%. On cumulated 6mo basis, the decline is -1.33% through May. There is zero gain since the end of December 2012. 6mo average reading is now 59.2 - bang on with May 2013 reading. 12mo average is at 58.74, less than 0.8% away from the current reading. For all intent and purpose, current trend is flat at around 58.7-59.0 range. Overall, Dublin prices are down 55.99% on peak and are 3.32% up on absolute low.


Friday, June 14, 2013

14/6/2013: Scary table of the week: Irish Property Prices 'Recovery' Dating

Updating my databases, I came across an old exercise of estimating the property prices recovery paths for Ireland based on the CSO Residential Property Price Index. Here's an updated table of dates of expected recovery according to three basic scenarios:


There is virtually no point of repeating the same exercise for real values, albeit the closest this comes to such an attempt is Scenario 3.

All calculations are based on CSO data.

Friday, April 26, 2013

26/4/2013: Where's that 'recovery' thingy? Irish Residential Property Prices, March 2013

Various Irish ministers and Government 'analysts' have been on the media in recent months extolling the virtues of 'recovery'. In a society still obsessed with property prices, one of the key tenets of the 'recovery is upon us' proposition is the view that Irish property prices are rising once again usually followed by the claims that hordes of 'foreign investors' and 'domestic cash buyers' are fighting to get their hands on prized Irish properties.

Of course, a major point of internal contradiction for all these 'green jersey' claims is that if property prices are rising, then the cost of doing business in Ireland should be rising as well, just as the 'analysts' are claiming that it is falling, especially when it comes to rents and property costs. You see, one can't really have both: deflation in costs is incompatible with rising prices on assets underlying these costs.

Meanwhile, as usual with the Government's exhortations, reality has been having a mind of its own.

Latest numbers from CSO, covering the Residential Property Price Index for Ireland, show exactly how out of touch the folks peddling are.

All properties RPPI fell 3.03% y/y in March and this accelerated 2.57% y/y fall recorded in February. M/m property prices were down 0.47%, which is better than 1.59% m/m drop in February, but marks 4th consecutive month of monthly prices drops. Last time Irish residential property prices were up was in November 2012 and since then we have seen a cumulative decline in prices of 3.03%.

6mo cumulative decline in RPPI stands at 2.58% against previous 6mo cumulative drop of 1.23% and against average m/m drop over the last 6 months of 0.43%.

In fact, All Properties index has fallen to an all-time low in March 2013 despite numerous proclamations of recovery by the Government. Property prices are now down 50.88% on their peak and are statistically significantly below crisis period average.


The distance to 6mo MA line is now widening, which suggests that we might be in a medium-term secular change in trend downward from the previous trend that was just flat. As a note of caution: this remains to be confirmed over time.

House prices also hit an all-time low in March 2013 with index sliding 3.05% y/y, against 2.90% decline recorded in February, and 0.3% down on m/m basis. 3mo cumulated change is now -3.04%, 6mo cumulated change is at -2.77% and previous 6mo cumulated change was -1.47% so things are getting worse faster. House prices are now down 49.39% on peak.

Apartments prices have decline 1.44% in March on y/y basis, having posted 6.4% rise y/y in February. Monthly change in Apartments prices was -6.99%. 3mo cumulated change in prices is still +2.13%, with 6mo cumulated change of +2.13% down from previous 6mo cumulated change at +9.81%. Relative to peak, Apartments prices are running down 61.34% and relative to all-time low they are up just 4.81%.


Dublin prices were most often cited as showing significant gains in the current 'recovery'. These are still up 1.38% y/y in march, but they were up 2.95% y/y in February. Monthly drop in Dublin residential properties was -0.84% m/m and this marks second consecutive m/m drop. 3mo cumulated change in prices was -0.68% against -1.17% in previous 3mo period, 6mo cumulated change is now at +0.17% against +3.49% increase on previous 6mo period. Dublin prices are now down 56.28% on peak and are up 2.62% on absolute low.


In short, to conclude:

  1. As I have maintained throughout recent months, Irish residential property prices are trending flat overall.
  2. Flat trend is now being challenged to the downside, with some indications that it is turning to negative, though this requires more data to make any conclusion firm.
  3. Prices are seeking some catalyst in the market and despite all the efforts by the Government to 'talk the talk' on recovery, there are no indications from the property market that such 'recovery' is anywhere in sight.

Tuesday, April 2, 2013

2/4/2013: Confused or spun? Property prices in Ireland


So foreign investors are allegedly flocking in thousands to Irish commercial real estate markets, snapping anything they can get their hands on... right
http://www.independent.ie/business/world/number-of-empty-office-buildings-soars-by-67pc-29167687.html

Meanwhile, of course, residential property is on a 'recovery path' (aka flat-line dead) per latest CSO figures for the Residential Property Price Index.


In February 2013, RPPI for all properties fell from 65.4 in January to 64.4 (a decline of 1.53% - the steepest rate of m/m drop since February 2012 and worse than the year-to-date average m/m decline of 1.07%). The index is now down 2.57% y/y.

Looking at slightly smoother 3mo figures: 3mo cumulative change on previous 3 months was -2.57% which signals acceleration in decline compared to 6mo change on previous 6 mo at -1.23%. Thus, relative to peak, RPPI hit absolute bottom at -50.65% with previous record drop of -50.34% recorded in June 2012.


The Government needs some serious spin to paint house prices dynamics in anything but bleak terms. Per RPPI, House prices are deteriorating, slipping to 67 in February 2013 from 68.1 in January 2013 and setting an all-time record low. House prices are down 1.62% m/m and 2.90% y/y. 3mo cumulated change is -3.04% and 6mo cumulated change is -1.47% so things are getting worse, not better, over time once again.

RPPI overall, however, was supported to the upside by the price changes in sub-index covering Apartments. Apartments prices sub-index rose to 51.5 in February from 48.1 in January (+7.07% m/m) which suggests that a single outlier transaction might have distorted the cumulative figures. Nonetheless, in terms of 3mo MA this only brings sub-index to the levels of May-June 2012.


Lastly, Dublin sub-index showed once again that flat-line can actually be associated with both down and up volatility. In February 2013 Dublin sub-index slipped to 59.3 from 59.5 in January, which means that the index is now up 2.95% y/y. Happy times? Somewhat. But note that 6mo cumulated change through February 2013 was at +3.49% while 3mo cumulated change through February is -1.17%, so dynamically things are worrisome, rather than encouraging.


Funny thing this recovery, folks... Government & Green Jerseys say one thing, their own data says another... confused.com? or maybe spin.ie?

Saturday, March 30, 2013

30/3/2013: A simple, yet revealing, exercise in house prices


Based on the latest reading for the Irish Residential Property Price Index, I computed three scenarios for recovery, based on 3 basic assumptions of:

  1. Steady state growth of 5% per annum in nominal terms (roughly inflation + 3% pa)
  2. Steady state growth at the average rate of annual growth clocked during 2005-2007 period, and
  3. Steady state growth at inflation + 1% pa
Note, Scenario 3 is the closest scenario consistent with the general evidence from around the world that over the long run, property returns are at or below inflation rates.

Table below summarises the dates by which we can expect to regain 2007 peak in nominal terms:


Yep, turning the corner (whenever we might do that) won't even be close to getting back into the 'game'...

Thursday, February 28, 2013

28/2/2013: Boring, Boring Property Prices in January


When one is bored, truly deeply bored, it is hard to muster much strength to go through the twists and turns of the data. And I am bored, folks. Irish property prices data, released by CSO today, is simply equivalent to watching a fish flopping on hot asphalt - it is simply, clearly, obviously, patently... not going anywhere.

That is the story with the stats from Ireland nowadays - the flatline economy, punctuated by the occasional convulsion up or down.

Alas, to stay current we simply have to go through the numbers, don't we?

Let's first do a chart. Annual series for 2012 are finalised and were revised slightly down on the aggregate index compared to the previous release:


The chart clearly shows that despite all the talk about 'bottoming out' house prices, and 'buyers throwing deposits on unfinished homes' is a quasi-2006 frenzy, property prices in Ireland fell over the full year 2012.

Recall the prediction by some economists that property prices are likely to stabilise around -60% mark on peak? I made similar claim, but referencing in the medium term Dublin and larger urban areas, while stating that nationwide prices will be slower to react due to rural and smaller towns' property markets being effectively inactive. Guess what? Dublin prices were down 56.3% on peak in 2012. Not exactly that badly off the mark. Apartments prices - down 61.1% on peak. Exceeding the mark. Nationwide, properties were down 49.5% on peak, still some room to go, but in my view, we are still heading in the direction of 60% decline.

Now, onto monthly series.

Nationwide Property Prices: 

  • All properties RPPI declined from 65.8 in December 2012 to 65.4 in January 2013 (down 0.61% m/m) and is down 3.25% y/y. 
  • Despite all the 'stabilisation claims', overall RPPI has not posted a single month y/y increase since January 2008. 
  • The 'good news' is that RPPI rate of decline (in y/y terms) has slowed down for the 9th consecutive month in January 2013.
  • 3mo MA has been static now over the last 3 months at 65.77, which simply means that half of the gains that were made from the historical trough of 64.8 in June 2012 to the local peak of 66.1 attained in November 2012 were erased when the index fell to 65.8 in December. January rise is a tiny correction back up.
  • Let's put this differently. January 2012 index returned us back exactly to the level of prices recorded in April 2012 and then repeated in October 2012. 
  • The market is... lifeless. Irony has it: 3mo cumulated gains through December 2012 were exactly zero. 3mo cumulated change in the index through January 2012 is exactly zero.
  • 6mo cumulative gains are more 'impressive' at +0.77%.
  • But put this into perspective: this rate of 'growth' implies annualised rate of +0.878%. At this rate of annual expansion, the next time we shall see 2007 peak level prices for properties, expressed in nominal terms, will be 2092. 
Dublin:
  • Prices in Dublin corrected slightly up in January to 59.5 from 59.2 in December 2012. Latest reading is still below 60.0 local peak recorded in November 2012, so the correction is so far very much partial.
  • Y/y prices are now firmer at +2.06% in January, having posted -2.47% decline in December. January marked the first month that we had y/y increases in prices since November 2007.
  • The rate of price increase in January in y/y terms, however, is basically solely correcting for inflation, which means that for anyone with a mortgage payable today, property 'wealth' is continuing to drop in real terms. Obviously, that is too far advanced of an analysis for the Government and its cheerleaders who think 2.06% increase in just one month over 62 months is a firm sign of a 'turnaround' or worse, 'recovery'.
Instead of boring you with the discussion of detailed stats on dynamics, here are the main charts:


All of the above show basic reality of an L-shaped 'recovery' we have been having to-date. May be, one might hope or one might dread, the prices will move up from here in a more robust fashion. Reality is - so far, they are not... When that reality changes, I will let you know.


Tuesday, January 22, 2013

22/1/2013: RPPI, Ireland: December 2012


In the previous post I took a quick look at the Residential Property Price Index (RPPI) annual series. Here are monthly frequency observations.

All properties:


  • December 2012 All Properties RPPI stood at 65.8, the same level the index was at back in between March and April 2012 and again in September 2012. In Other words, the index de facto is running flat.
  • Put differently, the index has now fully erased the miraculous gain of November 2012 and returned prices back to September levels.
  • Monthly rate of change in the index was negative at -0.454% and the index is running well below 65.77 12mo MA.
  • Year on year the index fell 4.5% in December 2012, after posting a 5.71% decline in November. Thus December represents the slowest y/y rate of decline in the series since May 2008. Which is good-ish sort of news.
  • For Nama valuations, latest data suggests a fall in values of 33.26% net of burden sharing cushion.
  • 12mo MA monthly rate of change is at -0.378% which is shallower than December 2012 m/m decline of 0.454%
  • Putting things into a bit more longer term perspective, simple average of RPPI for the period from January 2008 through present is 90.02, which stands contrasted with 2012 average of 65.73 and 2011 year average of 75.37.
  • On shorter term comparatives: H1 2012 average reading was 65.92 against marginally lower H2 2012 average of 65.53. 
  • Relative to monthly peak, RPPI stood at -49.58% or comfortably rounded off to 50%. This reading for December 2012 was statistically indistinguishable from the 'nominal' monthly low of -50.34% set back in June 2012.
  • Thus, monthly volatility aside, there is no increase in prices. As I noted in November data analysis, we are bouncing along the bottom, which may or may not be a 'true' bottom or a 'false' bottom. This conclusion is further supported by the factors that are likely to impact prices going forward that I outlined in September 2012 data analysis (link here).


House prices sub-index:

  • House prices subindex declined marginally from 69.1 in November to 68.7 in December, thus erasing completely any gains delivered from September 2012. 
  • House price dynamics are virtually identical to those of the overall RPPI as outlined above.
  • 2012 year monthly average index reading was 68.57, slightly behind 68.7 recorded in December. However, 6mo average through H1 2012 was 68.7 and this has fallen to 68.43 average for H2 2012. 
  • Y/y index fell 4.18% in December, marking the shallowest rate of decline in the series since May 2008.
  • Frankly, all of the changes are within the range of being statistically insignificant, so the theme of 'flat line market' continues unabated.


Apartments show the same dynamics as Houses, so let's avoid repetition and note that

  • Houses prices are down 47.95% on peak, while Apartments prices are down 62.15% on peak.


The index has been criticised, for the n-th time by the realtors for failing to reflect the 'great demand' from the cash buyers. Alas, my view is that cash buyers are not, repeat, not a normal market, but rather an aberration that is bound to be short-lived. In this sense, if we want a gauge of real market activity, then the CSO data provides a far better picture than testosterone-fuelled hype of few whales with cash stashed from CPOs of the old days bidding each other out to land a 'family home suitable for conversion into student bedsits'.


Dublin, last.


  • Property prices in Dublin slid from 60 in November to 59.2 in December, marking 1.33% decline m/m and 2.47% drop y/y. 
  • Relative to peak, Dublin market is down 55.99%. Which is above the absolute low of 57.40 achieved in August.
  • On dynamics side, 12mo average is running at 58.32, worse than December reading, but well below 2011 average of 67.86. H2 2012 average is at 58.57 and virtually identical to H2 2012 average of 58.07. In other words, medium-term dynamics are flat. Flatlining is the theme here again.


22/1/2013: Irish Property Prices: 2012


Per CSO's Residential Property Prices Index released today, property prices in Ireland registered a fall of 4.5% in the year to December 2012.

The spin of 'good news' is seemingly abating in the wake of the figures. While I will cover detailed trends in the next post, here is a snapshot of annual series. Do, please, let me know if you see much of 'return to growth' in house prices:


To summarise the above and extend to the begging of the CSO series:
-- Overall RPP Index fell in 2012 to the annual level of 65.7 down from 75.4 in 2011 and down 49.5% on peak. In 2011 relative to peak RPP Index stood at a 42.0% discount. Y/y rate of fall in the annual index in 2012 was 12.86%, statistically identical to 13.10% drop in 2011. Surely, this is not a 'bottom has been reached' set of figures, no?
-- Houses nationally sub-index fell in 2012 to 68.6 against 2011 level of 78.4 (posting y/y decline of 12.5% in 2012, marginally and virtually dental to 13.0% fall in 2011). Again, please, tell me that decline of 13% followed by 12.5% is some sort of 'bottoming out'. Annual series for national house prices is now at 47.7% below peak having fallen 40.2% relative to peak in 2008-2011.
-- Apartments nationwide dropped from 57.8 in 2011 to 47.8 in 2012, with annual rate of decline in 2012 of 17.3% showing acceleration on 16.4% y/y drop in 2011. Again, the clear 'bottoming-out' of prices for Irish apartments is now in sight. These have fallen 52.7% relative to peak in 2011 and are now at 60.9% below peak.
-- Dublin property prices have posted a drop from 67.9 annual 2011 index reading to 58.3 in 2012 - a decline y/y of 14.14% which follows 2011 y/y drop of 13.9%.

To summarise, the 'bottoming-out' of Irish property prices in 2012 has resulted in prices declines across all four core categories (the few with a potentially sufficient numbers of sales to make any meaningful conjectures about). Not one category saw an annual increase in prices. And, to add an insult to the injury, y/y rates of decline in the prices in 2012 were worse than in 2011 in one case, marginally better in one case, and practically identical in two series. 

Thursday, October 25, 2012

25/10/2012: Signs of Life or a Dead-Cat Bounce : RPPI September 2012


With some delay an update on the latest data from the Residential Property Price Index for Ireland and some longer-range thoughts on property prices direction.

First top level data:

Headline RPPI has risen from 64.2 in August to 65.8 in September (+0.92% m/m). The index is still down 9.62% y/y.

  • This marks a third consecutive month of index increases (July +0.15%, August +0.46%) and over the last 3 months cumulative index gains were 1.54% (annualised rate of growth of 6.32%). This is one headline  you keep hearing. However, last 6 months cumulative change in the RPPI is still negative at -0.45% (annualized rate of growth of -0.91%).
  • What you don't hear about is that August rise was the first statistically significant increase in the index since February 2007 (in m/m terms) and the largest monthly rise since then (in February 2007 index rose 0.935% m/m). In general, irish statistical releases do not provide analysis of statistical significance of changes. Yet, the lack of statistical significance in previous monthly increases is precisely the reason why I am hesitant in calling the trend reversal (on dynamics - for fundamentals, see below).
  • Year on year September showing (-9.62%) is the best since October 2008 when y/y change was 9.53%. This too is a decent sign. However, it is statistically in-distinguishable from the crisis period average of -12.95%. Which is exactly the point of dynamics - while three months of slight increases is a good sign, it is still fragile to establish a trend reversal formally.
  • The index is now 49.58% off the peak, so overall prices have roughly returned to the level where they were... err... in March-April 2012. With all the hoopla of the 'stabilisation' and 'price increases' over the last 3 months, all we've regained in terms of prices is roughly-speaking 5 months worth of prices. Three steps forward, two steps back market is only as good as the pattern repeats, like, 10 times or so?


Dublin trends: RPPI for Dublin rose to 58.7 in September from 57.3 in August (+2.44% m/m) but is still down 9.83% y/y. The dynamics for Dublin prices imply 3mo cumulative rise in prices of 1.56% (+6.38% annualized) and 1.21% cumulated increase in 6 months (annualized +2.43%). It is clear that Dublin prices drive national trends and that in dynamic terms, Dublin prices are pretty much in the very same shape as national prices.
  • Just as with national prices, Dublin prices m/m increase in September was the first statistically significant rise for the entire period of the crisis. This is good. 
  • Dublin prices currently stand at the levels comparable to December 2011-January 2012, which is marginally better than the prices levels nationwide.
  • Of course, Dublin prices have fallen to 56.36% of their peak (at the trough level, the decline was 57.40%).
  • However, dublin price increase in m/m terms in September is the first monthly increase and can probably be explained by a number of one-off factors (see fundamentals discussion below).

Overall, my conclusion is that there is a welcome tentative sign of stabilization in the national house prices trend, but it is too early to call a reversal of the trend to rising prices.

The risk is still exceptionally heavily weighted to the continued decline in Irish property prices for a number of fundamental reasons:
  1. In my opinion, August-September figures, and likely the rest of the year figures are skewed by a number of one-off factors: eminent expiration of interest relief measures, comes January 2013, build up of demand during the rain-soaked summer when house-viewing was outright an occupation for the brave, a number of larger auctions coming through both brining in some supply to the market and generating a bit of a hype in the media.
  2. In 2013 we can expect serious pressure on the market rising from such longer term factors as:
  • Budget 2013 income and indirect tax changes that will reduce further purchasing power of Irish households;
  • Budget 2013 changes in relation to property taxation;
  • Continued increases in mortgage rates charged by the banks compounding after-tax income decreases to be delivered by the Budget;
  • Gradual acceleration of foreclosures during the second half of 2013 as Personal Insolvencies Bill  starts to bind;
  • Potential changes to pensions funding reliefs resulting in a last-minute rush to recap pensions in anticipation of future changes which wil act to reduce funds available for purchases;
  • Reductions in the deposit rates in the banks will lead to a gradual shifting of savings out of cash deposits into pensions and investment products (this factor can also provide some relief to the property markets, although this support is likely to be more fragile than property agents and mortgages brokers might suggest)
  • Yields can significantly decline if/when buy-to-let properties start flooding the markets (my expectation - late 2013-early 2014).
None of the above prices the risk of further economic deterioration. Yet, as today's Troika statement clearly suggests, we are likely to witness declines in real GNP this year and next - which will do nothing to support price appreciation in the property markets.

I am currently reworking my 2012-2013 forecasts for the property prices in Ireland, so stay tuned for the updates.

Wednesday, September 26, 2012

26/9/2012: Nama valuations & August property prices


As promised - in the last post on today's data release for Irish Residential Property Price Index (RPPI) here's the summary of impact of latest price index movements on Nama valuations.

Note: the figures referenced are approximate and relate to averages of valuations, so these should be treated as a guide. Keep in mind that property prices reaching Nama valuations levels (adjusted for risk-sharing cushion and long-term economic value premium) still imply a loss on Nama books, in my view, due to costs associated with operations, plus the discounts on disposals of properties in volume and over time. Inflation adjustment further increases real loss.

Summary table:

In other words, we need 60%+ uplift on current price levels to achieve a break even on Nama average valuations.

26/9/2012: 2012 forecast for property prices in Ireland


In the previous post I covered main data for August Residential Property Price Index for Ireland. Now, annual forecasts based on data through August:


These imply a cumulated decline of ca3.2% on August 2012 through December 2012, a decline of 2.4-2.5% for Houses, a decline of 3.4-3.5% for Apartments, and a rise of 0-0.25% for Dublin. Obviously, these are not precise figures, so treat with caution.

I currently foresee decline of 51.5% for all properties in 2012 relative to the peak with range of forecasts of 55-61% decline through 2013 relative to peak for all properties index.

I have not updated these figures for some time now - over 6 months so there you go...


26/9/2012: Residential Property Price Index for Ireland, August 2012


Residential Property Price Index for Ireland (RPPI) for August 2012 is out today, triggering a torrent of usual commentary - some optimistic, some more bleak, depending on the focus of the analysis reported. Here are the facts:

Overall RPPI:

  • Index for all properties nationwide has risen marginally to 65.2 in August against July reading of 64.9 and this represents second consecutive monthly rise. M/m index rose 0.46% in August after posting a 0.15% rise in July. 
  • However, index reading remains below May when it stood at 65.5 and marks the third lowest reading in history of the series. 
  • 3mo MA for the overall index is now 64.97 in August and that is below 3mo MA ever recorded in the history of the series.
  • Y/y index fell 11.77% in August, which is an improvement on the fall of 13.58% in July and the shallowest annual rate of decline in any month since February 2011.
  • Overall residential properties prices are now 50.04% below their peak which is an improvement on the absolute bottom level of -50.34% on the peak, albeit statistically-speaking there is no discernable difference.
  • YTD average monthly change in the index is -0.68% and 12mo MA change is -1.03%. In other words, however you spin annual or monthly date, from September 2011 through August 2012 prices have fallen on average at a monthly rate of 1.03%.
Chart to illustrate:

Note, not a factual, but 'interpretative observation, we are seeing some attempts in the market to 'bottom out'. This does not mean that the market will bottom out here, but it does represent a first such instance of an attempt in the market.

Houses prices:

  • Safe as houses stuff prices rose to 68 in August from 67.8 in July marking second consecutive month of increases (in July prices rose 0.296% m/m and in August the rise was 0.295% - both statistically indistinguishable from zero).
  • However, as with overall residential prices, house prices through August failed to regain levels registered in May (68.2).
  • Y/y house prices are down 11.69% in August - slowest rate of annual drop since March 2011.
  • Relative to peak house prices are now down 48.48%
  • YTD average monthly drop is at 0.66% and 12mo MA monthly drop is at 1.03% so the same analysis for dynamics stands as for the overall RPPI above.
Chart on this below (after Apartments analysis).

Apartments prices:
  • Apartments prices firmed up to 46.9 in August from 45.8 in July and are still below the levels attained in June (47.6), implying the index is at the second lowest point in its history.
  • M/m prices rose 2.40% posting the first rise since April 2012. Y/y apartments prices are down 14.57% - the slowest rate of annual decline since February 2011.
  • Relative to peak, shoe boxes (err.. apartments) are now trading at a discount of 62.15%.
  • 12moMA of monthly deflation is at -1.53% and YTD average monthly price drop is -1.59%. Good luck if you are taking any solace from the one month blip.


Dublin prices:

  • Unlike the rest of the country (where I suspect prices changes are driven primarily by thin and selection-biased markets), Dublin property prices have continued steady decline dropping 0.52% m/m in August after 0.35% drop in July. 
  • August thus marks the second consecutive month since prices posted shallow increases in March-May 2012.
  • August also marks the month in which Dublin property prices have hit another record low at 57.3, with the previous record low attained in July (57.6) and in February 2012.
  • Dublin prices are now 57.40% below their peak.


I will be blogging later tonight on my forecasts for 2012 prices and on impact of these prices changes on Nama balancesheet, so stay tuned.

Monday, September 24, 2012

24/9/2012: Irish Building & Construction decline v EU27


Last post on Irish Building & Construction sector data for Q2 2012. Here are the comparatives for EU member states based on current activity (through Q1-Q2 2012) compared to 2006-2007 peak levels:


No need to comment on the above...

24/9/2012: Irish Building & Construction Sector Activity Q2 2012


And in another post prompted by @stephenkinsella tweet, here's an update on CSO data for Irish Building & Construction sector activity:

Ex-Civil Engineering:

  • Value index fell to 17.6 in Q2 2012 from 18.7 in Q1 2012, marking 5.88% decline q/q and down 15% y/y.
  • H1 2012 Value index is down 12.11% on H2 2011 and down 13.78% on H1 2011.
  • Value index fell to 15.5% relative to the peak and volume index declined to 14.66% of the peak level
  • Volume index dropped to 15.6 in Q2 2012 down on 16.7 in Q1 2012, marking a 6.59% decline q/q and 16.6% decline y/y. 
  • H1 2012 volume index was down 13.17% on H2 2011 and down 14.55% on H1 2011.
  • Both Value and Volume indices are now down on an annual basis for 22 consecutive quarters.


Civil Engineering:
  • Value of Civil Engineering activity rose from 58.4 in Q1 2012 to 62.7 in Q2 2012 (+7.36% q/q) and advanced 11/4% y/y, registering the first annual rate of increase after 15 quarters of contraction.
  • H1 2012 value index rose +1.68% on H2 2011 and is up 5.21% on H1 2011.
  • Volume of activity also grew from 52.3 in Q1 2012 to 55.8 in Q2 2012 (+6.69% q/q and +9.8% y/y) also breaking for the first time annualized contraction period of 18 quarters.
  • H1 2012 volume index rose 0.93% on H2 2011 and is up 4.75% on H1 2011.


Residential and non-residential:

  • Residential construction value index fell from 9.1 in Q1 2012 to 8.6 in Q2 2012 (-15.7% y/y and -5.49% q/q). H1 2012 index was down 9.69% on H2 2011 and down 16.51% on H1 2011. Relative to peak, the index is now down 92.45%.
  • Residential construction volume index fell to 7.7 in Q2 2012 from 8.3 in Q1 2012 (decline of 7.23% q/q and down 17.2% y/y). The index is now down 92.53% on peak.
  • Non-residential construction value index fell from 55.4 in Q1 2012 to 51.5 in Q2 2012 (-14.7% y/y and -7.04% q/q). H1 2012 index was down 14.41% on H2 2011 and down 12.23% on H1 2011. Relative to peak, the index is now down 58.23%.
  • Non-residential construction volume index fell from 49.4 in Q1 2012 to 46.0 in Q2 2012 (-15.8% y/y and -6.88% q/q). H1 2012 index was down 15.12% on H2 2011 and down 12.48% on H1 2011. Relative to peak, the index is now down 58.89%.


To sum up: rates of decline are (annually) in double digits and/or accelerating in Q2 2012 in Residential (value and volume), Non-residential (value and volume) and ex-Civil Engineering (value and volume). Residential construction is now at 8.6% of 2005 levels in value terms and 7.7% of 2005 levels in volume terms. Non-residential construction is now at 51.5% of 2005 levels in value terms and 46% in volume terms. Civil Engineering activity is now at 62.7% of 2005 levels in value terms and at 55.8% in volume terms. All activity ex-civil engineering is now down to 17.6% of 2005 levels in value terms and 15.6% in volume terms.

Tuesday, July 24, 2012

24/7/2012: Residential Property Price Index for Ireland, June 2012

So that 'stabilization' in Irish property markets on foot of 0.2% rise in May in the Residential Property Price Index (RPPI) turned out to be just the statistical noise? Looks increasingly so to me. The latest data from CSO is bleak:


"In the year to June, residential property prices at a national level, fell by 14.4%. This compares with an annual rate of decline of 15.3% in May and a decline of 12.9% recorded in the twelve months to June 2011."

Overall residential property prices "fell by 1.1% in the month of June. This compares with
an increase of 0.2% recorded in May and a decline of 2.1% recorded in June of last
year."

Dublin - the 'bright spot of the previous months for the 'green jerseys' hopes on recovery in the property markets has recorded a fall of 1% m/m in June and a 16.4% decline y/y.


"House prices in Dublin are 56% lower than at their highest level in early 2007. Apartments in Dublin are 62% lower than they were in February 2007. Residential property prices in Dublin are 57% lower than at their highest level in February 2007. The fall in the price of residential properties in the Rest of Ireland is somewhat lower at 47%. Overall, the national index is 50% lower than its highest level in 2007."


Charts updates and forecasts later today, so stay tuned.