Showing posts with label Exclusive Irish Economy. Show all posts

Thursday, October 3, 2013

3/10/2013: Irish PMIs - are they meaningful?


Having covered Services and Manufacturing PMIs (see links here: http://trueeconomics.blogspot.ie/2013/10/3102013-services-and-manufacturing-pmis.html) in terms of Q3 2013 averages, let's have a reminder as to the links to actual growth in Irish GDP and GNP these series have.

Two charts covering through Q2 2013:


Thus, overall:

  • Changes q/q in Manufacturing PMIs have only a weak correlation with actual real (constant prices) GDP and GNP changes q/q: R-squares of just 35.6% and 29.4% respectively when we remove the constant factor (which is not significant by itself at any rate). This is weak to say the least.
  • Changes q/q in Services PMIs have only a very weak correlation with actual real (constant prices) GDP and GNP changes q/q: R-squares of just 16.4% and 17.6% respectively when we remove the constant factor (which is significant). This is very poor.
  • With positive intercepts of 0.0023 for GDP and 0.0024 for GNP, the Services PMI R-square rises to 23.7% for GDP and 22.7% for GNP. Once again, no change to the above conclusion.
The above suggests that a significant component of both PMIs come from transfer pricing and not real economic activity on the ground. Or put differently, the PMIs are not that exceptionally meaningful indicators of actual levels of activity in the economy and are only weakly-significant in indicating the direction of that activity. 

Note: this is quarterly averages data, not much more volatile data based on monthly series. Which puts to question monthly movements in PMIs even more...

3/10/2013: Services and Manufacturing PMIs for Ireland: September 2013


In the previous posts I covered separately both Service PMI for Ireland and Manufacturing PMI (released by Markit & Investec). As noted, both series show strong performance in September. Here is the combined analysis:

Both Services and Manufacturing PMIs are now above their historical crisis-period averages. Manufacturing PMI is slightly ahead (0.1 points) of its historical pre-crisis average since May 2000 when both series start running coincidently. Services PMI is now slightly below its historical pre-crisis average.

Services PMI have broken out of the flat trend and are now trending up for the last 12 months. However, Manufacturing PMI continues to move side-ways, although on average remaining positive.


Two major points: September 2013 reading puts both indices at statistically significant levels above 50.0, which is the first such occurrence since February 2011:


In addition, we are seeing stronger positive correlation between the two indices (the 12mo rolling correlation below is only indicative) established since February 2013 low:


In other words, both sides of the economy are now performing better, but we need this momentum to be sustained over 2-3 months to see serious feed-through into actual economic activity figures.

Tuesday, October 1, 2013

1/10/2013: Irish Manufacturing PMI: September 2013


Some good readings from Irish Manufacturing PMI (Investec-sponsored Markit data) for September:

  • Headline PMI is at 52.7 up on 52.0 in August and the highest reading since 53.9 in July 2012.
  • Critically, this appears to be the first statistically significant reading above 50.0 since November 2012.
  • I use 'appears' above since we have no formal analysis from Markit on this (Investec don't do analysis). The distribution is Laplace. August reading was close to being statistically significant.
  • In terms of trend, Q1 2013 average reading was 50.13, Q2 2013 at 49.33, Q3 now reads 51.9. 
  • 12mo MA is at 50.8.
  • 3mo MA through September 2013 is at 51.9, which is below the same period 2012 (52.2), but ahead of 2011 (49.2) and slightly ahead of 2010 (50.4).

Now, it appears we have broken the downward trend at last. Index volatility (36mo rolling) has fallen slightly to around 2.3 in terms of 3mo average through September, which is close to historical average of 2.4 and is well below the crisis-period average of 3.4. Positive skew on change is at 3mo average of +0.75 (for deviations from 50.0) and this contrasts with a negative -0.34 skew for historical data and -0.25 skew for crisis period data. So let's call it a trend reversal for the short term:


Sadly, nothing else to report, since Investec/Markit continue to push out data-less releases. Wish I could tell you about employment, exports orders, total orders... but there is not a single number in the press release, only comments.

Sunday, September 29, 2013

29/9/2013: Irish Retail Sales: August 2013


Retail Sales Index data was out last week and this is an update on series through August 2013.

From the top (excluding motor sales), 
  • Retail sales activity by value declined from 97.4 in July to 96.0 in August 2013. Current 3mo MA is 96.1 which is still ahead of the 3mo MA through May 2013 at 95.2. Year on year August 2013 reading was down 0.21%. 6mo MA is a 95.7 which is lower than 6mo MA through February 2013 at 96.7. 
  • Value reading in August 2013 stood at exactly the 12mo average for 2012 and 3.47% below annual average for 2005. Crisis period average is 100.6 which is significantly higher than the August reading and 3mo MA reading through August and 6mo MA arcading through August.
  • Retail sales activity by volume remained largely unchanged (statistically) between July (100.9) and August (100.7). Current 3mo MA is 100.3 which is ahead of 99.1 3mo MA through May 2013. Year on year the index is up 1.31%. However, 6mo MA through August at 99.7 was lower than 6mo MA through february 2013 (100.4).
  • Volume reading in August 2013 was 2.22% below crisis period average and 2.22% ahead of 2005 average.

The above figures illustrate the extent of deflation in the sector, where volume activity stayed more buoyant than value activity. Which means retailers have been burning through margins for a good part of five years now. There is severe doubt as to whether there are any profit margins left in the sector. 

Meanwhile, Consumer Confidence indicator is moving sideways, as ever detached from reality. ESRI's Consumer Confidence Index in August 2013 stood at 66.8, only slightly catching up to the downside with the overall retail trade stats, declining from 68.2 in July. CCI is now at blistering 68.5 3mo MA which is massively up on 60.0 3mo MA through May 2013. Year on year the CCI is down 4.6% signalling the index desperate attempt to claw back toward reflecting the trends in the sector.


However, as the chart below clearly shows, the Consumer Confidence Index continues to show no signs of coinciding with the broader retail sector trends.


To remind you, crisis-period correlations between CCI and retail sales are negative: -0.70 for correlation with Value of sales and -0.59 for correlation with Volume of sales. The CCI used to perform better in pre-crisis period, when strong trend in sales was evident. 

My own Retail Sales Activity Index (a composite of there measures weighted by relevance to employment and revenue generation) dipped slightly to 109.4 in August from 110.7 in July. The index is down 0.75% y/y. 3mo MA is at 110.0 in August and this is above 105.9 3mo MA through May 2013. RSAI has modest positive correlation with crisis-period data: value at 0.59 and volume at 0.63.


Overall: weak data for August, despite the fact that pre-school season was running at the time when weather did not impede shopping and given that overseas travel for summer breaks was low this year once again. September will be more important to watch to see how the sales and confidence are moving in advance of key shopping season in November-December.

Friday, September 20, 2013

20/9/2013: Domestic Economy: Continuing Its Sextuplet Dip in Q2 2013

Total Domestic Demand is defined as :

  • Consumer Spending on goods and services + 
  • Government Spending on Current (as opposed to capital) goods and services + 
  • Gross Fixed Capital Formation (basically gross investment) + 
  • Change in Stocks of goods and services in the economy. 

In a more old-fashioned way, it is Investment + Consumption + Net Government Spending.

Put differently, this is the domestic economy (excluding exports net of imports, and outflows of income to the rest of the world net of inflows of income from the rest of the world).

Now, here are the quarterly changes in the domestic economy from 2007 on, for real (constant prices) seasonally adjusted series:


I define 'dips' in the above series similar to the official definition of a recession: two consecutive q/q downward movements. Remember, we have been told since Q2 2010 that the Irish economy has 'stabilised' and even 'returned to growth'. Since then we had: eight quarters of contraction and four quarters of growth in Total Domestic Demand.

The two core drivers downward in the domestic economy on q/q basis are:

On the good news side, q/q increase in Personal Consumption component (above) and external trade (below):

And external trade showing strong performance on q/q basis, which, alas, only partially offsetting the decline recorded in Q1 2013...


And this concludes my analysis of the QNA for Q2 2013.

20/9/2013: H1 2013 QNA: Domestic Economy vs External Trade

In the previous two posts I looked at Q2 national accounts for Ireland in terms of headline GDP and GNP figures, y/y and q/q changes in the first post; and half-yearly figures analysis in the second post. The headline conclusion was that:
  • Q2 2013 real (constant prices) GDP performance is weak, but posits some growth, pushing us out of official third dip recession. 
  • Irish real GNP fell 0.1% in Q2 2013 compared to Q2 2012, having only marginally reversed the 6.01% y/y rise recorded in Q1 2013. 
  • Broadly-speaking, H1 figures show continued economic performance within the new structural range of slower economic activity that set on with the 'recovery' of H2 2010 (the Celtic Canary period).
  • Crucially, moving to less volatile half-yearly figures, Y/Y Irish real GDP fell 1.10% in H1 2013, marking a second consecutive 6-months period of declines (it was down y/y 0.75% in H2 2012 as well). 
  • Y/Y Irish real GNP rose 2.87% in H1 2013, marking third consecutive 6-months period of increases in GNP.
  • At current rates of growth (that is taking 3-year average, since current annual rate is negative), it will take us until 2029 before we can reach real levels of GDP consistent with the pre-crisis levels. 


Now, let's take a look at the underlying components of GDP and GNP from the expenditure side of the national accounts. Since we have half-yearly data, we might as well focus on longer-term, more stable series. For this purpose, let us also look at nominal (not real) values, so we have some idea as to actual activity on the ground, reflective of price changes, as well as volumes changes. There are several reasons for doing this:
  1. Nominal values, expressed in current prices are actually linked to what we get paid, what we pay for and what the economy produces;
  2. Nominal values are also reflective of what the Government spends, collects and what the potential for debt servicing is when it comes to economy's output; and
  3. Nominal values are free from the impact of the inflation adjustments, which are made based on 'average' households and firms, rather than on what we do observe in the economy itself.

There are drawbacks to this analysis, so like everything else in economics, this is not intended to be 'completely and comprehensively' conclusive.


As can be seen from Chart above, Personal Expenditure on Goods and Services rose 0.4% y/y in H1 2013 - which is good news. However, the same was down on H1 2011 (recall that the Government is keen on claiming that consumer confidence and consumption spending rose during its tenure, which is obviously contradicted by the data we have). Compared to peak pre-crisis performance (peak referencing output peak, not specific series peak), we are down 10.61% on H1 2007.

Understandably, Government spending (net of tax receipts) is down when it comes to current goods and services (as opposed to capital goods and services): -2.11% on H1 2012, -4.27% on H1 2011 and -12.46% on H1 2007. You might think this is 'huge', but y/y over the first 6 months of 2013 our net current Government spending is down only EUR 278 million and when it comes to vast/deep cuts since 2007, H1 2007 spending was cut EUR1,754 million by the end of H1 2013.

Meanwhile, Gross Fixed Capital Formation (basically investment in the economy) is down 9.40% in H1 2013 compared to H1 2012, down 14.09% compared to H1 2011 and down 67.73% compared to H1 2007. The reductions in capital investment jun H1 2013 compared to H1 2007 are ten-fold the size of reductions in current Government spending at EUR17,542 million. For another comparison, reductions in personal expenditure on goods and services by households over the same period is EUR4,757 million.

Put in different terms, domestic economy is still falling, with no stabilisation in sight.

Next: external trade and GDP & GNP series:


Exports of goods and services - the only part of the economy that was booming (+15.94% in H1 2013 on H1 2007 and +5.44% on H1 2011) are hitting some bumps. H1 2013 posted a decline in total exports of 0.67% y/y. Meanwhile, imports of goods and services were up 0.08% y/y. As the result of this, our trade balance fell 2.32% y/y in Q2 2013 and is down 3.15% y/y for H1 2013. This is not good, as key Exchequer projections and debt sustainability analysis require healthy growth in trade surplus, not a decline. But more on this below…

GDP at current prices fell 1.49% in H1 2013 compared to H1 2012 and is down 0.28% on H1 2011 and down 15.26% on H1 2007. Recall that our real GDP fell 1.10% y/y in H1 2013. In other words, there is no growth in actual underlying activity. This is pretty bad. Actual euro notes we have in the economy's 'pockets' at the end of H1 2013 (as imperfectly measured by GDP) were fewer than at the end of H1 2012 and H1 2011. And these fewer euros were not worth more, either. I wouldn't call this 'stabilisation'.

Net factor income outflows abroad are falling as well and I commented on these in the previous posts.

GNP expressed in current market prices is 2.32% ahead in H1 2013 compared to H1 2012 and 2.92% ahead of H1 2011. This is good news, especially since GNP is a more accurate reflection of our real economy's output (also rather imperfect) than GDP. Not so good news: GNP is still down 17.53% on H1 2007. 

Chart below drills into the composition of our external trade:


The above clearly shows the massive swing of our external trade activities from goods sectors to services sectors. And on imports of goods side it shows the legacy of the consumption bust, which remains one of the two largest drivers for improved external trade statistics we see on national accounts.

Finally, total domestic demand: the measure of the economy that covers all domestic activities of private and government consumption and investment combined, plus chafes in stocks.


As the above shows, domestic economy continues to suffer losses in activity: Total Domestic Demand fell 0.95% in H1 2013 compared to H1 2012 and is down 3.05% on H1 2011. Compared to H1 2007, Total Domestic Demand is down 27.41%.

Summary: Bad news: Despite improvements in real variables in Q2 2013, domestic economy continued to contract in H1 2013, with domestic demand down compared to H1 2012, driven by declines in Net Government Current Expenditure and in Gross Fixed Capital Formation. Good news is that decline in domestic demand was ameliorated by a marginal increase in Personal Expenditure on Goods and Services. On the bad news side, exports of goods and services fell in H1 2013 compared to H1 2012. These changes, together with domestic demand movements resulted in GDP falling in H1 2013 compared to H1 2012. Lower rate of profits repatriation out of Ireland by the MNCs has resulted in an increase in GNP in H1 2013 compared to H1 2012.


In simple terms, if Irish economy were a student asking for a report card for H1 2013, I don't think there would be much on it worth boasting about. Let's hope H2 2013 will be different for the better.

Thursday, September 19, 2013

19/9/2013: First Half 2013: Irish GDP and GNP growth divergence

CSO published Q2 national accounts for Ireland today and these are worth detailed analysis, which I will break up into a series of posts next. 

In the previous post, I covered headline GDP and GNP figures, y/y and q/q changes. As a reminder, the headline conclusions were that:
  • In Q2 2013 Irish real GDP fell 1.17% on Q2 2012, marking the fourth consecutive quarter of real GDP contractions, the longest period of continuous contractions since the end of Q2 2010. 
  • Irish real GNP fell 0.1% in Q2 2013 compared to Q2 2012, having only marginally reversed the 6.01% y/y rise recorded in Q1 2013. 
  • On quarterly basis, seasonally-adjusted Q2 2013 real GDP rose 0.45% on Q1 2013, ending the third spell of the recession that lasted from Q3 2012 through Q1 2013. The expansion, however was weak and well below the one recorded during the previous recovery periods. 
  • I am continuing to expect that Q3 2013 will post stronger performance than Q2 2013 with possible GDP q/q upside of closer to 1%.


Now, let's move onto H1 (first half of 2013) analysis.

Q2 2013 release allows us to look at half-annual GDP and GNP changes, something that removes some of the quarterly volatility and also brings us closer to the analysis that is relevant from the budgetary perspective. Remember, budgets are not based on quarterly forecasts, but annual ones.

H1 2013 GDP at constant prices seasonally adjusted fell 0.47% on H2 2012, marking the third consecutive half-yearly period of declines. Last time we had a half-yearly period of growth was in H2 2011.

H1 2013 GNP grew 2.17% over H1 2013 compared to H2 2012, marking the third consecutive 6-months period of growth. In other words, GNP perfectly countermoves against GDP. Why? Because of the changes in transfers of earned profits by the multinationals. 


Here's an interesting thing. The chart above shows three periods of Irish growth history (I am being sarcastic/humorous here, so no offence intended): 
  1. The Celtic Tiger period - for which we have consistent data here is only covered by the period from 1997 through 2000: averaged H/H growth rates of 4.49%;
  2. The Celtic Garfield period - which lasted roughly from 2001 through H1 2007; Celtic Garfield period growth averaged 2.51%; and
  3. The Celtic Canary period (as the proverbial one in the EU's economic model coal mine) that started with the imaginary 'recovery' of 2010 and is running currently: averaged growth of 0.24% (do remember, that excludes the period of massive contraction between H2 2007 and H2 2009 when the average rate of growth was -2.0% H/H)

You can see that the slowdown in growth is not only due to the crisis, but appears to be structural in nature. The Canary part is because Irish economy's fundamentals are such that we should be growing at 3.5-4.5 percent annually. Yet we are growing at - say averaging Celtic Garfield and Celtic Canary periods - at 1.35-1.4 percent annually. This is the slowdown toward the European levels of growth for Ireland... something to think about?

Next, take a look at the levels of activity based on 6 months figures:


And now, let's talk about year-on-year changes in H1 2013:
  • Y/Y Irish real GDP fell 1.10% in H1 2013 (in other words, against H1 2012), marking a second consecutive 6-months period of declines (it was down y/y 0.75% in H2 2012 as well). 
  • Y/Y Irish real GNP rose 2.87% in H1 2013, marking third consecutive 6-months period of increases in GNP.
  • Overall, H1 real GDP (non-seasonally-adjusted) was up 1.65% on H1 2010 when we first heard about the 'recovery' of Irish economy or 'stabilisation'. Thus over 3 years, our GDP grew 1.65% - producing average annual rate of growth of 0.55%. Not exactly stellar, but better than nothing.


Our current H1 2013 GDP is down 7.98% on peak levels, so we are still far away from recovering to pre-crisis levels in real terms. In fact, at current rates of growth (that is taking 3-year average, since current annual rate is negative), it will take us until 2029 before we can reach real levels of GDP consistent with the pre-crisis levels. When someone says we have a lost decade, what they really mean - in real GDP terms - is that we are likely to have lost 23 years. And that does not count the opportunity cost of foregone growth. That is one hell of a long 'lost decade'.

To summarise the above: Good news is: real GNP is up 2.87% y/y, and up for the third consecutive 6-month period. Bad news is: our real GDP is down 1.1% y/y and this marks second consecutive 6-month period of declines.

I expect growth to be positive in H2 2013, with y/y around 1.0-1.2%.  Which should push our full year growth closer to zero.


Stay tuned for more analysis of QNA results.

19/9/2013: Irish GDP and GNP: Q2 2013 & the 'end of the third recession'

CSO published Q2 national accounts for Ireland today and these are worth detailed analysis, which I will break up into a series of posts next. 

Starting with the headline GDP and GNP figures:

In Q2 2013 Irish real (constant prices) GDP fell 1.17% compared to Q2 2012, compounding the previous fall of 1.04% y/y recorded in Q1 2013. On an annual basis, this marks the fourth consecutive quarter of real GDP contractions, the longest period of continuous contractions since the end of Q2 2010. Currently, real GDP stands 7.83% below the historical peak.

At the same time, Irish real GNP fell 0.1% in Q2 2013 compared to Q2 2012, having only marginally reversed the 6.01% y/y rise recorded in Q1 2013. Despite a surprisingly robust rise in Q1, Q2 2013 real GNP stood 10.40% lower than pre-crisis peak.

The swing in the direction between GDP and GNP was driven in Q2 2013 by a 5.85% drop in the outflows of transfer payments to the rest of the world compared to Q2 2012, which compounded a massive 28.26% decline in the transfer payments recorded in Q1 2013. In other words, GNP improvements appeared to have been sustained by a massive parking of MNCs profits in Ireland. The reasons for this are unknown, but we can speculate that the MNCs are holding back profits from transferring out of Ireland due tot ax considerations and due to subdued global investment activities. It remains to be seen what happens to the GDP and GNP were the MNCs to begin once again actively exporting retained earnings.


Note: shaded periods show episodes of more than 2 quarters consecutive contractions (here on y/y basis, so these are not official recessions)

On quarterly basis, seasonally-adjusted series:

Q2 2013 real GDP rose 0.45% on Q1 2013, partially compensating for the 0.59% contraction in Q1 2013 and ending the third spell of the recession that lasted from Q3.2012 through Q1 2013. The expansion, however was weak and well below the one recorded during the previous recovery periods. For example in Q1 2010, the end of the second recessionary dip, GDP expanded by 0.82%. The end to one-quarter drop of Q2 2010 led to a GDP rise of 1.08% in Q3 2010, the end of one quarter contraction in Q4 2010 was followed by 1.48% expansion in Q1 2011 and 1.38% expansion in Q2 2011, even the end of Q1 2012 quarterly decline was marked by a 0.48% expansion in Q2 2012. In previous episodes, recovery that was associated with growth rates at below 0.7% q/q was swiftly followed by the subsequent quarter contraction in GDP. This suggests underlying weakness in the GDP performance in Q2 2013, although my personal expectation is that Q3 2013 will post stronger performance than Q2 2013 with possible GDP q/q upside of closer to 1%.

On GNP side, seasonally-adjusted real GNP fell 0.37% in Q2 2013 in q/q terms, ending two consecutive quarters of quarterly growth (Q1 2013 growth was robust 2.2% q/q and Q4 2012 growth was weak at 0.32%).

Two charts:


Note: shaded periods show episodes of more than 2 quarters consecutive contractions (here on q/q basis, seasonally adjusted, thus representing official recessions).

On historical comparison basis, table below summarises latest movements in GDP and GNP:


So a summary: we are officially out of the third dip of the Great Recession. This is a good news. 

Bad news is that this data is once again being paraded around as a sing of 'stabilisation' of economic activity. Alas, the first time we've heard this 'stabilisation' argument was in Q1 2010, when the main - longest and deepest - second dip ended. Since then, Irish economy has managed to grow by just 2.63% in real GDP terms and only 3.54% in real GNP terms. Since the onset of the recovery, we have posted average quarterly growth of only 0.18% (seasonally-adjusted figures) and this effectively means that the economy is in a stabilisation pattern closer to coma than to a sustained recovery.

Good note to all of this is that, as mentioned above, I do expect stronger activity to be recorded for Q3 2013 and possibly for Q4 2013 as well.

Friday, September 6, 2013

6/9/2013: Euromoney Country Risk Survey: Upgrading Irish Banking Sector Risks Outlook

Some good news for Ireland out of a number of surveys today. First, BlackRock Investment Institute survey of country experts shows Ireland improving economic outlook 6 months forward - details here: http://trueeconomics.blogspot.ie/2013/09/692013-blackrock-institute-survey-north.html

Now, Euromoney Country Risk survey shows significant improvements in market experts assessment of Irish banking sector stability:


While both reflect opinions of experts, including experts within the specific sectors, the two are good indicators of the general direction toward gradual improvement in country economic outlook. Let's hope the Budget 2014 and mortgages arrears workouts do not derail this trend.

Thursday, September 5, 2013

5/9/2013: Services PMI: August 2013

With a delay (due to extenuating circumstances) - here's my analysis of dynamics of the Services PMI for August for Ireland.

Yesterday's reading on Services PMI was spectacular by all measures:


  • Headline  index rose to 61.6 in August 2013, the highest reading since February 2007 and 19th highest reading in history of the index.
  • August reading marked the third consecutive month of index reaching statistically significant levels of growth.
  • 12mo MA is now at expansionary 55.6, 6mo MA at 55.7 and 3mo MA at 58.0. These readings should signal a break in the third recessionary dip we have experienced.
  • Current 3mo MA is solidly ahead of 3mo MA through May (53.4) and is ahead of same averages for 2012, 2011 and 2010.
The most critical bit, however, is that this is the first time now that the PMI has breached the levels consistent with the pre-crisis activity. This is not to say we are heading for 4.4-4.6% annual GDP growth, but it is significant nonetheless. 


All-in - very solid expansion, very solid reading and starting from actually high levels of activity to begin with.

We do not have - courtesy of Investec and Markit deciding to cut back the information they release to us, mere mortals - the actual composition details or the breakdown by sector. However, per Markit release, most of the growth is accounted for by booming IFSC. The overall Services PMI is very significantly skewed in the direction of MNCs (as I showed on a number of occasions).

Monday, September 2, 2013

2/9/2013: Irish Manufacturing PMI: August 2013

Markit/Investec Irish Manufacturing PMI out for August today. As usual - no data on sub-indices, no statistical analysis released.

Headline reading improved to 52.0 in August, up on 51.0 in July, marking the highest reading since November 2012 when it stood at 52.4 and the third highest reading in 12 months. Release from Markit is here. My analysis as follows:

  • 1.0 points gain on July is a decent number. We are now into third consecutive month of nominal seasonally-adjusted readings above 50.0. All of these are good signs.
  • Another good sign: 12mo MA is now at 50.8 and 3mo MA is at 51.1. This implies that 3mo MA is ahead significantly over 48.8 reading for 3mo through May 2013. However, on a negative side, 3mo MA through August 2013 is down on 52.6 recorded for the 3mo through August 2012, although it is ahead of 3mo MA for the same period in 2011, and down on same period average for 2010.
  • Cautionary signs: current reading is still below statistically significant levels (ca 52.2), although we are in a Laplace distribution (as I noted earlier, based on higher moments). Last time the index was reading statistically above 50.0 was in November 2012.
  • Another note of caution: Q3 2013 to-date averages at 51.5 - nice number, but recall that in a contractionary Q1 2013, PMIs averaged above 50.1. Nonetheless, good news - the index for Q3 2013 to-date is above both Q1 and Q2 readings. 
Trends illustrated:


Note strong departure from 6mo MA in the chart above, which is encouraging; and in the chart below, note that we have finally reached above the crisis-period average for the index.


Another good news bit is that we have moved closer to confirming the index breakout from the downward trend that run from July 2012 through June 2013. One-two months more of this performance and we can be moving onto a new trend:


Summary: overall, decent performance by manufacturing PMI in August. 

I cannot confirm any of the statements made by Markit/Investec, and note: I have not seen Investec usual longer release so far. However, per Markit, all three main sub-sectors have posted increases in output in August, and "new orders rose for the second successive month, and at a solid pace that was the strongest since July 2012". No idea where actual indices readings are at. "Meanwhile, employment continued to rise, extending the current sequence of job creation to three months. However, the pace of increase slowed over the month." Again, no idea as per actual readings.

Friday, August 30, 2013

30/8/2013: Retail Sales Dynamics: July 2013

Retails sales stats for July 2013 were released yesterday amidst a torrent of data releases for Ireland this week. With slight delay, here's my take on the core numbers. All referencing seasonally-adjusted data.

Core (ex-Motors) retail sales improved in value in July on seasonally-adjusted based, posting a rise of 2.32% m/m and 1.46% y/y.

  • Current 3mo MA is at 95.9 - which means that value of sales is running at 4.1 percentage points below 2005 levels of activity. Previous 3mo MA was 95.5, which means the over the last 3 months there was virtually no growth in the value of retail sales compared to 3 months prior.
  • Current 6mo MA is at 95.7 and this compares to higher 6mo MA for the previous period which stood at 96.8. In other words, last 6 months activity in retail sales, as measured by value, was lower than previous 6 months period.

Core (ex-Motors) retail sales improved in volume in July on seasonally-adjusted based, posting a rise of 1.31% m/m and the same y/y.

  • Current 3mo MA is at 99.9 - which means that volume of sales is running at 0.1 percentage points below 2005 levels of activity. Previous 3mo MA was 99.2, which means the over the last 3 months there was some growth in the volume of retail sales compared to 3 months prior.
  • Current 6mo MA is at 99.6 and this compares to higher 6mo MA reading for the previous period which stood at 100.5. In other words, last 6 months activity in retail sales, as measured by volume, was lower than previous 6 months period.
Meanwhile - a reminder - Consumer Confidence, measured by the ESRI has deteriorated m/m by 3.40% and there was a marginal rise of 0.74% y/y.
  • Current 3mo MA is at 66.7 - which means that consumer confidence over the last 3 months period is running ahead of previous 3mo MA of 59.4. Broadly-speaking Consumer Confidence indicator moved in-line with core retail sales in value and volume over the 3mo periods.
  • Current 6mo MA reading for Consumer Confidence is at 63.1 and this compares to lower 6mo MA reading for the previous period which stood at 59.8. In other words, Consumer Confidence continues to countermove vis-a-vis retail sales indices on 6mo average basis.
Couple of charts. First one illustrates three core indicators:

 
Chart above continues to show generally negative correlation between actual retail sales and Consumer Confidence indicator, as well as the general flat-line trend in the retail sales series for both indices over the last 20-21 months.

Next, relationship between Consumer Confidence and retail sales indices:


Lastly, my own Retail Sector Activity Index (RSAI) that take into the account dynamics and levels of all three indices: CSO's Retail Sales Indices (Value and Volume) and ESRI's Consumer Confidence index:


Per above, RSAI continues to run within the broad confines of the flat-trend average, with uptick in July being much flatter than in previous months.

Note: here are correlations between all four measures of retail sector activity health:

Summary conclusion: things are improving, but the sustainability of improvement is questionable, with 3mo averages divergent from 6mo averages. Consumer Confidence remains largely irrelevant to actual outcomes delivered by the sector. The base of activity remains low and we are now into 5 years-plus of effectively unchanging 'bouncing along the bottom' activity. 

Friday, August 23, 2013

23/8/2013: IMHO statement on Mortgages Arrears for Q2 2013

Irish Mortgage Holders Organisation (IMHO) issued opinion on today's mortgages arrears figures: https://www.mortgageholders.ie/another-false-start-in-resolving-mortgage-crisis/

My detailed analysis of the figures is here: http://trueeconomics.blogspot.ie/2013/08/2382013-irish-mortgages-arrears-q2-2013.html

23/8/2013: Irish Mortgages Arrears: Q2 2013


Mortgages rears figures are out for Q2 2013 and guess what, things are (predictably) getting worse. I am sure the Government will say that 'getting worse today'='getting better in the future'. As such, we do live in the world where stabilisation = decline in the rate of decline, while a slight uplift on any time series is greeted as an indisputable 'gathering growth momentum'.

What do the numbers of mortgages arrears tell us, spin aside? I highlight main conclusions in bold.

In Q2 2013 there were 919,139 mortgages accounts outstanding (EUR139,883 million in total), of which 770,610 accounts were for primary residences (EUR109,147 million). Primary residences are referenced as PDH accounts in CBofI. The balance of 148,529 accounts  (EUR30,626 million) relate to Buy-to-lets, BTLs.

This means that over the year through the end of H1 2013, the number of mortgages accounts rose 0.4% and their outstanding volumes fell 2.41%. Deleveraging is very slow in the economy, given the crisis scope: number of primary mortgages accounts rose 0.7% and their volume shrunk 2.52%, while the number of BTLs fell 1.1% and their volume shrunk 2.01%. In fact, as the chart shows, deleveraging process so far is not helping the workout of arrears:


Total number of primary accounts in arrears of any duration is up 11.46% y/y, underlying volume of mortgages represented by these is up 9.1% to EUR25.69 billion from EUR23.55 billion a year ago, while amounts in arrears are up 36.46%, breaching EUR2 billion for the first time. This means that, penalties inclusive, the arrears are now attracting ca EUR202 million in roll up charges annually or about 40% of the annual savings that we need to deliver in Budget 2014 from the social welfare funds.

Total number of BTLs in arrears was up 15.06% y/y and the amounts of mortgages outstanding for the BTLs in arrears rose to EUR10.94 billion - up 11.45% y/y, while the actual cumulated levels of arrears hit EUR1.207 billion, up 43.63% y/y.

All in, there were 182,840 accounts in arrears, representing cumulative amount outstanding of EUR36,634 million and cumulated arrears of EUR3,231 million. These were up: +11.39% y/y for account numbers (+19,924 accounts), +EUR3.267 billion or 9.79% y/y for mortgages outstanding, and +EUR 907 million or +39.05% y/y for actual arrears.


Repossessions accelerated, but remained subdued overall, rising to 1,503 accounts (1,001 accounts for primary residences). This represents a y/y increase of 13.69% for all accounts, 6.04% rise for primary residences and 32.8% jump for BTLs.

Restructured mortgages numbers declined in Q2 2013, from 106,612 accounts to 100,920 accounts over the period of 12 months through June 2013. This breaks down as per decline of 6.57% for primary residences from 84,941 to 79,357 accounts, and a decline of just 0.5% for BTLs from 21,671 to 21,563 accounts.

Performance of restructured mortgages somewhat improved, although we do not know as to why this was the case. Restructured mortgages that were not in arrears as percentage of the total number of restructured mortgages has improved from 47.35% to 53.31% for primary mortgages, and from 51.17% to 61.13% for BTLs.


And some scarier figures for the end:
  • Total number of mortgages at risk of default or defaulted (mortgages in arrears, mortgages restructured and not in arrears, and repossessions) rose to 239,834 in H1 2013 (up 11.27% y/y)
  • Total number of primary mortgages at risk or defaulted rose to to 186,202 in H1 2013 (up 9.94% y/y)
  • Total number of BTL mortgages at risk or defaulted rose to to 53,632 in H1 2013 (up 16.12% y/y)
  • 20.26% of all primary residential mortgages were in arrears or at risk of default in Q1 2013, against 18.50% in Q2 2012.
  • 36.11%of all BTL mortgages were in arrears or at risk of default in Q1 2013, against 30.75% in Q2 2012.
  • 26.09% of all residential mortgages were in arrears or at risk of default in Q1 2013, against 23.55% in Q2 2012.
  • By volume of mortgages outstanding, 33.35% of the total mortgages pool or EUR46,618 million were mortgages either in arrears, or restructured at the end of Q2 2013, up on 29.51% (or EUR42,258 million) at the end of Q2 2012.


Friday, August 2, 2013

2/8/2013: Irish Manufacturing PMI: July 2013

Manufacturing PMI for Ireland was out yesterday. And as usual, it was worth waiting and giving the Irish media time to get through their circus of 'analysis'. The excitement of 'growth' predictions aside, here's the raw truth about the numbers (please, keep in mind that shambolic data coverage by Markit press-release is no longer conducive to any serious analysis of the underlying components of the PMIs). Note: PMI for Ireland are released by Investec and Markit.

All we have is the headline number. On the surface, headline Manufacturing PMI moved from 50.3 in June to 51.0 in July. Both numbers are above 50.0 and thus suggest expansion. This marks two consecutive months of growth.

However, there are some serious problems with the above. Read on:
-- At 51.0, July PMI is barely above 12 mo average of 50.7.
-- 3mo average through July is at 50.3, ahead of 49.4 3mo average through April 2013 - which is good news.
-- In July 2012, PMI was at 53.9 which was statistically significantly above 50.0 (in other words, statistically we did have growth in July 2012, which turned out to be pretty disastrous year for manufacturing and industry as we know). And in July 2013 at 51.0 there is no statistically significant difference in current PMI reading from 50.0, which means - statistically-speaking - we do not have growth.
-- Current 3mo MA at 50.3 is not different from 50.0 statistically
-- Current 3mo MA is below that in 2012 (52.7), ahead of that in 2011 (49.9) and below that for 2010 (52.4) - which is not exactly confidence-inspiring, right?
-- M/m (recall, these are seasonally-adjusted numbers) there was a rise in PMI of 0.7 (slightly better than m/m rise of 0.6 in June 2013). Alas, this monthly rise was also statistically indifferent from zero.

Here are two charts that illustrate the above points.


In short - good news is that PMI is reading above 50 and strengthened in July compared to June. Bad news is that statistically-speaking, neither the reading levels (in both June and July), nor increases m/m (in both June or July) are significant. Which means that we simply cannot will away the caution in reading the PMI numbers this time around.

Wednesday, July 31, 2013

31/7/2013: Retail Sales Dynamics: June 2013

Retail sales stats are out for June and anticipation (based on the booming Consumer Confidence index from ESRI) was for a significant uplift in sales. Alas, things turned out to be not what some expected. All data seasonally-adjusted.

  • Value of core (ex-motors) sales fell 0.73% m/m in June and was up 1.28% y/y. 
  • 3mo average through June 2013 stood at 95.1 down on 3mo average through March 2013 at 96.0.
  • 6mo average through June was at 95.5, down on 96.8 6mo average through December 2012.
  • Value of core sales in June 2013 was 5.75% below the average for the entire crisis period
  • Volume of core (ex-motors) sales fell 0.50% m/m in June and was up 1.21% y/y.
  • 3mo average through June 2013 stood at 99.2 down on 3mo average through March 2013 at 99.5, although the difference was minute.
  • 6mo average through June was at 99.4, down on 100.4 6mo average through December 2012.
  • Volume of core sales in June 2013 was 3.74% below the average for the entire crisis period.
Meanwhile, Consumer Confidence shot up 15.4% in June m/m and is up 13.3% y/y. 3mo average from consumer confidence is at 63.6 which is above 3mo average through March 2013 at 61.2. 6mo average is practically identical to 6mo average through December 2012.


Charts above show clear disconnect between retail sales (volume and value) and the reported consumer confidence index. The disconnect is bizarre. Firstly, neither current, nor lagged average consumer confidence has much to do with either volume or value of what consumers opt to purchase. Worse, since June 2008 through June 2013, Irish retail sales indices correlations with Consumer Confidence are -0.66 for value index and -0.60 for volume index. In other words, rising Consumer Confidence in Ireland tends to be associated with falling retail sales. It is worth noting that prior to the crisis - in January 2005 - December 2007 period, the above correlations were +0.72 and +0.74 respectively.

My own Retail Sector Activity Index has had a better fortune tracking overall activity in the retail sector:

 The above clearly shows the sustained 'flat at the bottom' period of retail sales overall activity (by weighted contributions of volume, value and forward confidence). The recent rise in the activity, driven so far solely by two factors: year-on-year dynamics still impacted by the losses made in May-June 2012  and by the bizarre rise in consumer confidence. It remains to be seen if the index can hold near a 14 months period high attained in June.

Wednesday, July 17, 2013

17/7/2013: Sunday Times, July 14: The New Normal for Ireland

This is an unedited version of my Sunday Times article from July 14, 2013.


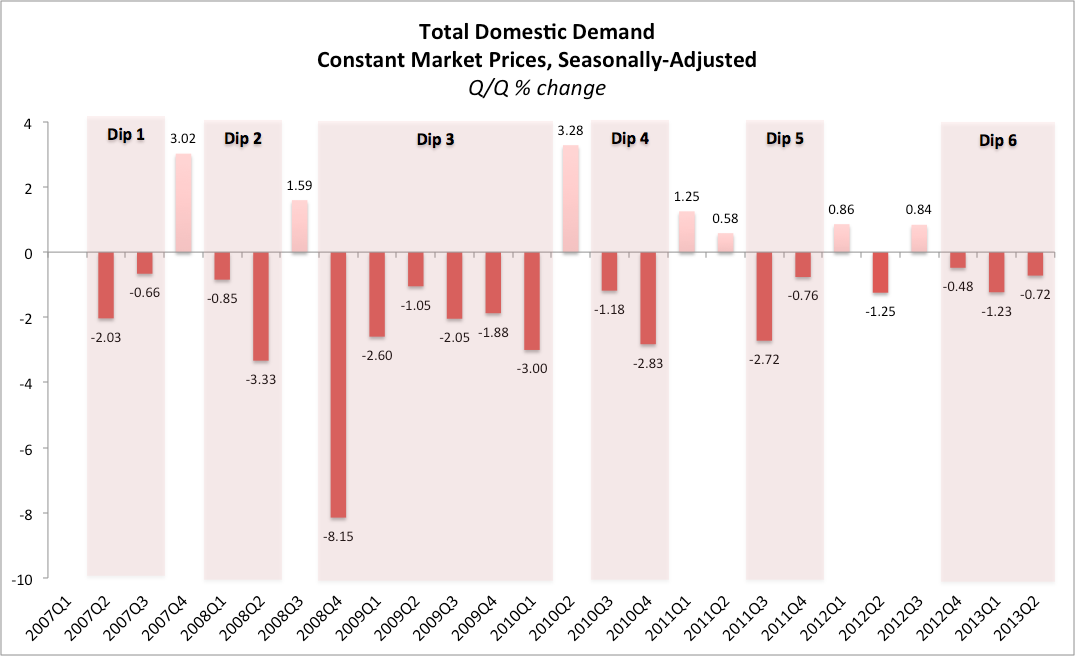
The release of the Irish quarterly national accounts for Q1 2013 two weeks ago should have been a watershed moment for Ireland. Aside from confirming the fact that Irish economy is back in a recession, the new figures reinforce the case for the New Normal – a longer-term slowdown in trend growth and continued volatility of economic performance along this trend. The former revelation warrants a change in the short-term policies direction. The latter requires a more structural policies shift.


Months ago, based on the preliminary data for the last quarter of 2012, it was painfully clear that Irish economy has entered another period of economic recession. This point was made on these very pages back in early March although it was, at the time, vigorously denied by the official Ireland.

Irish economy is currently in its fourth recession in GDP terms since 2007. Q1 2013 marked the third consecutive quarter in the latest recessionary episode. Since the onset of the crisis, Ireland had 17 quarters of negative growth in private and public domestic investment and expenditure, and counting.

For the Government that spent a good part of the last 2 years telling everyone willing to listen about our returning fortunes, things are looking pretty grim. Since settling into the office by the end of H1 2011, through the first quarter 2013, Coalition-steered economy has contracted by EUR1.52 billion or 3.75%.

The fabled exports-led recovery, first declared in Q1 2010, is not translating into real economic expansion. Neither do scores of strategic policies documents launched with promises of tens of thousands of new jobs.

With the national accounts officially in the red, the bubble of claimed policies successes is bursting. What is emerging from behind this bubble is the New Normal. Whether we like it or not, in years to come we will continue facing high risks to growth and a lower long-term growth trend. Traditional Keynesianism and Parish Pump Gombeenism - the two, largely complementary policy options normally promoted in Ireland - cannot sustain us in the future.

Prior to the crisis, Irish economy experienced three periods of economic growth, all driven by different internal and external forces, none of which are likely to materialize once again any time soon.

The first period of 1991-1997 witnessed rapid convergence in physical and financial capital, as well as in human capital utilization to the standards, observed in other small open economies of the EU.

From 1998 through 2003, Irish economy experienced a combination of rising share of economic activity generated in the domestic economy and rapid expansion of the financial services. This period is characterised by two short-lived, but significant booms and busts: the dot.com expansion and the subsequent dramatic acceleration in public spending.

From the late 1990s, Ireland also experienced accelerating property boom, which culminated in an unsustainable investment bubble. All three periods of economic expansion in recent past were underpinned by favourable external demand for MNCs exports out of Ireland, low or falling cost of capital and accommodative tax environments, in which tax competition was an accepted norm.

These drivers are now history.

Since the onset of the second stage of the domestic economy’s recession in H2 2010, Ireland has entered an entirely new period of development that will shape our long-term growth performance.

Externally, our capacity to extract rents and growth out of tax arbitrage is coming under severe pressures, best highlighted by the recent G8 decisions, the CCCTB proposals tabled in Europe and by accelerated tax policies gains in countries capable of serving big growth regions outside the EU. The financial repression that commonly follows credit busts is also denting our tax-driven growth engine by raising competition for tax revenues, and lowering our real cost competitiveness vis-à-vis Europe and North America.

Internally, since 2002, MNCs-led manufacturing in Ireland has suffered what appears to be an irreversible decline. Goods exports are down from EUR90.4bn in 2002 to EUR78.7bn in 2012 before we take account for inflation. Meanwhile, exports of services are up from EUR32.2bn to EUR93.3bn. Problem is: over the same time, services exports net contribution to the economy has expanded by only EUR18 billion. More worryingly, services exports growth is now falling precipitously.

Data from the Purchasing Managers Indices confirms the long-term nature of our economic slowdown. Average rates of growth in GDP are now closer to 1.5% per annum based on Services sectors contribution and closer to 1.0% for Manufacturing. Prior to the crisis these were 7.0% and 2.6%, respectively. In 1990-2007, all sectors included, Ireland experienced average annual growth of 6.6%. Now, we are looking at ca 1.5-1.7% average growth rates through 2020.

Lower growth rates for Ireland will be further reinforced by the lack of access to credit flows previously abundantly available from the global funding markets. This will impact our banks lending, direct debt issuance by companies, and securitised or asset-backed credit.

The retrenchment of the global financial flows away from the euro area, coupled with regulatory changes in European banking suggest that investment in the New Normal will become inseparably linked to the internal economy and significantly more expensive than the decade preceding the 2008 crisis. Much of this change will be driven by the same financial repression that will act to reduce our tax regime advantages.

This means that at the times of adverse shocks - such as, for example, a fall in revenues from exports or an increase in foreign companies extraction of profits from Ireland – our economy will be experiencing more severe credit and income contractions. This will put more pressure on investment and lower the velocity of money in the economy. Longer-term capital financing will become more difficult as domestic investors will face more uncertain returns and higher liquidity risk. A bust and severely restricted in competitiveness banking sector - legacy of the misguided post-2008 reforms - will not be helpful.

Thus, in the future, switch to services exports away from manufacturing and domestic investment, and reduced access to credit will mean higher volatility in growth, and lower predictability of our economic environment.

The New Normal requires more agile, more responsive and better-diversified economic systems, alongside a more conservative risk management in fiscal policies and less centralisation and harmonisation of policies at super-national level. It also calls for more aggressive incentivising of domestic investment and savings.

In terms of the fiscal policy stance, this means adopting a more cautious approach advocated, in part, by the ESRI this week. Irish Government should aim to continue reducing public spending, but do so in a structural way, not in a simplified framework of pursuing slash-and-burn targets. In addition, the Government needs to re-focus on identifying lines of expenditure that can be re-directed toward more productive use. In the short run, this can take the form of switching some of the current expenditure into capital investment programmes.

Reforms of social welfare, public education, health and state pensions systems will have to make these lines of spending more effective in helping people in real need, while slimmer in terms of total spend allocations. This can be achieved by direct means-testing and capping some of the benefits. But majority of these changes will have to wait until after the immediate unemployment and growth crises have passed.

In the longer run, going beyond the ESRI proposals, the Government should permanently reallocate some of the spending (such as, for example, overseas aid or poorly performing enterprise supports) to areas where it can increase value-added in public services (e.g. water supply or public transport) and create new exports platforms (e.g. e-health and higher quality internationally marketable education). Additionally, new revenues should be raised from severely undertaxed sectors and assets, such as agriculture and land, to be used to lower tax burden on both, ordinary and highly skilled workers.

Beyond a short-term stimulus, rather than directing tax- and debt-funded new investment, public sector should help generate new opportunities for more intensive growth. Increasing value added in existent activities, not simply scaling these activities up in terms of quantity of services deployed or employment levels involved should become the priority for future public sector growth.

Adding further to the ESRI analysis, the objective of using fiscal policy to drive enterprise creation requires simultaneously freeing more resources in the private sector to invest in new technologies acquisition and adoption, and development of indigenous R&D. We need to increase, not shrink, disposable incomes of the middle- and upper-middle classes and improve incentives for these segments of the population to invest. IBEC's suggestion this week that the Government should abandon any future tax increases makes sense in this context. The key, however, is that direct and indirect income tax increases of recent years must be reversed.

We need to recognise, support and scale up clustering initiatives in the tech and R&D sectors that deliver partnerships between the existent MNCs and larger domestic enterprises and start ups. To do this, we should create direct links between the existent clusters, such as for example IT@Cork initiative and public procurement systems. To re-orient public procurement toward supporting younger enterprises, larger procurement tenders should explicitly target new opportunities for partnerships between MNCs and SMEs or start-ups.

To address structural decline in debt financing available in the economy, we should exempt from taxation capital gains accruing to any real investment in Irish enterprises, including the IPOs and new rights issues, where such investments are held for at least 5 years. To qualify for this scheme, an enterprise should have at least a quarter of its worldwide employees based in Ireland.

The New Normal of lower trend growth and higher uncertainty about the economic environment is here. Addressing the challenges it presents requires robust policy reforms. The least painful and the most productive way of implementing these would be to start as early as possible.


Box-out:

Recent report from CBRE on office market in Dublin for Q2 2013 provides an interesting insight into the commercial real estate markets dynamics in Ireland. Despite the cheerful headlines and some marginally encouraging news, the market remains in deep slump and so far, hard data shows no signs of a major revival. Good news: vacancy rate in Dublin office space has declined by 4% on Q1 2013, to 17.2% in Q2 2013. The vacancy rate was 19.32% in Q2 2012. Bad news: at this rate, it will take us good part of 10 years to catch up with the EU-average rates. More bad news: office investment spend fell from EUR79.6mln in Q2 2012 to EUR72.6mln in Q2 2013. Adding an insult to the injury, prime yields fell from 7.0% to 6.25% in the year through June 2013. The office market in Dublin is firmly reflective of what is happening in the economy. Only 37% of offices take ups in Q2 2013 were by Irish companies. Massive 65-66% of the city and suburban office space was taken up by the ICT and Financial services providers in a clear sign that outside these sectors, economic activity remains largely stagnant. Overall, on a quarterly basis, offices take up in Dublin has fallen for the second quarter in a row while there was the first annual decline since Q3 2012.

Sunday, July 7, 2013

7/72013: Irish Manufacturing & Services PMI: June 2013

In the previous post I covered in detail the dynamics of the Services PMI (here) and few posts back, I covered Manufacturing PMIs (here). Now, lets take a look at both together.


Chart above shows the deviations of both PMIs from 50.0, with pre-crisis and post-crisis averages.
The relative weakness in Manufacturing performance, from the end of Q2 2011 through current is pretty much apparent. Both, manufacturing and services PMIs signaled much stronger growth conditions prior to the crisis, than since the beginning of 2010.

The most significant decline took place in Services, with the pre-crisis average deviation from 50.0 at 7.6 falling to 1.9 average deviation in post-January 2010 period. With STDEV at 6.5 since 2008 (7.4 prior historical), and with skew at -0.7 and kurtosis at 0.73, we are nowhere near average deviation being statistically significantly different from zero since the onset of 'recovery'.

Manufacturing decline has been more modest, given weak rates of growth in pre-crisis period. The average rate of pre-crisis deviation from 50 was 2.6 and that well to 1.1. With historical STDEV of 4.2 and STDEV since 2008 at 5.2, skew at -1.6 and kurtosis of 3.24, this is again indistinguishable from zero growth conditions.

On slightly better side of things and along shorter-run dimension, 3mo MAs are both above zero, but, once again, none are statistically significantly different from zero.


There is a strong, but non-linear relationship between Manufacturing and Services PMIs at levels, and it shows that year on year, relative gains in Manufacturing over 2011-2012 got erased over 2012-2013 and were replaced by relative gains in Services.


Irish PMIs have, however, very tenuous link to actual economic growth. Here are two charts showing this week relationship for log-log growth terms, but exactly the same picture is confirmed by taking simple level deviations in PMIs from 50, as well as for linear and cubic relationships (for robustness):


It is quite telling that Services PMIs have much weaker explanatory power for GDP and GNP growth than Manufacturing PMIs, confirming that Irish services, dominated by ICT and IFSC tax-optimising MNCs are not as relevant to Irish economy as manufacturing sectors.

Another telling thing is that both for Services and Manufacturing, the sectors activity as measured by PMIs has stronger relationship with GDP than GNP - which is also predictable, once you consider the PMIs heavy slant toward MNCs.


Note: raw data on PMIs levels is taken from Markit-Investec releases, with all analysis above, as well as deviations from 50 and all other transformations, including quarterly data computations, undertaken by myself. These transformations and analysis are intellectual property of my own and should not be cited without appropriate attribution.