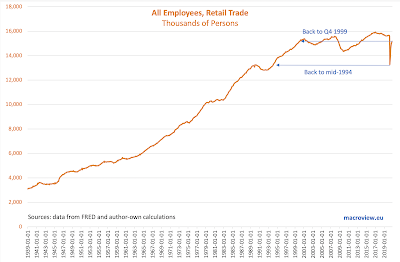
Retail sales suffered a sharp shock from the demand contraction following the first phase of COVID19 pandemic. As of the end of September, based on the preliminary estimates from the U.S. Census Bureau, total volume of retail sales in the U.S. has fully recovered to pre-pandemic levels:
Tuesday, November 17, 2020
16/11/20: Retail sales, Sector employment and COVID19 recovery
Friday, November 13, 2020
13/11/20: The economy has two chronic illnesses (and neither are Covid)
My column for The Currency this week covers two key long-term themes in the global economy that pre-date the pandemic and will remain in place well into 2025: the twin secular stagnations hypotheses and the changing nature of the productivity. The link to the article is here; https://thecurrency.news/articles/28224/the-economy-has-two-chronic-illnesses-and-neither-are-covid/.
Saturday, November 7, 2020
7/11/20: BRIC: Composite Economic Indicators for October
I covered BRIC Manufacturing and Services PMIs for October in two earlier posts (see here https://trueeconomics.blogspot.com/2020/11/51120-bric-services-pmis-october.html), so now, Composite PMIs:
- Brazil Composite PMI rose to 55.9 in October, compared to 51.6 in 3Q 2020, and currently sits above Global Composite PMI of 53.3. The latest increase in PMI is a robust signal of partial recovery, marking the third consecutive month of > 50.0 readings that followed five consecutive months of contraction.
- Russia Composite PMI was the weakest of all BRIC PMIs, falling to 47.1 in October, compared to 55.9 in 3Q 2020, and marking the first sub-50 reading in four months.
- India Composite PMI was the strongest amongst the BRIC PMIs rising to 58.0 in October against 45.9 in 3Q 2020. Overall, Indian economy is only starting to inch out of the recession that was marked by two consecutive quarters of sharply contractionary PMIs.
- China Composite PMI posted an increase to 55.7 in October relative to 54.7 in 3Q 2020, marking the start of the third quarter of growth. Overall, the latest reading indicates that Chinese economy has completed its recovery from 1Q 2020 recession.
7/11/20: COVID19 Update: U.S. vs EU27
U.S. is now in a full-blown third wave of the pandemic both in terms of daily case counts and deaths, and the EU27 is in a full-blown second wave:
Summary statistics:
7/11/20: COVID19 Update: Worldwide Cases and Deaths
The pandemic is accelerating world-wide and the death toll is now rising at an alarming rate:
The chart above is the most alarming one: rates of growth in new cases and in daily deaths counts (the second derivative) are well-above their past months' averages. Death toll is rising by a third, daily, on average since the start of November. Covid-denialists have persistently argued that despite increases in the numbers of new cases, deaths were falling (they were not: August was the only month of negative growth in daily deaths). In fact, starting with September, daily deaths, on average, grew by double-digits percentage points, and the rate of growth accelerated in October by 80 percent compared to September.
Global second wave of the pandemic is substantially more deadly (in absolute numbers) than the prior wave.
Thursday, November 5, 2020
5/11/20: The blue wave turned into a purple sludge
My article on the U.S. Election is now live on The Currency: https://thecurrency.news/articles/28395/the-blue-wave-turned-into-a-purple-sludge-while-populism-and-partisanship-replace-ideas-and-ideals/.
5/11/20: BRIC: Services PMIs October
In the earlier post, I covered BRIC economies manufacturing PMIs for October: https://trueeconomics.blogspot.com/2020/11/31120-bric-manufacturing-pmis-october.html. Now, leet's take a look at Services PMI.
- Brazil Services PMI rose from 47.5 in 3Q 2020 to 52.3 in October. Prior to October, Brazil's services sector was in a contractionary territory for three consecutive quarters. October marks the second month of above 50.0 readings, although statistically-speaking, September reading was indistinguishable from 50.0 stagnation / zero growth level.
- Russian Services PMI posted a sharp contraction, falling from 56.8 in 3Q 2020 to 46.9 in October. Russia enjoyed just three months of > 50.0 readings in July-September 2020, implying that the economy is nowhere near a V-shaped recovery from the pandemic and that things are getting worse, not better in the services sectors. Even worse dynamics apply to Manufacturing where Russia has not seen sustained > 50 readings since March 2019.
- India Services PMI rose to 54.1 in October, marking the first month of above 50.0 readings since February 2020. Given cumulative nature of the PMIs, October rebound is nowhere near being sizeable enough to start closing the pandemic-induced drop-off in economic activity. India's services have now posted seven months of contraction in 2020, compared to four months for Manufacturing. October marks the first month since February with both indices above 50.0.
- Chinese Services PMI rose to 56.8 in October, compared to 54.8 in September, marking 6th consecutive month of both Manufacturing and Services PMIs above 50.0 line.
Wednesday, November 4, 2020
3/11/20: Ireland PMIs and Economic Activity Dynamics for October
October PMI data for Ireland is showing serious strains from the pandemic and wave 2 on the economic activity:
- Manufacturing PMI for October came at a recessionary 48.3, marking a moderation on rapid contraction in the sector activity in September (45.8). This marks the second consecutive month of the Manufacturing PMI reading sub-50, and follows two months of partial (at best) recovery in July and August.
- Services sector PMI for October was at 50.3 - a statistically indifferent reading from zero growth 50.0 recorded in September.
- Official Composite PMI was at 49.0 in October, up on 46.9 in September, but still marking a decline in economic activity for the second month in a row.
- Since Construction sector PMI is not published until mid-month, we only have September reading for the sector. Based on this, my three-sectors activity indicator that weighs all three sectors based on their contribution to the gross value added has rise to 49.05 from 47.48 in September:
Overall, all PMIs point to a significant weakness in the economy in September continuing into October. Keep in mind that PMIs are effectively cumulative: sub-50 reading in September implies a decline in economic activity relative to August. If this is followed by a sub-50 reading in October, the new decline is being signalled is on already diminished September activity.
Tuesday, November 3, 2020
3/11/20: COVID19 Update: Nordics
Things are getting more complicated in the Nordics in the wake of the unfolding second wave of the pandemic:
3/11/20: BRIC: Manufacturing PMIs October
BRIC's manufacturing PMIs are out for October, marking the start of Q4 2020. Overall, the results reinforce Q3 2020 trends highlighted here: https://trueeconomics.blogspot.com/2020/10/141020-bric-manufacturing-pmis-q3.html.
- Brazil posted further acceleration in the recovery momentum with Manufacturing PMI rising to 66.7 from 3Q 2020 62.6. 3Q 2020 was the historical record quarter for Brazil's Manufacturing PMI readings. Brazil's Manufacturing PMIs have now strengthened every month since May 2020, the last month of sub-50 readings.
- In contrast to Brazil, Russia Manufacturing PMI slipped again in October, hitting a 5-months low at 46.9, down from 48.9 in September and well below already poor 49.5 reading for 3Q 2020. Prior to 4Q 2020, Russia clocked five consecutive quarters of Manufacturing PMIs below 50.0 mark.
- China Manufacturing PMI rose from 53.0 in 3Q 2020 to 53.6 in October. China's latest reading is on-trend, with rising PMIs for the third quarter in a row.
- India Manufacturing PMI stood at 51.6 in 3Q 2020 and this improved to 58.9 in October, marking a major acceleration in growth conditions.
- Three of the BRIC economies have posted October Manufacturing PMI readings more robust than Global PMI reading of 53.0. Thus, overall BRIC Manufacturing activity index stood at 55.2 in October, well ahead of 53.0 reading for 3Q 2020. The last time BRIC Manufacturing activity index was below that of the Global Manufacturing PMI was 4Q 2018.
- Russia was the only BRIC economy to continue posting recessionary PMI reading in its manufacturing sector.
3/11/20: COVID19 Update: Russia
Russia is experiencing a second wave of the pandemic that started around September 10-12 is still gaining speed in terms of new cases and deaths counts:
3/11/20: COVID19 Update: U.S. vs EU27
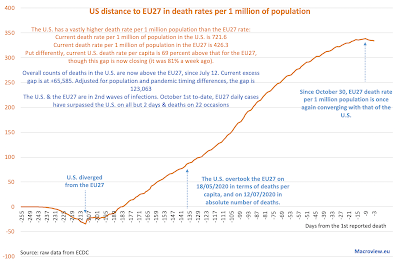
- The U.S. has a vastly higher death rate per 1 million population than the EU27 rate:
- Current death rate per 1 million of population in the U.S. is 707.7
- Current death rate per 1 million of population in the EU27 is 396.8
- Put differently, current U.S. death rate per capita is 78 percent above that for the EU27, though this gap is now closing (it was 86% a week ago).
- Overall counts of deaths in the U.S. are now above the EU27, since July 12
- Current excess gap is at +65,585.
- Adjusted for population and pandemic timing differences, the gap is 123,449.
- The U.S. & the EU27 are in 2nd waves of infections. October 1st to-date, EU27 daily cases have surpassed the U.S. on all but 2 days & deaths on 18 occasions
- EU27 second wave is savage in terms of new cases counts (more than four times the rate of the peak wave 1) and deaths counts are climbing up at a fast pace. On the current trajectory (note: this is not a formal forecast, but a point of warning), the EU27 deaths will be testing 3,000 per day counts mark within this month.
- U.S. is in a third or a second wave of the pandemic - depending on how one counts the 'waves' - in terms of new cases, but is yet to post consistent uptick in deaths. Nonetheless, in the last 10 days, deaths counts have also ticked up. Given that new cases in the U.S. are currently running at above thee last wave peak levels, we can expect continued increases in daily deaths counts too, albeit with longer lag on account of earlier detections and younger demographics of new cases.
- The U.S. is ranked 6th worst in terms of cases per capita, 10th worst in terms of deaths per capita, and 24th worst in terms of deaths per 1,000 confirmed infections. Across all key metrics of the pandemic, the U.S. ranks 8th worst in the world.
- The EU27 is ranked 20h worst in terms of cases per capita, 19th worst in terms of deaths per capita, and 20th worst in terms of deaths per 1,000 confirmed infections. Across all key metrics of the pandemic, the U.S. ranks 20th worst in the world.


