Tuesday, November 3, 2020

3/11/20: Monte dei Paschi is Eying Another Capital Raise?

Remember them? 

One of Europe's largest banks? Check. The oldest bank in the world with continued trading since 1472? Check. The first bank in history to require a sovereign rescue? Check. In 1624, the Medici Grand Duke of Tuscany rushed to guarantee the deposits of a bank at a time of economic crisis. The only bank in known history that has been bailed out at least five times and nationalised at least twice? Check.

Yep, right, we have the new old news from Italy's Banca Monte dei Paschi di Sienna. Just two and a half years after the last Government rescue in 2017 MPS is now rumoured to need another capital injection: https://www.reuters.com/article/italy-banks-monte-dei-paschi/rpt-update-1-monte-dei-paschi-ceo-tells-board-bank-faces-2-bln-euro-capital-gap-source-idUSL1N2HP0EV

The latest capital call is a mixture of the residual problems from the, yes, now more than a decade-old (hew, what's decades for MPS, right?) financial crisis and the fresh blows to thee Italian (and European) banks from the pandemic. 

Overall, major European banks have been increasing their capital cushions in thee early stages of the pandemic (https://www.spglobal.com/marketintelligence/en/news-insights/latest-news-headlines/europe-s-top-banks-bulk-up-capital-cushions-but-market-wary-as-virus-resurges-60666650). And, so far, losses in most banks have been either mild or inexistent, and most certainly well below the original (1Q 2020) expectations (https://www.ft.com/content/4d9ee2a0-8e44-4091-b6b7-ca9302f0f314). But banks are losing capital in bucketloads (https://o.canada.com/financial-times/global-banks-lost-nearly-us1-trillion-in-market-value-in-the-pandemics-first-wave-and-theres-another-one-coming/wcm/fe7ab3c9-3681-4703-9833-91a9baf71796) and losses recognitions cannot be delayed for too long (https://www.euromoney.com/article/27ohbp85c1ossyw7im1og/capital-markets/the-road-ahead-europes-banks-face-limited-options-as-they-cope-with-covids-aftermath). 

All in, with the second wave of the pandemic raging across the EU, MPS's latest problems are probably just an early warning signal for the rest of the Eeuropean banking sector. 

2/11/20: U.S. Public Health Systems Are Going to Continue Failing After the COVID19

Pre-conditions: amidst ageing population and declining life expectancy, both political parties' platforms effectively represent extension of the status quo model of healthcare provision.

Question: can the U.S. actually sustain any semblance of or pretence at having a functioning healthcare system, given the expected trajectory of demand for healthcare services?

Answer: not a chance:


Source of the chart: McKinsey (not Communists who support nationalised health).


2/11/2020: Technological Deepening and De-globalization post-COVID

Interesting insights from McKinsey on changes in technology adoption in response to COVID19 pandemic:


In the ed, I marked two types of technological frontier shifts: the ones relating to displacement of status quo-ante in supply chains - re-orientation from China; and the ones relating to technological deepening. Both are the legacy of the U.S. political and economic shift toward de-globalization. 

Saturday, October 31, 2020

31/10/20: Gold Coins Market is Still Hedging Residual Covid Risk

Sales of the U.S. Mint gold coins have moderated off their pandemic highs, but remain elevated by historical standards, especially controlling for higher gold prices:


Since hitting a pandemic-period high of 216,500 oz in March 2020 (the highest sales volume since April 2013), the demand has moderated through June, topped 145,000 in July and 149,000 oz in August, and has been around 91,500 through the four weeks of October. This puts October sales above the last three years' average.

Average gold weight per coin sold remains relatively elevated and is co-trending with price per oz, most likely indicating lasting FOMO effect (herding by investors). The correlation is weaker than during prior episodes of major crises and recessions, suggesting that the pandemic-period demand is probably less influenced by the herding effects than in prior crises.


Annualized data through October also confirms precautionary, but not 'flight to safety' type of demand:

As the pandemic re-accelerates, it will be interesting to see how seasonality (uplift in end-of-year sales) plays out against the pandemic-related hedging positioning of investors.

Tuesday, October 27, 2020

27/10/20: COVID19 Update: U.S. vs EU27

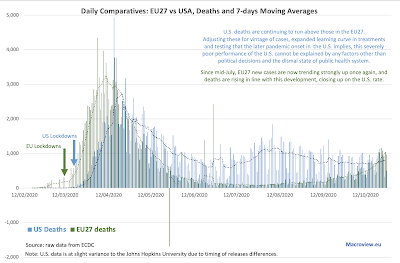
 Quick update to the U.S. vs EU27 charts for COVID19 pandemic:


Key stats:
  • The U.S. has a vastly higher death rate per 1 million population than the EU27 rate: 
    • Current death rate per 1 million of population in the U.S. is 690.0
    • Current death rate per 1 million of population in the EU27 is 370.3
    • Put differently, current U.S. death rate per capita is 86 percent above that for the EU27, though this gap is now slowly closing (it was 90% a week ago).
  • Overall counts of deaths in the U.S. are now above the EU27, since July 12. Current excess gap is at +67,604. Adjusted for population and pandemic timing differences, the gap is 114,869. 
  • The EU27 are now experiencing a second wave of infections. As the result, over October to-date, EU27 new case numbers have surpassed the U.S. in all but 2 days and deaths on 11 occasions
Couple of summary tables:

I covered a recent study from the Columbia University on U.S. excess deaths here: https://trueeconomics.blogspot.com/2020/10/251020-covid19-us-excess-deaths-are.html


27/10/20: Identity & Risk: My Keynote Talk

My recent keynote address to the pTools Virtual Conference 2020: Identity & Risk: Financial Services in a Time of Transformation & Uncertainty (22nd October 2020) is now available at: https://vimeopro.com/user12978768/ptools-virtual-conference-2020


27/10/20: COVID19 Update: Russia

 Russia is now in a full-blown second wave of the pandemic with rapidly accelerating daily deaths counts:


Authorities are imposing more severe restrictions on mobility (especially for older members of the public) and are trying to replace older essential workers with younger cohorts. For example, Moscow is trying to roll out substitute teachers (drafted from senior college students) as substitutes for older teaching staff in primary schools. A number of regions (as a federal structure, Russia has highly heterogenous, locally-administered systems) are now running out of emergency health facilities (https://www.themoscowtimes.com/2020/10/27/were-in-hell-russias-second-wave-of-covid-19-is-catching-the-regions-off-guard-a71851), with serious questions being asked as to the apparent lack of preparedness, given the summer pandemic moderation period. 

Overall, Russia currently ranks 33rd worst in the league of 47 countries with more than 100,000 cases, with better than average (95% confidence interval) scores in the number of cases per 1 million population, deaths per 1 million of population and deaths per 1,000 of cases. Despite the commonly cited controversy over Russian reporting methodologies for COVID19 linked deaths (incidentally, Russia does not use a unique methodology for such reporting, although Russian methods for assigning causes of deaths are different from those used in the EU27), Russian rates of deaths per cases detected and rates of deaths per 1 million of population are comparable (in rankings) to Russia's case numbers. 

Nonetheless, the second wave of the pandemic is both deadlier and larger than the first wave and it remains to be seen if Russian healthcare system can cope with this. 


Monday, October 26, 2020

26/10/20: ifo Institute: German Economic Conditions Deteriorated in October

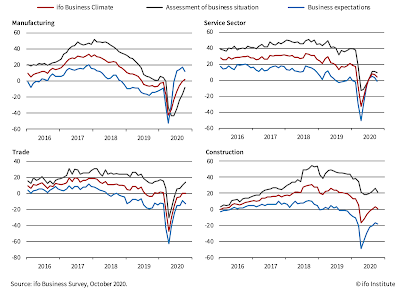
ifo Institute's latest Business Climate survey data for Germany is pointing to continued weakness in the recovery momentum:


Notably, all four sectors covered remain under water:


Current conditions are deteriorating month-on-month in two sectors, expectations have deteriorated in all four sectors.

25/10/20: COVID19: U.S. Excess Deaths are 130,000 at a lower end of estimates

I have been running EU vs U.S. comparatives for COVID19 pandemic dynamics for some time now, and as those reading this blog would know,  some months ago I added an estimate - based on mortality figures - of the excess U.S. deaths compared to the EU27. These currently - by my estimate - stand at 114,621 (see latest estimate here: https://trueeconomics.blogspot.com/2020/10/231020-covid19-update-us-vs-eu27.html). 

My estimate is crude. It is based on timings, population size and mortality rate adjustments. 

A more accurate recent estimate has been provided by the Columbia University study (https://resiliencesystem.org/columbia-university-says-trump-could-have-avoided-over-130000-covid-19-deaths-more-robust-pandemic) that puts the number at 130,000-210,000 'avoidable deaths'.  That is some range, of course. Per study: "If "the U.S. had followed Canadian policies and protocols, there might have only been 85,192 U.S. deaths – making more than 132,500 American deaths 'avoidable,'" the authors wrote. "If the U.S. response had mirrored that of Germany, the U.S. may have only had 38,457 deaths – leaving 179,260 avoidable deaths."

One way or the other, there are at least 100,000+ Americans dead because of the completely shambolic public health system and policy responses by the current Federal and State leaderships in the U.S. 

Columbia study seems to nail some of these factors: "The country's disproportionate death toll stems from delayed federal action, an insufficient testing regimen, a lack of consistent mask-wearing guidance, and the failure of top officials, notably Trump, to model best practices". Alas, predictably (mythology of the American culture), it misses the elephant in the room: the U.S. healthcare system itself. American approach to distributing access to healthcare based on private insurance (plus Medicare and Medicaid) is leaving tens of millions of Americans outside the basic safety net. Those without insurance as well as countless more with the atrociously large deductibles and co-pays are too afraid to present themselves to the hospitals designed to bankrupt people of modest means to seek early support and help. It matters little how much the U.S. authorities test the public (and, yes, tests are highly rationed, still, despite all the bluster from the White House), if people do not seek help in fear of being destroyed financially. 

In 2020, the average annual deductible for single, individual coverage is $4,364 and $8,439 for family coverage. Co-pay normally ranges 10-40% of the bill, though it is more complicated, since there are various caps and step-downs in co-payments. (https://www.ehealthinsurance.com/resources/individual-and-family/how-much-does-individual-health-insurance-cost#:~:text=Deductibles%20and%20cost%2Dsharing%20expenses,and%20%248%2C439%20for%20family%20coverage.)

The typical American household has an average of $8,863 in  a bank or credit union account. There are serious variations by age and type of household, with couples 34 and younger, couples without children have an average of $4,727 in savings, while single people without children have an average of $2,729 in savings. Couples with children between the age of 35 and 44 have an average of $10,399, couples aged 45-54 with children average $15,589. (https://www.cnbc.com/2019/03/11/how-much-money-americans-have-in-their-savings-accounts-at-every-age.html)

Meanwhile, the median charge for COVID-19 inpatient care was $45,683 for people aged 51 to 60 and $34,662 for those in the 23 to 30 age bracket, according to a recent study. This was the median billed to people without insurance or those who were forced to be treated out of network. The highest average allowed amount paid to the provider under an insurance plan was $24,012 for people aged 51 to 60 and, at its lowest, $17,094 for people above age 70. (https://www.thehealthcareloop.com/hospitalized-care-for-covid-19-averages-34662-to-45683-varying-by-age/

So a person visit for COVID19 treatment, counting lost wages, would wipe out between 1/2 and all of the savings held by average household. Contagion within the family would be a near insolvency event.

Anyone surprised American system is killing the U.S. citizens and residents?


Saturday, October 24, 2020

24/10/20: America's Scariest Charts: Duration of Unemployment & Employment Index

Two previous posts covered some core labor markets data for the U.S.:

Here, let's take a look at the weekly (higher frequency) data unemployment claims.

First, initial unemployment claims, with data coverage through the week of October 17th:


The above chart shows 1-month cumulative initial unemployment claims, smoothing some of weekly volatility in the series.

Current reading stands at 3,194,750 which is above the 2008-2011 crisis peak of 3,169,786 and only slightly below all-time pre-COVID19 high of 3,313,000 attained in January 1975.

In absolute level numbers, preliminary first-time claims for the week of October 17, 2020 stand at 756,617 which is still 3 times the rate of first-time claims filings in the last week before COVID19 pandemic onset (March 14, 2020). The good news is, preliminary estimate for the new claims for the week of October 17 suggest a decline in new claims filings of 73,125 on week prior - the fastest rate of reductions in 10 weeks. However, overall average weekly decline in first-time claims over the last 10 weeks has been rather unimpressive at 8,212. At this rate of improvement, it will take almost 62 weeks to draw current first-time claims down to the levels seen in the last pre-COVID19 week.


In line with the crisis timing, average duration of unemployment is climbing up, too:


Based on monthly data through September 2020, average duration of unemployment is about to hit pre-crisis average in October. This sounds like a good thing, until you realise that the duration of unemployment fell to historically low levels as COVID19 crisis unfolded because of the unprecedented rate of jobs losses and unemployment claims increases (see net chart below). It remains to be seen how it will behave in months ahead. 

Past three recessions have been associated with increasing average duration of unemployment through recovery periods. They have also been associated with longer periods of elevated duration. In fact, in the last three recessions, average duration of unemployment never reached pre-recession levels, implying that long-term unemployment got worse in every recovery period since 1990 on. If this trend is consistent with the COVID19 recession, U.S. long term unemployment duration will rise once again. 


For the last chart, consider employment index dynamics though September 2020:


Despite the headline 'historically fast' recovery, actual employment remains in dire state, with current dynamics through September 2020 indicating the third worst employment performance in the history of the modern economy. Based on the 3-months average gains in seasonally-adjusted employment, it will take us another 8 moths before we regain pre-crisis peak employment levels, implying the 5th fastest recovery in employment in history. Based on September rate of improvement, the process will take another 16 months, which would make the current recovery the fifth slowest on record. Based on the dynamics of change in the jobs recovery since May 2020, we can expect the jobs recession to last 45 months, which would make it the 3rd worst recession in history. So far, the average rate of decline in the jobs gained per month during the recovery is 15% per month. 

In the Great Recession, it took the economy 76 weeks to recover from trough of the recession to pre-recession peak employment. The average monthly rate of recovery from the trough until regaining pre-recession peak was 0.128% per month. This would put the month when we would recover from the COVID19 pandemic to July 2025, making the COVID19 pandemic a second worst recession in history after the Great Recession.


24/10/20: America's Scariest Charts: Non-farm Payrolls

In the previous post, I covered data for the U.S. Labor Force Participation and Employment to Population Ratios (see https://trueeconomics.blogspot.com/2020/10/241020-us-labor-force-participation.html). Now, let's update the data for Total Nonfarm Payrolls through September:


At the end of September, total non-farm payrolls stood at 141,855,000 - up 1,137,000 on August, and still down 11,322,000 on pre-COVID19 peak. We are now just over half-way to the recovery from COVID19 trough of 130,317,000 reached in April 2020. Since reaching trough, non-farm payrolls rose, on average, at a monthly rate of 2,308,000, which means that the latest increase over the month of September has been substantially slower than the average rate of recovery. 

At September rate of jobs recovery, it will take us almost 10 months to regain pre-COVID19 peak. 

Current levels of payrolls are consistent with February 2016 levels, implying that even after we are still missing some 4.5 years worth of jobs creation. 

Here is a genuinely scary table, highlighting the fact that in the COVID19 pandemic, the U.S. sustained jobs losses of the combined magnitude equivalent to those suffered in all recessions from 1980 through the Great Recession:


And while the recovery is clearly under way, broader indicators of the jobs markets trends are still pointing to a horrific aftermath of the first of this pandemic, with the second wave now in full swing (see more on this here: https://trueeconomics.blogspot.com/2020/10/231020-covid19-update-us-vs-eu27.html


24/10/20: U.S. Labor Force Participation Rate is Falling, Again

One of thee major casualties of the COVID19 pandemic has been the U.S. labor market. However, with an allegedly robust recovery under way, we are seeing significant improvements across some metrics of labor markets health. In some, but not all.

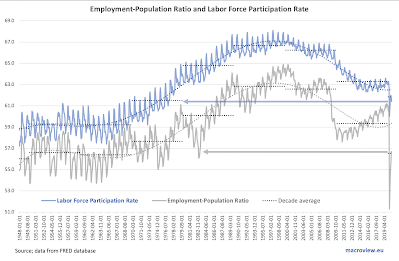
Take labor force participation rate:


Labor force participation rate is a critical metric for gauging employment conditions in the economy, because it reflects not only the availability of jobs in the market, but the perception amongst the workers of thee health of the market. Since the start of the pandemic, LFP rate fell to its 2020 low of 60.0 in April, before recovering to the pandemic period high of 62.0 in July. Since then, it trended down once again and in September fell to 61.4. 

Let's consider this for a second. During the Great Recession and the Global Financial Crisis, the lowest LFP rate reached was 63.8. In the Dot.Com recession, that number was 65.9. In the 1990s recession it was 65.5. For the entire decade of the 1980s, the lowest reading for LFP rate was 63.0. In fact, the only decade with lower LFP rate than current is the decade of the 1970s. February 1977 was the last time we saw LFP rate at the level below September 2020 reading.

Things are marginally better for another measure of labor markets health: the Employment to Population Ratio (EPR), which currently sits at 56.7, lower than any recession reading prior to the COVID19 pandemic since the first recession of the 1980s. March 1983 was the last time we saw this reading until the COVID19 hit.

Give it a thought, folks, a 'historical recovery' is the one where there are just 567 people working (part time or full time. minimum wage or living wage) per each 1,000 working age adults. Or, described differently, an economy where only 614 working age adults our of 1,000 are either in employment or confident enough of their prospects for finding a job to bother searching for one.