Monday, January 11, 2016

11/1/16: Dealing with Systemic Sovereign Debt Crises: IMF's Animal Farm Model


IMF brainiacs have been struggling over time to develop some sort of a coherent framework for managing the fallouts from systemic sovereign debt crises. So far, the golden rule has ben elusive for them. However, following the Cypriot and Greek experiences with private sector bail-ins and realising the direct connection between these experiences and the cases of other peripheral Euro area states, most notably Ireland and Portugal, the IMF have been coming around to the idea that while all countries are ‘equal’, some are ‘more equal’ than others. In other words, that in the world where might is right, there are two tiers of countries: those that get whacked and those that get properly rescued.

Behold the IMF’s latest thinking on the subject. Sandri, Damiano of IMF’s research department authored a new working paper, titled “Dealing with Systemic Sovereign Debt Crises: Fiscal Consolidation, Bail-Ins or Official Transfers?” (October 2015, IMF Working Paper No. 15/223: http://ssrn.com/abstract=2711133).

It says what it does: “The paper presents a …model to understand how international financial institutions (IFIs) [read IMF and European ESM/EFSM/EFSF and so on] should deal with the sovereign debt crisis of a systemic country, in which case private creditors' bail-ins entail international spillovers.” Notice the emphasis on ‘systemic’ country. In other words, ‘not the ordinary fry’ like smaller ‘peripherals’.

“Besides lending to the country up to its borrowing capacity, IFIs face the difficult issue of how to address the remaining financing needs with a combination of fiscal consolidation, bail-ins and possibly official transfers. To maximize social welfare, IFIs should differentiate the policy mix depending on the strength of spillovers. In particular, stronger spillovers call for smaller bail-ins and greater fiscal consolidation.” Which simply says: more systemic is a country, less risk of bail-ins, so if you are a French or a German depositor or lender, you are lucky. If you are a Belgian or Irish depositor or lender, tough sh*t, mate.

“Furthermore, to avoid requiring excessive fiscal consolidation, IFIs should provide highly systemic countries with official transfers. To limit the moral hazard consequences of transfers, it is important that IFIs operate under a predetermined crisis resolution framework that ensures commitment.” Oh, what this means is that systemic countries get bailed out via official sector (IMF et al) burden sharing. Small countries - get screwed by not having access to such largess.

Here’s more beef from the paper:

“…consider the optimal policy mix to address the financing needs of a non-systemic country, for which bail-ins do not entail international spillovers. In this case, besides lending to the country up to its borrowing capacity, IFIs should use only fiscal consolidation and bail-ins.” In other words: small country gets only funds sufficient to cover its standing allowance under the normal rules and not a penny more. Rest of ‘rescue’ funds should be squeezed out of the country economy. “Official transfers should …be avoided because they do generate severe moral hazard since they are not priced into countries’ ex-ante borrowing rates.” Which simply says: look, bailing out through official burden sharing will not increase fiscal pain for smaller countries as yields on government debt are not going to rise high enough.

So, please, whack these small countries harder, to teach them a lesson and who cares about their economies and people. Lessons matter, you peasants.

Now onto systemic countries case: “Dealing with the sovereign debt crisis of a systemic country, …a first implication is that bail-ins should be used to a lesser extent since they are more socially harmful due to the associated spillovers. If IFIs are prevented from providing transfers, any reduction in bail-ins would need to be offset entirely through an increase in fiscal consolidation. In this case, systemic countries might be required to endure an excessive amount of consolidation to spare the international community from the systemic consequences of bail-ins. When dealing with systemic countries, it may thus become efficient to compensate the reduction in bail-ins not only through greater fiscal consolidation, but also with official transfers.” So in simple terms: if you are a big country, you will be treated entirely differently from a small country. Never mind that moral hazard thingy - systemic countries get official sector burden sharing, lending over allowed capacity and less bail-ins pressure.

Of course, the IMF Working Paper is not reflective of the Fund official position, as disclaimers go. So this paper is nothing more than a ‘discussion’ of what should take place, rather than what will take place. But, of course, we all know one simple fact: in the world of IMF, some countries are ‘more equal’ than others.


Sunday, January 10, 2016

10/1/16: My 2004 article on Irish property bubble


Per friend's reminder, here is an article of mine from November-December 2014 Business & Finance magazine, showing the dangerous levels of house prices overvaluation in Ireland relative to underlying fundamentals:


10/1/16: Russian Banks: Licenses Cancellations Galore


Why Russian Central Bank’s chief Elvira Nabiullina deserves title of the best central banker she got in 2015? Why, because she sticks to her stated objectives and goes on even in challenging conditions.

When Nabiullina came to office, Russian banking system was besieged by underperforming and weak banks - mostly at the bottom of banking sector rankings, but with some at the very top too (see ongoing VEB saga here http://trueeconomics.blogspot.ie/2016/01/1116-another-veb-update-things-are.html). And she promised a thorough clean up of the sector. I wrote about that before (see http://trueeconomics.blogspot.ie/2014/12/22122014-elvira-nabiullina-roubles-last.html and http://trueeconomics.blogspot.ie/2013/03/1432013-comment-of-appointment-of-new.html).

But times have been tough for such reforms, amidst credit tightening, rising arrears and economic crisis. Again, majority of the problems are within the lower tier banks, but numbers of loss-making institutions has been climbing over 2015. January-November 2015 data shows that almost 30% of Russian banks are running operating losses and overdue loans have risen by nearly 50% to RUB2.63 trillion. Still, this constitutes less than 7 percent of total credit outstanding. Stressed (but not necessarily overdue) loans rose from 7 percent of total credit in January 2015 to 8 percent at the end of December 2015. Notably, both stressed and overdue loans numbers are surprisingly low. And on another positive side, bank’s own capital to assets ratio averaged 13 percent. The aggregate numbers conceal quite some variation within the banking sector, as noted by Bofit: “At the beginning of November, 129 banks had equity ratios below 12%. Large deficiencies in calculating the capital have come to light in several bank insolvencies.”

Amidst this toughening of trading conditions, CBR continued to push our weaker banks from the market. Over 2015, 93 banks lost their licenses, almost the same number as in 18 months prior with just 740 banks left trading the market as of December 2015. As the result, banking sector concentration rose, with 20 largest banks now holding 75 percent share of the market by assets. In January-October 2015, some 600,000 depositors in Russian banks were moved from banks losing licenses to functioning banks, per report here.

Chart from Bofit illustrates the trends in terms of banking licenses revoked:


Overall, this is good news. Russian banking system evolved - prior to 2009 - into a trilateral system of banks, including strong larger (universal) banks, medium-sized specialist and foreign banks with retail exposures, weak and sizeable fringe of smaller institutions, often linked to industrial holding companies. Aside from VEB - which officially is not a bank - larger banks are operating in tough conditions, but remain relatively robust. Smaller banks, however, having relied in previous years on higher risk consumer credit and holding, often, lower quality capital, have been impacted by the crisis and by the lack of liquidity. Shutting these operations down and consolidating the smaller banks' fringe is something that Russian needs anyway. 

10/1/16: Tsallis Entropy: Do the Market Size and Liquidity Matter?


Updated version of our paper:
Gurdgiev, Constantin and Harte, Gerard, Tsallis Entropy: Do the Market Size and Liquidity Matter? (January 10, 2016), is now available at SSRN: http://ssrn.com/abstract=2507977.


Abstract:      
One of the key assumptions in financial markets analysis is that of normally distributed returns and market efficiency. Both of these assumptions have been extensively challenged in the literature. In the present paper, we examine returns for a number of FTSE 100 and AIM stocks and indices based on maximising the Tsallis entropy. This framework allows us to show how the distributions evolve and scale over time. Classical theory dictates that if markets are efficient then the time variant parameter of the Tsallis distribution should scale with a power equal to 1, or normal diffusion. We find that for the majority of securities and indices examined, the Tsallis time variant parameter is scaled with super diffusion of greater than 1. We further evaluated the fractal dimensions and Hurst exponents and found that a fractal relationship exists between main equity indices and their components.

10/1/16: Crisis Contagion from Advanced Economies into BRIC


New paper available: Gurdgiev, Constantin and Trueick, Barry, Crisis Contagion from Advanced Economies into Bric: Not as Simple as in the Old Days (January 10, 2016). 

Forthcoming as Chapter 11 in Lessons from the Great Recession: At the Crossroads of Sustainability and Recovery, edited by Constantin Gurdgiev, Liam Leonard & Alejandra Maria Gonzalez-Perez, Emerald, ASEJ, vol 18; ISBN: 978-1-78560-743-1. Link: http://papers.ssrn.com/sol3/papers.cfm?abstract_id=2713335.


Abstract:      

At the onset of the Global Financial Crisis in 2007-2008, majority of the analysts and policymakers have anticipated contagion from the markets volatility in the advanced economies (AEs) to the emerging markets (EMs). This chapter examines the volatility spillovers from the AEs’ equity markets (Japan, the U.S and Europe) to four key EMs, the BRIC (Brazil, Russia, India and China). The period under study, from 2000 through mid-2014, reflects a time of varying regimes in markets volatility, including the periods of dot.com bubble, the Global Financial Crisis and the European Sovereign Debt Crisis, the Great Recession and the start of the Russian-Ukrainian crisis. To estimate volatility cross-linkages between the advanced economies and BRIC, we use multivariate GARCH BEKK model across a number of specifications. We find that, the developed economies weighted return volatility did have a significant impact on volatility across all four of the BRIC economies returns. However, contrary to the consensus view, there was no evidence of volatility spillover from the individual AEs onto BRIC economies with the exception of a spillover from Europe to Brazil. The implied forward-looking expectations for markets volatility had a strong and significant spillover effect onto Brazil, Russia and China, and a weaker effect on India. The evidence on volatility spillovers from the advanced economies markets to emerging markets puts into question the traditional view of financial and economic systems sustainability in the presence of higher orders of integration of the global monetary and financial systems. Overall, data suggests that we are witnessing less than perfect integration between BRIC economies and advanced economies markets to-date.

10/1/6: After the Flood Comes the Tax: European Road to Financial Transactions Tax


New paper, forthcoming as Chapter 10 in Lessons from the Great Recession: At the Crossroads of Sustainability and Recovery, edited by Constantin Gurdgiev, Liam Leonard & Alejandra Maria Gonzalez-Perez, Emerald, ASEJ, vol 18; ISBN: 978-1-78560-743-1, titled After the Flood Comes the Tax: European Road to Financial Transactions Tax is now available on my SSRN page: http://papers.ssrn.com/sol3/papers.cfm?abstract_id=2713332.


Abstract

This chapter presents the results of the comprehensive literature survey and supportive empirical assessment of the potential impacts of the Financial Transactions Tax recently adopted by the European Commission in response to the significant financial sector misallocations arising from the Global Financial Crisis. A survey of fifty academic articles relating to both Financial Transaction Taxes and Tobin Taxes shows that although a reduction in liquidity can be expected from such taxes, the impacts this will have on volatility and efficiency in a market is less obvious. A regression model quantifying what the possible effect of an introduction of a 0.1% tax on financial transactions would be on trading volumes and levels of volatility in the European equity market confirms the survey results in broader terms. These results can be used to infer that such a tax would likely increase volatility levels but may not have much effect on trading volumes. As a result the proposed tax can be viewed as an exercise in revenue generation but not as a macro-prudential tool for addressing potential future shocks and imbalances within the European financial system.


Friday, January 8, 2016

8/1/16: Some CIS Currencies & Westremlin-ised Brains...


It is a common meme amongst 'Westremlin' analysts on social media to attribute the massive fall in Russian Ruble over the last 15 months to the economic policy failure of Moscow, ignoring two simple facts: oil prices and free floating regime for the Ruble.

How much this ignorance is not a bliss?

Source: BOFIT

Unless your brain has been so solidly 'Westremlin'-ised by some poli-sci department from U.S.ofA, neither Kazakhstan, nor Azerbaijan are run from Moscow... oh an Uzbekistan is producing only 83K bpd of crude, NGPL and other liquids combined (Russia - roughly 11,400K Kazakhstan 1,691K and Azerbaijan roughly 865K).

Arithmetic is simple: more oil produced, heavier devaluation. Excluding, of course, Turkmenistan, where reality never collides with daily life...

8/1/16: Baltic Dry Index Hits Another All-Time Low


Let's give another cheer to the repaired global economy... as Baltic Dry Index continues to plough new record lows: the index fell 6.9% in YTD terms and down 38.54% y/y to close at a new record low of 445.0 (4.17% below Wednesday close).


or on longer time scale:

But never fear - everything has been repaired.

Thursday, January 7, 2016

7/1/16: BRIC Brake on Global Growth


As I noted in analysis of the BRIC Composite PMIs (http://trueeconomics.blogspot.ie/2016/01/6116-bric-composite-pmis-december.html) December turned out to be another month when BRIC economic fortunes were weighing on the global economy.

As a reminder, overall 4Q 2015 BRIC Composite Activity Index stood at 99.0, down on 99.2 in 3Q 2015 and on 102.1 recorded in 4Q 2014.

Sectorally, both Services and Manufacturing Aggregate Indices for BRIC group of countries continued to trend down - a trend now running uninterrupted since the start of 2H 2010 and accelerating since 2H 2014 for Manufacturing.

Meanwhile, Global Composite PMI slipped in 3Q and 4Q 2015 below longer trend (that is still gently upward).

Chart below illustrates:

Wednesday, January 6, 2016

6/1/16: BRIC Composite PMIs: December


In recent posts, I covered Manufacturing sector PMIs for BRIC economies based on monthly data and Services Sector PMIs here.

Now, let’s consider Composite PMIs for BRIC:


Brazil Composite PMI fell from 44.5 on November to 43.9 in December, As the result, the economy posted 10th consecutive month of sub-50 readings, and since April 2014, Brazil’s economy registered above 50 readings in only three months, with none of these three readings being statically significantly different from 50.0. The last time Brazil’s Composite PMI posted reading statistically consistent with positive growth was in February 2013.

In December, both Manufacturing and Services sectors indicated contracting activity, with Markit concluding that “Private sector activity in Brazil continued to plunge in December as a deepening economic retreat contributed to a further contraction in new business. The seasonally adjusted Composite Output Index fell from 44.5 in November to 43.9 at the year end, pointing to a sharp and stronger rate of reduction. Whereas the downturn in manufacturing production eased (though remained severe), services activity declined at a quicker pace.”

Over 4Q 2015, Brazil Composite PMI averaged 43.7 which is about as bad as the average of 43.6 achieved in 3Q 2015 and much worse than already contractionary average of 49.0 posted in 4Q 2014.


Russian Composite PMI was covered in detail here. Overall, Russia’s Composite index slipped into contraction during December, falling to 47.8, from 50.5 in November, with the decline in output reflected across both manufacturing production and services activity. Overall, Russian economy’s composite PMI averaged 49.1 in 4Q 2015 which is much worse than 50.4 average for 3Q 2015. The data strongly suggests that not only did the economy failed to attain stabilisation, but that growth might have turned more negative in 4Q 2015.


Chinese Composite PMI also signalled declining business activity in December, falling to 49.4 from 50.5 in November. Overall, China posted four months of below 50 readings on Composite PMIs out of the last 5 months and the last time Chinese Composite PMI was consistent with statistically significant growth was in August 2014. In 4Q 2015, Chinese Composite PMI averaged 49.9, which is better than 3Q 2015 average of 49.2, but much worse than the 4Q 2014 average of 51.6. Unlike Russia and Brazil, which posted sub-50 readings across both Manufacturing and Services, China posted sub-40 reading in Manufacturing and above 50 reading in Services, That said, the Services reading was 50.2 - statistically consistent with zero growth - and the second weakest on record (the weakest point was 50.0 in July 2014).


India Composite PMI rose unexpectedly from November’s five-month low of 50.2 to a four-months high of 51.6 in December. Thus, per Markit, the index was “indicative of a rebound in growth of private sector activity. Whereas manufacturing production decreased for the first time since October 2013, services activity increased at an accelerated pace.”

Further per Markit: “Leading services activity to increase was a solid rise in incoming new work, one that was faster than that seen in November. Anecdotal evidence highlighted strengthening demand conditions. Conversely, manufacturing order books decreased, with panellists indicating that demand had been suppressed by the Chennai floods. Across the
private sector as a whole, new business inflows expanded at a faster pace that was, however,
modest.”

4Q 2015 Composite PMI for India stood at 51.5, down from 52.1 in 3Q 2015 and down on 52.2 average for 4Q 2014.


Overall Russia was a negative contributor to the BRIC Composite Activity Index dynamic in December, although overall ex-Russia group performance continued to deteriorate in December faster than in November, as indicated in the chart below:


Note: Composite Activity Index is based on my own calculations weighing BRIC economies by their shares of global GDP. The Index is based on a scale of 100=zero growth.

In 4Q 2015, average Composite Activity Index for BRIC ex-Russia was 96.7 which was marginally better than in 3Q 2015 (86.5) but worse than 101.8 average for 4Q 2014.

Overall 4Q 2015 BRIC Composite Activity Index stood at 99.0, down on 99.2 in 3Q 2015 and on 102.1 recorded in 4Q 2014. 

The chart below shows a clear downward trend in BRIC activity setting on from June 2014 and accelerating since May 2015.


6/1/16: BRIC Services PMIs: December


In recent posts, I covered Manufacturing sector PMIs for BRIC economies based on monthly data (http://trueeconomics.blogspot.ie/2016/01/4116-global-manufacturing-weighted-down.html) and Russian Manufacturing PMIs based on quarterly data (http://trueeconomics.blogspot.ie/2016/01/4116-russian-pmi-in-4q-2015-signalling.html).

The net outrun was that global manufacturing has ended 2015 an inch closer to zero growth / stagnation point and certainly nowhere near the levels of growth consistent with amplification in global economic growth rates forward. Most of this trend is down primarily to BRIC economies all of which have seen Manufacturing PMI falling below 50 marker for the first time since March 2009. As noted, this evidence strongly suggests overall continued downward pressures on growth in world’s largest emerging markets.

Now, consider Services PMIs.


Russian Services PMI data was covered in the earlier post here: http://trueeconomics.blogspot.ie/2016/01/4116-russia-services-manufacturing-pmis.html on monthly basis and on quarterly basis here: http://trueeconomics.blogspot.ie/2016/01/4116-russian-pmi-in-4q-2015-signalling.html. The key takeaway from these was that the data strongly suggests that not only did the economy failed to attain stabilisation, but that growth might have turned more negative in 4Q 2015 in both services and manufacturing sectors.


China Services PMI eased to 50.2 in December, down from 51.2 in the previous month, statistically signalling zero growth in the Services sector. This marks the second-lowest index reading since the series began in November 2005 (behind July 2014). 4Q 2015 average reading stands at 51.1, which is weaker than 3Q reading of 51.9 and well below the 4Q 2014 reading of 53.1.

Per Markit release: “Relatively subdued client demand … was highlighted by only a marginal
increase in new work at service providers that was one of the weakest seen in the series history.”


India Services PMI unexpectedly hit a 10-month high at 53.6 in December up on November’s zero growth 50.1. Overall, Services PMI came in with a strong indication of positive expansion in output across the sector. This pushed 4q 2015 average to 52.3, ahead of 3Q 2015 average of 51.3 and above 51.2 average for 4Q 2014.

Per Markit: “Sub-sector data indicated that output rose in four of the six broad areas of the service economy, the exceptions being Hotels & Restaurants and Transport & Storage. The best performing categories in December were ‘Other Services’ and Financial Intermediation. Leading services activity to increase was a solid rise in incoming new work, one that was faster than
that seen in November. Anecdotal evidence highlighted strengthening demand conditions.” This puts Services dynamics at odds with Manufacturing which posted a significant contraction.


Brazil Services PMI tanked from already abysmal (albeit 8-mo high) 44.5 in November to 43.9 in December, with economy beating “deepening economic retreat”.

Per Markit: “Survey participants commented that worsening economic conditions led new business and activity to decrease. All six monitored subsectors posted lower activity in December, a trend that has been observed throughout the past eight months. The quickest rates of decline were seen in ‘Other Services’, Renting & Business Activities and Post & Telecommunication. Leading services activity to decrease was a further drop in incoming new work. Having accelerated since November, the pace of reduction was among the fastest in the survey history. Panellists indicated that a deepening economic downturn restricted clients’ confidence in committing to new projects.”

4Q 2015 average for Brazil Services PMI now stands at 44.0, up on 3Q 2015 reading of 41.9, but overall so poor, one can’t talk about any improvement at these levels of signalled contraction.


Summary of movements in PMIs for BRIC economies is provided in the table below:


Chart illustrates trends in Services:


I will be covering composite PMIs next, but overall Services PMIs conclusion is that a positive improvement in India was offset by deteriorating growth in China and outright fall-offs in activity in Russia and (much worse) in Brazil. Overall, the data from Services compounds the already rotten data from Manufacturing.

6/1/16: Debt Pile: BRICS v BRIS


When it comes to debt pile for the real economic debt (Government, private non-financial corporates and households), China seems to be in the league of its own:


Per chart above, China’s debt is approaching 250 percent of GDP, with second-worst BRICS performer - Brazil - sitting on a smaller pile of debt closer to 140 percent of GDP. The distance between Brazil and the less indebted economies of South Africa and India is smaller yet - at around 12-14 percentage points. Meanwhile, the least indebted (as of 1Q 2015) BRICS economy - Russia - is nursing a debt pile of just over 90 percent of GDP, and, it is worth mention - the one that is shrinking due to financial markets sanctions.

6/1/16: Irish Manufacturing, Services & Construction PMIs: 4Q 2015


Time to update Irish quarterly PMI readings for 4Q 2015. Please note: the following refer to average PMI readings per quarter as supplied by Markit.

Irish Manufacturing PMI averaged 53.7 in 4Q 2015, down slightly on 54.7 in 3Q 2015 and the lowest quarterly reading since 4Q 2013 (jointly tied for that honour with 1Q 2014). The quarterly average has now declined in every quarter since the period peak in 4Q 2014.  Still, at 53.7 we have rather solid growth signal as is. On y/y basis, Manufacturing PMI is now down 5.1% after falling 2.6% in 3Q 2015 and rising 0.7% in 2Q 2015. 4Q 2015 marks tenth consecutive quarter of above 50.0 readings for the sector, with all of these readings being statistically above 50.0 as well. The trend in growth is down.

Irish Services PMI slipped from 62.6 in 3Q 2015 to 61.8 in 4Q 2015, down 1.3% q/q after posting a 1.4% rise q/q in 3Q 2015. On annual basis, the PMI fell 0.11% having previously risen 0.91% in 3Q 2015 and falling 0.48% in 2Q 2015. This marks 20th consecutive quarter of above 50.0 readings in the sector. In level terms, 61.8 signals robust growth in the sector, so it is a positive signal, albeit over time consistent with quite a bit of volatility and no strongly defined trend.

Irish Construction sector PMI (through November 2015) for 4Q 2015 stood at 55.9, down from, 57.1 in 3Q 2015 and marking the second consecutive quarter of index declines. Q/Q index was down 7.95% in 3Q 2015 and it was also down 2.16% in 4Q 2015. Y/Y, index was up 1.42% in 2Q 2015, down 7.6% in 3Q 2015 and down 12.4% in 4Q 2015. Volatile movements in the series still indicate downward trend in growth in the sector.


Chart above summarises the sub-trends, with Services trending very sluggishly up, while Manufacturing and Construction trending down.

As shown in the chart above, my estimated Composite measure, relating to PMIs (using sectoral weights in quarterly GDP figures) posted moderation in growth rate in 4Q 2015.  Composite Index including construction sector stood at 54.4 in 4Q 2015, down from 55.5 in 3Q 2015, hitting the lowest reading since 3Q 2013. This marks second consecutive quarter of declining Composite Index. Index is now down 1.9% q/q having previously fallen 3.8% q/q in 3Q 2015. In y/y terms, Composite Index was up 0.8% y/y in 2Q 2015, down 3.5% y/y in 3Q 2015 and down 6.52% y/y in 4Q 2015. While levels of Index suggest relatively robust growth in the economy across three key sectors, there is a downward trend in the growth rate over time.

So in the nutshell, Irish PMIs continue to signal robust growth, albeit the rate of growth appears to be slowing down along the new sub-trend present from 1Q 2015 on.


Two charts to highlight relationship between PMI signals and GDP and GNP growth rates (data through 3Q 2015).


6/1/16: It's Christmas Eve... and Ruble is Getting Socks...


Anyone wondering about Ruble's next move from here:

 Source: @Schuldensuehner 

should take a look at the third chart here: http://trueeconomics.blogspot.ie/2015/12/301215-2016-better-be-kinder-to-old.html.

As oil stays around USD35 mark, the duration of slump will be weighing on Ruble, with oil/USDRUB spread compressing on re-valuations of the Russian budget and fiscal position. Current spread appears moderately optimistic to me...

As an aside, c Рождеством!

Tuesday, January 5, 2016

5/1/16: Debt Pile: Advanced Economies Lead


After some 8 years of crisis and post-crisis deleveraging, one would have expected a significant progress to be achieved in terms of reducing the overall debt piles carried by the world’s most indebted economies.

Alas, the case cannot be made for such improvements. Here is a chart based on the latest BIS data (through 1Q 2015) plotting the distribution of total real economic debt (Government, private non-financial corporates and households) across the main economies:


As the chart above indicates, there are at least 23 economies with debt/GDP ratio in excess of 200 percent, seven economies with debt to GDP ratio close to or above 300 percent and 3 economies with debt to GDP ratio in excess of 300 percent. But the true champs of the debt world are Japan and Ireland, where based on BIS data, debt to GDP ratio is in excess of 375 percent. 

It is worth noting that Germany is the only advanced economy in the chart that has debt/GDP ratio below 200 percent. Of all original Euro area 12 economies, Germany, Austria and Finland are the only three economies with debt/GDP ratio below 250 percent. Six out of top 10 most indebted economies in the chart are Euro area members.


Do note that the above omits local authorities and state bodies debts, so the true extent of debt pile up around the world is significantly larger than that presented in this figure.

5/1/16: What Aggregate R&D Spends Tell Us? Actually... little


In a recent comment on R&D Expenditure across the OECD countries, WEF has referenced Irish data on R&D spending as % of GDP at 1.58% which refers to 2012 full year results.


Which is surprising, given that we now have 2014 data available per Eurostat (http://ec.europa.eu/eurostat/documents/2995521/7092226/9-30112015-AP-EN.pdf/29eeaa3d-29c8-496d-9302-77056be6d586) which puts our R&D spending at 1.55% of GDP in 2014.


Irish GDP in 2014 in current prices terms was 16.07% above Irish GNP. The same gap in 2004 was 17.26%. Which means that adjusting for this gap, Irish R&D expenditure as a share of GNP was 1.38% of GNP in 2004, rising to 1.80% in 2014.

Thus, in 2004, Ireland ranked as 12th country in the EU in terms of R&D expenditure ‘intensity’ by GDP metric, and 11th by GNP metric, both metrics were at exactly the same ranking places in 2014.

Here is a chart showing longer evolution of the R&D expenditure series from OECD:


Overall, Irish R&D expenditures remain below the desired levels in absolute terms, both relative to the GDP and the GNP bases.

Eurostar provides a handy breakdown of R&D spending by origin across Private sector, Government sector, Higher education and non-Profit.


Few things stand out for Ireland:

  • As a share of R&D spending, business enterprise sector appears to be carrying its weight in Ireland. 
  • Government expenditure on R&D is extremely weak in Ireland, though one has to wonder what on earth can Irish Government research, given the quality of our state institutions.
  • Higher education sector R&D spending in Ireland is ranked 20th in the EU - a ranking that is heavily influenced by a massive share of business enterprise spending of total R&D expenditure. 
  • Apparently, there is no private non-profit spending whatsoever in Ireland.

Key to the above is, however, the nature of business enterprise spending. Per Government own statistics, in 2012, roughly 300 firms accounted for almost 70% of total R&D expenditure in Ireland. Just 107foreign firms spent more than EUR2 million on R&D per annum in Ireland and these account for 88% of the total R&D spent by MNCs in Ireland, or well over 70% of the total business enterprise R&D spend.

Here’s Finfacts take on the hype: http://www.finfacts.ie/irishfinancenews/article_1028789.shtml.

In other words, stripping out MNCs with their R&D activity booked through Ireland mostly reflective of tax optimisation rather than actual research, one wonders just how much exactly does R&D contribute to our GDP or GNP and just how much of the failures of Irish R&D spending are down to quantum of spend as opposed to quality of spend? Problem is: we do not know. All Government research on the matter, including research by the likes of the OECD (based on Irish Government-supplied data), is probably heavily biased by the insiders dominating analysis.

Take the following two charts from OECD latest report on Science and R&D (http://www.oecd-ilibrary.org/science-and-technology/main-science-and-technology-indicators_2304277x)


So in the first chart, Ireland is above EU and OECD averages in terms of researchers employment intensity, but in second chart, Ireland is below EU and OECD averages in terms of R&D output intensity (by one metric).

Which begs a question - is this difference down to quality of researchers or down to type of research (e,g. non-patentable fields of sciences and humanities) or down to classification by, say MNCs, of some business & admin personnel as research personnel for tax purposes and to create a smokescreen of ‘organic’ as opposed to tax channeling activity in Ireland?

Who knows… But in 2011, per OECD data, 71.1% of total R&D expenditure by enterprises in Ireland accrued to foreign affiliates (the MNCs).  Subsequently, we stopped reporting such data. It is worth noting that this does not include companies that redomiciled into Ireland via tax inversions, adding which to the pile would probably shift this number closer to 90 percent.

In simple terms, aggregate spending figures tell us very little as to the nature of Irish R&D activities or their effectiveness. The real data is being hidden from our view by commercial secrecy that conveniently obscures just what exactly is happening in the economy and in our research sectors. May be, the knowledge economy of Ireland is a de facto a convenient deus ex machina for the severe skews in the economy arising from the MNCs presence here. Or may be, it is all just fine and a crop of Nobel Prizes and research accolades for the country are only a matter of few more quid pushed into R&D line of private and public expenditure.

Monday, January 4, 2016

4/1/16: Eurocoin signals flat 4Q 2015 growth in the Euro area


Euro area leading growth indicator Eurocoin, released by Banca d'Italia and CEPR, posted a reading of 0.45 in December, marking a rise from 0.37 in November and signalling some improvement in growth conditions. However, on 3mo average basis, 4Q 2015 reading came in at 0.393 against 3Q 2015 reading of 0.402. Given 3Q reading coincided with preliminary real GDP expansion of 0.3 percent, this suggests that actual growth did not tick up significantly from 3Q.


Overall, from both growth and inflation points of view, the ECB policies remain ineffective:


Overall, per Eurocoin release, the upside to the indicator in December was provided by  household consumption, labour market performance and the upturn in industrial production. In other words, we have domestic demand-driven growth, which is a net positive compared to the first half of 2015 when growth still relied predominantly on financial markets valuations and exports.

4/1/16: Global manufacturing weighted down by BRICs in December


According to Markit, “The global manufacturing sector ended 2015 on a disappointing note, with the rates of expansion in production and new orders both slowing in December. At 50.9, down from 51.2 in November, the J.P.Morgan Global Manufacturing PMI …fell to a three-month low. The average PMI reading over 2015 as a whole was below those registered in both of the prior two years.”

The new sub-sector data “covering consumer, intermediate and investment goods producers…signalled that the slowdown highlighted by the headline Global Manufacturing PMI during
December mainly reflected weaker expansion at investment goods producers and a further contraction in the intermediate goods sector. In contrast, growth accelerated slightly at consumer goods producers.”

Much of the deterioration is, apparently down to emerging markets weaknesses. “The end of 2015 saw the downturn in emerging market manufacturing continue, with PMI indices for China,
India, Brazil, Russia, Indonesia and Malaysia all in sub-50.0 contraction territory. Although the expansion in developed nations continued, growth slowed (on average) to an eight-month low.”

Note: I covered Manufacturing PMIs for BRIC economies in an earlier post here: http://trueeconomics.blogspot.ie/2016/01/4116-bric-manufacturing-pmis-december.html

You can see the ‘weighting’ effect in the chart here based on quarterly data:


And a summary table for Global Manufacturing PMI from Markit here:


Per Markit:

  • Growth rates fell to a 38-month low in the US
  • Growth eased to three-month low in the UK, 
  • Growth held steady in Japan, and 
  • Growth “accelerated to a 20-month high in the euro area.” 

Net outrun: global manufacturing has ended 2015 an inch closer to zero growth / stagnation point and certainly nowhere near the levels of growth consistent with amplification in global economic growth rates forward.

4/1/16: BRIC Manufacturing PMIs: December 2015 and 4Q 2015


BRIC Manufacturing PMIs posted another sector-wide weakening in growth conditions in December, ending 2015 on foot of an outright contraction across the sector in all BRIC economies for the first time since late 2013.

Russian manufacturing PMI posted a deterioration in sector performance in December, falling to 48.7 from 50.1 in November. This reverses two consecutive months of above 50 readings in October and November. On a quarterly basis, 4Q 2015 average reading was 49.7, which is better than 48.4 average for 3Q 2015, but still below 50.0 line. Overall December reading was the weakest since August 2015 and signals that the much anticipated stabilisation of the Russian economy did not take place in December. More detailed analysis of Russian PMIs is available here for monthly data and here for quarterly data. Overall, Russia was the third weakest PMI performer in Manufacturing sector terms within the BRIC group.

Brazil’s Manufacturing PMI remained deeply below 50.0 mark in December, although rising to 45.6 from 43.8 in November. December reading stands as the highest in 3 months, but still signals sharp rate of activity contraction. 4Q 2015 average is at 44.5, which is down on 46.7 average for 3Q 2015. Brazil has now posted Manufacturing PMI readings below 50.0 for 11 months in a row, the longest such record in the group of BRIC countries. In addition, Brazil remained the weakest performer in terms of Manufacturing PMIs in the BRIC group.

Per Markit: “Brazilian manufacturing companies reported worsening operating conditions at the end of 2015. December saw output and new orders dip at rates that, although slower, remained sharp…Amid evidence of cashflow problems, stocks of purchases and post-production inventories both decreased at rates that were the quickest in over six years. …severe downturn in the sector that was evident among the three monitored market groups: consumer, intermediate and investment goods. …December data pointed to a further decline in incoming new work, the eleventh in as many months. …Panellists indicated that a deeper economic retreat and falling purchasing power among consumers had led domestic demand to dwindle. Conversely, new orders from abroad rose. The weaker real had reportedly supported firms in securing new business from external clients. That said, the overall pace of expansion was only marginal.”

China Manufacturing PMI fell from 48.6 in November to 48.2 in October, marking 10th consecutive month of sub-50 readings and the weakest reading in 3 months. On a quarterly basis, 4Q 2015 reading was 48.4 which is somewhat better than 47.4 reading for 3Q 2015, although still signifying overall contraction in the sector. By all metrics, Chinese Manufacturing PMI came in second weakest in the BRIC grouping after Brazil.

Per Markit: “Operating conditions faced by Chinese goods producers continued to deteriorate in December. Production declined for the seventh time in the past eight months, driven in part by a further fall in total new work. Data suggested that client demand was weak both at home and abroad, with new export business falling for the first time in three months in December. As a result, manufacturers continued to trim their staff numbers and reduce their purchasing activity in line with lower production requirements. Meanwhile, deflationary pressures persisted, as highlighted by further marked declines in both input costs and selling prices.” Overall, this was the first time exports orders fell since September 2015.

India Manufacturing PMI posted a moderate drop from 50.3 in November to 49.1 in December, putting PMI reading below 50.0 line for the first time since June 2015. However, on a quarterly average basis, 4Q 2015 came in at 50.0, signalling zero growth in the sector over the last quarter of 2015, down from relatively robust growth posted in 3Q 2015 (with PMI averaging 52.1). PMI averaged 51.7 in 2Q 2015. The data confirms my previously expressed view that India is now skirting dangerously close to a manufacturing recession and that overall economic growth conditions in the economy have deteriorated significantly compared to 2014.

Per Markit: “Indian manufacturers saw business conditions deteriorate at the end of 2015. December’s incessant rainfall in Chennai impacted heavily on the sector, with falling new work leading companies to scale back output at the sharpest pace since February 2009. On the price front, inflation rates of both input costs and output charges were at seven month highs. …Consumer goods bucked the sub-sector trend and was the only category to see improving business conditions in December as production and new orders rose. Conversely, incoming new work and output fell in both the intermediate and investment goods market groups. Having risen for 25 straight months, total
manufacturing production in India fell during December. Furthermore, the rate of contraction was the sharpest in almost seven years.”

Summary table:

And a chart to illustrate


Hence, overall, as of December, 

  • Brazil manufacturing PMI continued to move along the general downward trend that started around 1Q 2013 and runs unabated since then, with Manufacturing recession setting in firmly from 2Q 2015 on. 
  • China, having displaced Russia for the second weakest position in the BRIC economies in terms of Manufacturing PMIs back in July 2015 remains the second weakest link in the BRIC group. Chinese manufacturing has been posting negative trend in PMIs since mid 2014, although in the last 3 months of 2015 this trend somewhat improved. 
  • Meanwhile, Russian Manufacturing is once again taking on water, having reverted down from a positive sub-trend that was present over May-November 2015.
  • Last, but not least, the bright star of India is now fading in terms of Manufacturing PMIs, with both trend (downward since December 2014 and more pronounced downward trend since July 2015) and absolute level of PMI reading signalling a risk of manufacturing sector recession in India. 

Overall, we now have all BRIC Manufacturing PMIs below 50 line for the first time since March 2009. This strongly shows overall continued downward pressures on growth in world’s largest emerging markets.

4/1/16: Russian PMI in 4Q 2015: Signalling Continued Weaknesses


Having Russian PMIs for December 2015 allows us to take a look at the economy quarterly performance signals. As noted in the previous post (http://trueeconomics.blogspot.ie/2016/01/4116-russia-services-manufacturing-pmis.html) with the decline in output reflected across both manufacturing production and services activity, Russian economy’s composite PMI averaged 49.1 in 4Q 2015 which is much worse than 50.4 average for 3Q 2015, suggesting that not only did the economy failed to attain stabilisation, but that growth might have turned more negative in 4Q 2015.

Let’s take a closer look at the quarterly averages by sector.

Russian Manufacturing PMI for 4Q 2015 stood at 49.7, which is a gain on 48.4 in 3Q 2015 and marks the strongest quarterly reading since 4Q 2014, but also marks the fourth consecutive quarter of sub-50 readings. The weaknesses in Manufacturing are especially troubling, as the sector is broadly targeted for imports substitution - a major policy shift by the Government since the start of 2015. Making matters worse, the sector should have benefited from strong ruble depreciation over the last 12 months, which - as it appears so far - did not lead to substantial increase in exporting activity. In part, this reflects weaknesses in global demand, but in part it reflects structural problems in Russian manufacturing that find goods supplied by the sector of generally non-competitive quality for global markets, even amidst improved price competitiveness.

Overall, we now have four consecutive quarters of sub-50 readings in Manufacturing sector - for the first time since 3Q 2008-1Q 2009 period.


Russian Services PMI for 4Q 2015 stood at 48.5, down sharply on 50.7 reading in 3Q 2015 and marking the weakest reading in the series since the start of 2Q 2015.Disappointingly, 4Q reading for Services sector broke two consecutive quarters of above 50 readings and done so sharply. Since the start of 1Q 2014, the sector has now posted sub-50 readings in 5 out of 8 quarters, and it managed to post statistically significant readings above 50 in only two quarters.


The above has meant that the composite activity index (distinct from Composite PMI) for Russian stood at 93.9 in 4Q 2015, which is an improvement on 90.3 in 3Q 2015, but marks fifth consecutive quarter of the overall production growth being negative (across combined services and manufacturing sectors). While 4Q composite indicator was the strongest in three quarters, it remains extremely weak (statistically significantly below zero growth marker of 100) and the third weakest of all quarters since the start of 3Q 2009.

On the net, therefore, while Russian economy posted some 4Q signals of growth consistent with less sharp contraction across combined Services and Manufacturing sectors, than in 2Q-3Q 2015, the deterioration in growth conditions in the economy in 4Q 2015 remained pronounced and this strongly suggests that we did not witness stabilisation of the Russian economy in 4Q 2015.


Stay tuned for analysis of BRIC PMIs next.

4/1/16: Russia Services & Manufacturing PMIs: December 2015


Russian PMIs are out for December 2015, so here is monthly data reading:

Russian Manufacturing PMIs posted a deterioration in sector performance in December, falling to 48.7 from 50.1 in November. This reverses two consecutive months of above 50 readings in October and November. It is worth noting that October-November readings were not statistically distinct from 50.0. On a quarterly basis, 4Q 2015 average reading was 49.7, which is better than 48.4 average for 3Q 2015, but still below 50.0 line. Overall December reading was the weakest since August 2015 and signals that the much anticipated stabilisation of the Russian economy did not take place in December.

Per Markit release: “Leading the deterioration in business conditions at Russian manufacturers was a fall in production. The rate of contraction quickened to the fastest since May 2009, with the majority of panellists linking this to a drop in new order intakes. As a result, a lower volume of post-production inventories was recorded. Meanwhile, Russian manufacturers continued to shed jobs during December. Falling employment has been reported in every survey period since July 2013, with the rate of contraction quickening to the sharpest in three months. The decline in staff numbers was matched by a solid deterioration in outstanding business volumes. Backlogs of work have been depleted in each of the past 34 survey periods. Elsewhere, incoming new orders slipped into decline in December, ending a three-month sequence of growth. However, the drop in new work was marginal and centred on intermediate goods producers. Data suggested that the main source of weakness was external, as export orders were down sharply.”

Chart to illustrate:


Russian Service PMI also reported a fall in output marking the third successive month of declines, driven by a slight decrease in new business levels. Job cuts continued in the sector as outstanding business deteriorated. The headline seasonally adjusted Russia Services Business Activity Index fell to 47.8 in December from already contractionary 49.8 in November. In 4Q 2015, average Services PMI reading was 48.5 against 50.7 in 3Q 2015, showing stronger deterioration in growth conditions in the sector in 4Q 2015. Current reading of 47.8 is the joint-weakest (with October 2015) for nine months.

Per Markit release: “New business levels at service providers slipped further into decline during December. However, the rate at which new work deteriorated was only marginal. Where a lower volume of new sales was recorded, panellists linked this to a combination of waning demand in the sector and payment difficulties being experienced by customers… With business activity at Russian service providers declining, pressures on operating capacity fell further in December. The rate at which work-inhand depleted eased to the slowest in three months yet remained solid overall. Anecdotal evidence suggested that lower backlogs of work were attributed to a drop in new business. Falling staff numbers have been reported in every month since March 2014, with the latest drop at a faster pace than in November. There was some evidence that lower employment reflected squeezed cash availability at service providers.”

Chart to illustrate:


Finally, Russia’s Composite index slipped into contraction during December, falling to 47.8, from 50.5 in November, with the decline in output reflected across both manufacturing production and services activity. Overall, Russian economy’s composite PMI averaged 49.1 in 4Q 2015 which is much worse than 50.4 average for 3Q 2015.


The data strongly suggests that not only did the economy failed to attain stabilisation, but that growth might have turned more negative in 4Q 2015.

I will be posting on quarterly figures for PMIs next, so stay tuned for more.

Saturday, January 2, 2016

2/1/16: Россия, Украина и ЕС: полтора года переговоров впустую


My comment for BBC Russian Service on the stalemate in EU-Russian-Ukrainian talks concerning the EU-Ukraine trade agreement:  http://www.bbc.com/russian/business/2015/12/151229_trade_russia_ukrain_eu.

In summary: the failure of the talks is mutual.


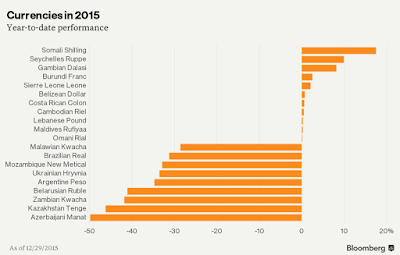
2/1/16: Bloomberg Guide to Markets: 2015 Summed Up


In case you want a neat (although narrow) summary of 2015 in the markets, here's one via Bloomberg:

For Equities:

For Currencies:

For Government Bonds:

And more here: http://www.bloomberg.com/news/articles/2015-12-31/here-are-the-best-and-worst-performing-assets-of-2015.

2/1/16: Don't miss that Urals spread


Over recent months, I have been highlighting the importance of considering, when it comes to Russian economy and Ruble analysis, not just quoted spot prices for Brent grade oil but also the Brent-Urals spread.

At last, some media (in Russia) is catching up: Падение спроса на российскую нефть и сильный доллар не дают рублю укрепиться - http://invst.ly/ocwh.


2/1/16: The Future of Global Finance: Moscow 2015


Back at the start of December, I spoke at an international finance conference in Moscow covering developing trends in global finance.  You can find the conference archive (in English) here: http://cmconference.ru/en/about including videos of presentations. My interview relating to the conference is available here: https://www.youtube.com/watch?v=g7Og2yIDaGY. Some coverage of the conference in the press here: http://www.vestifinance.ru/articles/65070.


2-я Международная финансовая конференция «Валютные рынки. Мировые практики» проходила в Москве 18-19 ноября. Она была организована ГК Teletrade, совместно с Dow Jones, Google и Московской школой управления «Сколково». Архив конференции, включая видео презентаций (Русская версия): http://cmconference.ru/ru/about.


2/1/16: QE for the People 2016


Back in March 2015, I have signed a group petition in support of the QE for the People idea of using monetary policy to directly inject funding into the economy via households' budgets. Since then the idea continued to gain traction and in December 2015 the campaign issued an in-depth analysis of the idea, and a renewed call for public and professional engagement.

2/1/16: SOSV Slingshot 2015: Mentoring Start Ups


Totally forgot about this event few months back, but thanks to Silicon Republic, have a video to post here. I was honoured to be invited by SOSVentures to speak and participate in mentoring rounds at the SOSV Slingshot: Dublin event for start ups.

Here are the videos from discussions that took place at the event: https://www.siliconrepublic.com/start-ups/2016/01/01/start-up-advice-accelerators-ireland.

Enjoy!


Friday, January 1, 2016

1/1/16: Another VEB update: things are getting crunchier...


And another update to the long-running saga of VEB - Vnesheconombank - that I covered over a week ago here: http://trueeconomics.blogspot.ie/2015/12/231215-vnesheconombank-where-things.html.

Latest rumour mill is that VEB will need "AUD24.67 billion" - which is within the range we've heard for some time already.

About the only new bits we get from Moscow are:


The key point of the VEB saga, however, is still not adding up. As covered in my post, VEB is facing some USD19.3 billion in debt maturing through 2025 with less than USD8 billion due through 2018. So why USD18 billion in capital hole, then?

Moodys note from earlier this week explained (emphasis mine):

"VEB Group's problem loans/gross loans ratio (including impaired but not overdue loans) increased to 39.3% as of end-2014 compared with 19.7% as of end-2013. Moody's estimates that the bank has already recognized a substantial portion of these problem loans and therefore further growth of problem loans should be contained. However, VEB remains highly exposed to single-name concentration risk and risks associated with its subsidiaries, particularly the Russian banks bailed out in 2008-09 and Prominvestbank in Ukraine.

Moody's notes that VEB's profitability metrics have substantially deteriorated, as reflected in its return on average assets (RoAA) ratio of -3.7% in the first half of 2015, following RoAA of -7.2% posted in 2014. ...At the same time, its net interest margin declined to 1.9% in H1 2015 relative to 2.7% in 2014, which reflected growing funding costs and an increasing problem loans.

Moody's anticipates some improvements in VEB's core profitability metrics following a normalization of Russian financial market conditions and gradual stabilization of problem loan levels. Nevertheless, VEB will not achieve breakeven over next 12-18 months due to still high provisioning charges and weak core profitability metrics.

VEB's standalone credit worthiness is also supported by its capital levels, which have historically been maintained by the government. VEB's statutory capital ratio (N1.0) was 12.4% as of H1 2015, which was higher than the regulatory minimum of 10%, which VEB has to respect due to its Eurobond covenant. Moody's notes that the government's regular capital injections have totalled around RUB559 billion in Tier 1 capital and $6 billion in Tier 2 capital since 2007. However, future capital increases may come in a less tangible form, e.g. via the provision of cheaper funding resulting in a fair value gain under IFRS, rather than through paid-up capital."

There are some EUR 9 billion worth of eurobonds issued by the VEB still outstanding.

In other words, we have a 'development bank' (not a retail bank) that is bound by 10% capital ratio, that, absent that ratio would require much less capital than USD18 billion. It will be interesting to see how Moscow can restructure capital in VEB to avoid an absolutely massive capital blackhole, but I suspect there will be some financial acrobatics involved.

1/1/16: Developers Questioning Banking Inquiry Report


While we do not know what is in the Banking Inquiry report signed-off this week, concerns being expressed by the two developers, namely Michael O’Flynn and Johnny Ronan, that the report is likely to be a whitewash of Nama is a legitimate one.

The inquiry basically and obviously failed to provide platform for the voices critical (or robustly critical) of Nama, opting instead to put forward testimonies of some developers who have potential coincident / congruent interest in seeing Nama escaping serious criticism.

Thus, legitimate suspicion can be (though we should wait to confirm or decline it) that the Banking Inquiry report will indeed skip over Nama's core role in creating a dysfunctional (and currently strongly legally challenged) crisis resolution environment in Ireland. And another legitimate suspicion (based on past record of coverage of the Inquiry in the media) is that most of Irish media will be unlikely to robustly challenge the report on any conclusions regarding Nama.

That said, let's wait and see the report...


1/1/16: Historical Default Cycles: Are We Testing the 'Norm'?


Having written before about the growing signs we are upon a new default cycle (see, for example, post here http://trueeconomics.blogspot.ie/2015/12/301215-us-junk-bonds-heading-into-new.html), it is only fitting that I should highlight the latest article from Carmen Reinhart in which she talks about default 'waves' or cycleshttps://www.project-syndicate.org/commentary/sovereign-default-wave-emerging-markets-by-carmen-reinhart-2015-12#d0X1sQB3KuUHlp7A.99.

Key chart:

Reinhart says that "From a historical perspective, the emerging economies seem to be headed toward a major crisis. Of course, they may prove more resilient than their predecessors. But we shouldn’t count on it."

I can add, either that, or count on a new wave of 'competitive devaluations' or 'currency wars' and forget about any 'normalization' in the interest rates.