Showing posts with label China Manufacturing PMI. Show all posts

Sunday, January 5, 2020

5/1/20: BRIC Manufacturing PMIs 4Q 2019


As global manufacturing sector activity barely stayed above the recession line in 4Q 2019, BRICs manufacturing PMIs indicated a cautious upswing in activity, with exception for Russia and India. Here are the core details:

  • Brazil's 4Q 2019 Manufacturing PMIs averaged 51.8, statistically unchanged on 3Q 2019 figure of 51.9. Both 3Q and 4Q readings were statistically above 50.0, indicating modest growth, and above historical average of 50.3. Nonetheless, 4Q 2019 reading was the second lowest in six consecutive quarters.
  • Russia posted its second consecutive quarter of recessionary growth readings for manufacturing sector, with quarterly average PMI slipping to 46.8 in 4Q 2019, down from 48.2 in 3Q 2019, making 4Q contraction the sharpest since 2Q 2009. All in, the last time Russian manufacturing sector posted statistically above 50.0 reading was in 1Q 2019. The signal here is severely negative to overall growth prospects for the Russian economy for the entire 2019 and a major concern for the 1H 2020 dynamics. 
  • China manufacturing PMI surprised to the upside in the last quarter of 2019, rising from 50.6 in 3Q 2019 (a reading statistically indistinguishable from zero growth 50.0 mark) to 51.7 in 4Q 2019 (a reading indicating moderate expansion, compared to the historical average of 50.8). Statistically, Chinese manufacturing has not been in an expansion mode over 3Q 2018 - 3Q 2019 period, which makes 4Q 2019 reading an important signal of a potential turnaround.
  • India manufacturing PMI averaged 51.5 in 4Q 2019, slightly down on 51.8 in 3Q 2019. This is the weakest level since 3Q 2017, but statistically it is still indicative of expansion in the sector.
Overall, BRIC Manufacturing PMI (based on each country share in global GDP) has improved from 50.7 in 3Q 2019 to 51.2 in 4Q 2019, marking the fastest rate of the group's manufacturing sector expansion 1Q 2018 and the second consecutive quarter of the index being statistically above the 50.0 zero growth line.

Globally, manufacturing sector growth conditions improved from 49.5 in 3Q 2019 to 50.1 in 4Q 2019, although statistically, no reading from 2Q 2019 onwards was significantly above or below the zero growth 50.0 line.


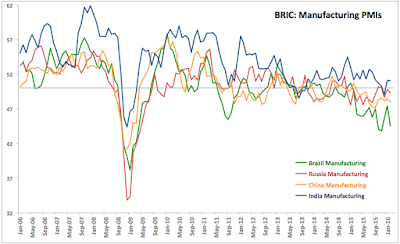
As the chart above clearly shows, Global Manufacturing sector activity remains extremely weak. On-trend, more recent BRICs Manufacturing sector growth is above that of the Global PMI signal, but both show weaknesses. 

Monday, March 4, 2019

4/3/19: BRIC Manufacturing PMI: January-February Trend


In January-February 2019, Global manufacturing PMI sunk to its lowest reading since 2Q 2016 averaging 50.7 over the first two months of the year. With it, the slowdown has also been impacting the BRIC economies, overall BRIC Manufacturing PMIs average 41.2 in 4Q 2018 based on each country share of the global GDP for 2018, below 51.83 average for Global Manufacturing PMI over the same period. In the first two months of 2019, BRIC Manufacturing PMI was around 50.8, statistically indistinguishable from the 50.7 Global PMI average.


As the chart above clearly indicates, poor BRIC performance was driven by a contraction-territory reading for China (49.1 in January-February 2019 as opposed to stagnation-signalling 50.0 in 4Q 2018), and Russia (50.5 for the first two months of 2019, against 4Q 2018 average of 51.9). In contrast, both Brazil and India outperformed BRIC and Global PMI readings. Brazil's Manufacturing PMI averaged 53.1 in the first two months of 2019 against 52.1 in 4Q 2018, while India's PMI rose to 54.1 in January-February this year against 53.4 in 4Q 2018.

All in, Manufacturing sector leading indicator suggests a major slowdown in the Global growth momentum, and some spillover of this slowdown to Russia and China.  Brazil's robust reading so far marks the fastest pace of expansion since 1Q 2010, on foot of a recovery from a very long and painful recession. India's reading is the highest since 2Q 2012. If confirmed over March and over Services PMI, this implies a major diversion of growth momentum within the BRIC group.

Wednesday, January 3, 2018

1/3/18: BRIC Manufacturing Sector ends 2017 with an upside


Quarterly Manufacturing Sector PMIs for BRIC economies have once again underperformed global indicators in 4Q 2017.

Global Manufacturing PMI for 4Q 2017 stood at 54.0, up on 53.0 in 3Q 2017 and marking the fastest rate of quarterly expansion in the sector on record (since 2Q 2013*). In comparison, BRIC Manufacturing quarterly PMI-based indicator stood at 51.6 in 4Q 2017, up on 51.0 in 3Q 2017. This marks the highest reading for the BRIC Manufacturing PMIs (quarterly basis) since 1Q 2013.


For individual BRIC economies:

Brazil Manufacturing Quarterly PMI measure was up at 52.4 in 4Q 2017, rising from 50.6 in 3Q 2017 and marking the third consecutive quarter of above 50.0 (nominal) readings. In statistical terms, 4Q 2017 was the first quarter with statistically significant growth signal since 1Q 2013, and marked the second fastest pace of expansion since 1Q 2011. With three consecutive quarters of above 50.0 nominal indicator readings, it is reasonable to assume that the Manufacturing sector recession of 3Q 2013-1Q 2017 is now over and the economy is moving into a new period of expansion.

Russia Manufacturing q-PMI measure slipped from 52.1 in 3Q 2017 to 51.5 in 4Q 2017. Russian Manufacturing has been posting distinctly weaker PMI readings in 2Q 2017 - 4Q 2017, with sharper pace of expansion of 4Q 2016 - 1Q 2017 being replaced by rather anaemic rates of growth since the start of 2Q 2017. This stands contrasted by Services sector that currently drives Russian economic growth. 

China Manufacturing posted q-PMI reading of 51.1 in 4Q 2017, marginally unchanged on 51.2 in 3Q 2017. Since 3Q 2016, Chinese Manufacturing was held within the pattern of weak growth, with q-PMIs ranging from 50.1 though 51.3. In fact, last time Chinese Manufacturing q-PMI reached above 51.3 was in 1Q 2013. Judging by PMIs, Chinese manufacturing is barely growing. Which continuously puts a big question mark over both the headline GDP figures coming out of China and the PMIs.

India Manufacturing qPMI jumped from 50.1 in 3Q 2017 to 52.5 in 4Q 2017, the highest rate in 12 quarters. Both Services (48.0) and Manufacturing (50.1) were very soft in 3Q 2017, and the to-date (through November 2017) reading for qPMI for Services sector (50.1) is still weak, so 4Q reading for Manufacturing qPMI is a welcome sign that things might be firming up on the growth side.

All, in, BRIC Manufacturing sector remains a weak contributor to Global growth. This weakness appears to be structural and consistent across a range of years. Dynamically, both Global and Manufacturing qPMIs are closely correlated and have been running in tandem since 2Q 2014.


*Please, note: my data for this indicator - not reported by Markit, but based on market’s monthly reports - goes only to 2Q 2013. Markit have repeatedly ignored my requests for data going back before that period, despite their claim that they assist independent academic researchers in gaining access to their data.

Monday, April 10, 2017

9/4/17: BRIC Manufacturing PMIs 1Q 2017: Stalling Momentum


1Q 2017 PMIs for Manufacturing are painting a mixed picture for the world's largest emerging economies, the BRIC group.

Brazil's Manufacturing PMIs averaged 46.8 in 1Q 2017, compared to 45.9 in 4Q 2016 and 46.0 in 1Q 2016. All in, 1Q 2017 marked 12th consecutive quarter of Manufacturing PMIs signalling contraction in activity. Although 1Q 2017 reading was the highest since 1Q 2015, current indicator simply implies that the rate of Brazilian manufacturing sector contraction has abated somewhat, even though the downward momentum remains in place. This means that Brazil remains the worst performing BRIC Manufacturing sector for the eighth consecutive quarter. One relatively brighter spot is that March Manufacturing PMI for Brazil came in at 49.6 - the highest monthly reading since February 2015 and relatively close to zero growth line of 50.0. It is worth watching in months to come if there is a sustained momentum in Manufacturing activity up, and if Brazil finally starts showing signs of an economic recovery from what has proven to be a horrific recession so far.

Russian Manufacturing PMIs averaged 53.2 in 1Q 2017, unchanged in 4Q 2016 and up on 49.1 average for 1Q 2016. This marks the third consecutive quarterly PMI reading for Manufacturing that sits above 50.0 marker. As Russian economy gained significant recovery momentum in 4Q 2016 and into 1Q 2017, Russia now leads BRIC Manufacturing PMIs for the second consecutive quarter, providing solid upward support for global manufacturing growth. Still, despite robust numbers and despite three consecutive quarters of growth, Russian manufacturing sector and the economy at larger remain relatively exposed to the downside risks, including risks relating to energy and commodities prices, as well as to the lack of structural reforms within Russia. We have been awaiting for some time now for the long promised Government plans for achieving sustainable growth in the economy into the early 2020s, and the plan is still lacking.

Indian Manufacturing PMIs averaged 51.2 in 1Q 2017, down from 52.1 in 4Q 2016 and worse than 51.5 reading for 1Q 2016. 1Q 2017 was the weakest of three consecutive quarters, suggesting that the economy is having difficulty recovering from the botched de-monetization experiment by the Indian Government. Few outside India are willing to call the experiment botched, primarily because it involved advice and partial funding from the U.S. agencies, but the process was a disaster for the Indian economy.

Chinese Manufacturing PMIs also came with a disappointing whimper. PMIs averaged 51.3 in 1Q 2017 on par with 4Q 2016, quashing the hopes that the credit stimulus of the 2H 2016 will translate into domestic demand uplift. Current index reading for China is not statistically significantly different from 50.0, implying a general lack of growth momentum in the Chinese manufacturing. So far, Manufacturing PMIs managed to stay above 50.0 marker (nominally, not statistically) for three consecutive quarters, but the total average for these quarters is coming in at only 51.0.

Table and charts below summarise BRIC Manufacturing PMIs dynamics through 1Q 2017:


Overall, BRIC Manufacturing PMI Average (a metric computed by me using Markit data) came in at 51.1 in 1Q 2017, down marginally on 51.2 in 4Q 2016, although up on 49.2 reading for 1Q 2016. As the chart above clearly shows, of all BRIC economies, only Russia is posting Q1 2017 Manufacturing activity in line with Global Manufacturing growth and dynamically, BRIC as a group is exerting downward pressure on global manufacturing sector.

The news, therefore, are not great for the global manufacturing economy (stalled growth momentum in 1Q 2017), and for the BRIC economies.

Stay tuned for analysis of Services and Composite figures.

Saturday, March 4, 2017

3/3/17: BRIC Manufacturing PMI: Weaker Support for Global Growth in 1Q


The latest BRIC Manufacturing sector PMIs for February are continuing to signal support for global growth albeit at weaker rates than in 4Q 2016.

Brazil Manufacturing PMI for February came in at 46.9, slightly less sharp of a rate of contraction than 44.0 in January 2017. This marks 25th consecutive month of Brazil’s Manufacturing PMIs at below 50.0 - the point of zero growth. The rate of decline in Brazil’s case is shallowest since January 2016, but the series are quite volatile and at 46.9, the index is statistically significantly below 50.

Russian Manufacturing PMI moderated from 54.7 in January to 52.5 in February, but the index remained statistically above 50.0, signalling robust growth. This marks 7th consecutive month above with PMI above 50 and the 5th consecutive month that Manufacturing PMI exceeded 50.0 by a statistically significant margin, as the Russian economy continued on its expansion trend.

Chinese Manufacturing PMI cam in at 51.7, still below statistically significant growth line, but above 50.0 nominally, marking 8th consecutive month of above 50 readings (none of these readings were statistically significant, however). 51.7 marks a slight improvement on January’s 51.0.

India’s Manufacturing PMI rose to 50.7 in February from 50.4 in January. This marks the second consecutive month with above 50.0 nominal readings, but the index remains statistically indistinguishable from 50.0 zero growth mark.

Table below uses January-February average PMI for 1Q 2017 reading and compares it against full quarter averages for Manufacturing PMIs for previous quarters.


Chart below illustrates quarterly averages trends:


As shown in the chart above, 1Q 2017 results to-date indicate slightly weaker growth support from the BRIC economies overall, based on Manufacturing sector activity alone. Global growth in manufacturing continued to accelerate in the first two months of 2017, while BRIC Manufacturing posted slightly weaker growth in 1Q so far. The downward momentum in BRIC Manufacturing growth was driven by 
  • Brazil (experiencing accelerated contraction in 1Q to-date compared to 4Q 2016)
  • India (experiencing sharply slower growth in 1Q 2017 to-date compared to 4Q 2016)
Offsetting these trends,
  • Russian growth in manufacturing sector accelerated in the first two months of 2017 compared to 4Q 2016; and
  • Chinese growth in the sector remained roughly unchanged in January-February 2017 compared to 4Q 2016.


I will be posting on Services sector PMIs and Composite PMIs once we have data for Brazil.

Friday, February 3, 2017

2/2/17: BRIC Manufacturing PMIs: Russia Leads, Brazil Drags


Quick run through the Manufacturing PMIs for January for BRIC economies:

Brazil's Manufacturing PMI slumped to 44.0 in January 2017, down from 45.2 in December, marking 24th consecutive month of sub-50 readings. Worse, rate of contraction in the sector fell to 46.3 in October 2016, prompting some analysts to declare a possible turnaround in Latin America's largest economy. This has now been fully erased, with month-after-month drops through January. January reading is so dire, it marks the lowest reading in seven months and the fourth lowest reading since April 2009 and ninth lowest on record. Three-month average through January sits at 45.1, which is worse than 46.0 3mo average previously and 45.6 3mo average reading through January 2016. In simple terms, economic contraction is accelerating in the case of Brazil, despite the fact that the country has been in a crisis since mid-2013.

Russian Manufacturing PMI continued to surge in January, rising from 53.7 in December 2016 to 54.7. This marks 6th consecutive above-50 reading and, more importantly, marks the highest rate of growth in 70 months (since March 2011). Another important marker, the index has posted increasing rates of growth every month since July 2016, and has now broke away from the resistance at 53.6-53.7. Index's 3mo average though January 2017 is at 54.0, marking a huge reversal of fortunes compared to 3mo average through January 2016 (49.5). All of this is consistent with rapid recovery from the 2014-2016 crisis and we can date the start of this recovery back to May-June 2016, based on Manufacturing data.

India's Manufacturing PMI regained 50.0 territory rising to statistically insignificant 50.4 in January 2017 from 49.6 in December 2016. 3mo average through January 2071 is at 50.8, which is slightly better than 50.2 3mo average a year ago. The rate of Manufacturing expansion is the second slowest in 13 months, implying that the recovery in the Indian economy is still very fragile. As I noted in 4Q analysis of BRIC PMIs last month, India is suffering from the economic crisis brought about by botched de-monetisation of its economy. This crisis appears to be easing, but is not over, yet.

China's Manufacturing PMI failed to gain faster momentum compared to December 2016 (51.9), falling back to 51.0 in January 2017. 51.0 is not a statistically significant reading for growth in China's case, although the index reading in January was still third highest since August 2014. Chinese Manufacturing PMIs have now been notionally (but not statistically) above 50.0 in five consecutive months. Current 3mo average is at 51.3, which is a sizeable improvement on 3mo average through January 2016 (49.5). Still, current PMI reading continues to signal substantial weakness in Chinese Manufacturing and is a reason to worry.

Charts below plot the trends in Manufacturing PMIs and tabulate more recent changes:


Chart below contextualises January PMI readings into quarterly data set and includes comparative for the Global Manufacturing PMI:

Overall, Russia continues to lead BRIC economies in Manufacturing PMI readings for the third month in a row. China comes in second after Russia for the second month in a row. India is effectively posting stagnant economic performance, while Brazil is showing accelerated rate of contraction.

Thursday, January 5, 2017

4/1/17: BRIC Manufacturing PMI: 4Q 2016 and FY 2016


Manufacturing PMIs for BRIC economies are out for December, so let’s update my quarterly series. As readers of this blog know, I primarily switched away from covering monthly PMIs because there is little one can add to the Markit own analysis. Instead, I have been focusing on covering quarterly results.

Table below summarises key levels of average quarterly PMIs for Manufacturing:


Brazil’s continued recession, over the course of 2016 remained deeper, judging by Manufacturing PMIs than both 2014 and 2015. 4Q 2016 Manufacturing PMI reading came in at 45.9, which signals no change in the rate of contraction on 3Q 2016 (45.9) and a slight improvement on 4Q 2015 (44.5). All in, Brazil’s Manufacturing remained at below 50.0 reading for 11th quarter in a row, and controlling for statistical significance, the country Manufacturing sector have not seen any expansion since 1Q 2013. In these terms, the country is in a far worse shape than any other BRIC economy. FY 2016 PMI average for Brazil’s Manufacturing is at 45.1, which is worse than 2015 average (46.5) and 2014 average (49.6). Even in the dire days of 2009, Brazil’s Manufacturing PMI managed to average 48.2. In other words, Brazil’s state of Manufacturing currently is worse than at any time on record.

Russian Manufacturing PMI for 4Q 2016 came in at 53.2, marking second consecutive quarter of above 50 readings, and the first quarter of statistically significant expansion. This is a welcome sign, confirming economic recovery, albeit still fragile one. To call a full recovery we need to see at least one-two more quarters of above 52.0 readings. Nonetheless, 2016 FY average is at 50.6, which is way better than 2015 FY average (48.7) and 2014 average (49.6). In fact, 4Q 2016 reading is the highest in 23 quarters (we have to go back to 1Q 2011 to get a higher level) and the seventh highest since 1Q 2006.

Chinese Manufacturing PMI averaged 51.3 over 4Q 2016, up on 50.2 average in 3Q 2016. As in the case of the Russian Manufacturing, Chinese PMIs posted second consecutive quarter of expansionary readings (adjusting for statistical significance both 3Q and 4Q were not significantly above 50 line). However, unlike Russian Manufacturing PMI, Chinese Manufacturing PMI remained below 50.0 mark for FY 2016 (at 49.8) and this marked the third year in a row that the average FY PMI was below expansion line (2015 FY average was 48.7 and 2014 FY average was 49.7).

Not to forget about India: Indian Manufacturing PMI averaged 52.1 in 4Q 2016, down slightly on 52.2 average through Q3 2016, but up on 50.0 reading in 4Q 2015. FY 2016 average reading is 51.7, which is marginally better than 51.5 average for FY 2015, but worse than 52.1 average for the FY 2014. India now had 13 consecutive quarters of above 50 readings for Manufacturing PMI (controlling for statistical significance, just two consecutive quarters).

Key takeaways:

1) As the chart below clearly shows, Chinese Manufacturing PMIs have been bouncing within statistical zero growth range since the start of H2 2011. Russian Manufacturing PMIs exhibited broadly the same dynamics since the start of 2Q 2013. Brazil’s PMIs have been in a disaster zone from around the same time as Russia’s started signalling stagnation. In fact, with exception of 4Q 2012 and 1Q 2013, BRIC Manufacturing PMIs were in the doldrums since 3Q 2011 on. Which, sort of, exposes the lie of the Russian recession being caused by geopolitical risks and sanctions. It was not. The recession was long coming and its causes are coincident across China, Brazil and Russia, with India being an exception to the BRIC grouping throughout the entire period covered by data.


2) Also per chart above, BRIC Manufacturing is now on a recovery trend that is still requiring confirmation over the next 2 quarters. This trend is in line with Global PMI index trend for the sector.

3) Russia is now the strongest performing BRIC economy in Manufacturing terms, followed by India, and with a significant gap - China. Brazil, meanwhile, continuing to act as a drag on both BRIC and global Manufacturing growth.


As an aside: I am glad that my 3Q 2016 analysis for @businessinsider @AkinOyedele Most Important Charts feature is being confirmed by 4Q data as well.

Tuesday, October 11, 2016

11/10/16: BRIC Manufacturing PMI: 3Q 2016


With all PMI data in (China Services data delay was a strange aberration this month), we can tally up 3Q 2016 PMI results. Based on 3mo averages, here is the summary for Manufacturing sector:

Brazil: Over 3Q 2016, Brazil’s Manufacturing sector continued to post sub-50 readings, indicating a strong pace in economic contraction. Overall, 3Q 2016 average Manufacturing PMI came in at 45.9, which is a single of slower economic contraction compared to 2Q 2016 (42.5), but basically the same rate of decline as in 1Q 2016 (46.0). 3Q 2016 was 10th consecutive quarter of sector contraction in Brazil. Worse, PMI for Brazil’s manufacturing has now averaged 49.9 over the period from 1Q 2007 through 3Q 2016. In other words, average quarterly PMI has been consistent with zero growth for 10 and a half years now.

Russia: In contrast to Brazil’s misfortunes, Russian manufacturing PMI strengthened from 49.7 in 2Q 2016 to 50.5 in 3Q 2016, reaching above 50.0 level for the first time since 4Q 2014. Still, at 50.5, the reading is not statistically different from 50.0 and signals weak turnaround in the sector. 3Q 2016 level of PMI breaks a string of 6 consecutive quarters of sub-50 readings. The depth of Russian downturn is self-evident: the last time Russian Manufacturing PMI reached above 50.0 on a statistically significant basis was in 1Q 2013. However, for all the troubles with the economy, Russian performance is significantly stronger than that of Brazil across recent years. In addition, 3Q 2016 reading for Russia is the second strongest in BRIC group, after that of India. To keep things in longer term perspective, however, Russian Manufacturing quarterly PMI averaged just 50.2 since 1Q 2007, hardly a sign of any serious growth over the last 10 and a half years.

China: Chinese Manufacturing PMI averaged 50.2 in 3Q 2016, up on 49.1 in 2Q 2016 and the strongest reading in 8 quarters. As with Russian Manufacturing PMI, Chinese reading for 3Q 2016 is not statistically different from 50.0, and once adjusted for the strong positive skew in the historical data probably underlies continued major slowdown trend in the economy. Again, for comparative purposes, since 1Q 2007, Chinese Manufacturing quarterly PMI averaged just 50.7 - a figure ahead of both Brazil’s and Russia’s, but still a reading that is too weak for the rapidly growing economy dependent on Manufacturing. 

India: India’s Manufacturing PMI averaged 52.2 in 3Q 2016, which represents a substantial rise on 51.0 average in 2Q 2016 and marks the fastest pace of sector growth in the country since 4Q 2014. 3Q 2016 also marked 12 consecutive quarter of above 50 readings for Manufacturing PMI. In contrast to all other BRIC economies, India’s Manufacturing PMI averaged 51.7 reading consistent with growth for the period between 1Q 2007 through 3Q 2016.

Overall, BRIC Manufacturing PMI did firm up in 3Q 2016, with three out of four BRIC economies reporting nominal above-50 readings for the index for the first time since 1Q 2014. As the result of improving conditions across all BRIC economies, BRIC Manufacturing PMI reached 50.4 in 3Q 2016, up on 49.0 in 2Q 2016. The rise is broadly in line with Global Manufacturing PMI improvement from 50.4 in 2Q 2016 to 51.0 in 3Q 2016.

Table below summarises recent changes:


Chart below highlights key dynamics in Manufacturing PMIs:


Thursday, March 3, 2016

2/3/16: BRIC Manufacturing PMI: February


BRIC manufacturing sector conditions have posted major deterioration in February 2016 compared to January, marking another ugly month for world’s largest emerging economies.

Russian Manufacturing PMI for February posted a rather unsurprising and relatively mild deterioration from already marginally-recessionary reading in January. Details are covered here: http://trueeconomics.blogspot.com/2016/03/2316-russia-manufacturing-pmi-february.html.

Chinese Manufacturing PMI continued to tank in February, with country Manufacturing sector remaining the weakest of all BRICs, save Brazil, every month since July 2015. The details are covered here: http://trueeconomics.blogspot.com/2016/03/2316-china-manufacturing-pmi-february.html.


Meanwhile, Brazil’s manufacturing recession “extended to February, with a further drop in incoming new work leading companies to lower production and cut jobs again. Such was the extent of the downturn that firms shed jobs at the second-fastest pace since April 2009,” per Markit.

Brazil’s Manufacturing PMI fell from an ugly 47.4 in January to a horrific 44.5 in February, marking 13th consecutive sub-50 reading. On a 3mo average basis, Brazil’s Manufacturing remained in a contraction (45.8) over the 3mo period through February 2016, just as it was in the contraction (44.0 average) in the 3mo period through November 2015. In 3mo period through February 2015, PMI averaged 50.2.

Per Markit: “Amid evidence of an increasingly fragile economy and a subsequent fall in demand, the level of new business received by Brazilian manufacturers decreased in February. Having accelerated to the fastest since November 2015, the pace of contraction was steep. As a consequence, companies scaled down output again. Production dipped at a sharp and accelerated rate.
Supported by the depreciating real, new foreign orders for Brazilian manufactured goods improved for the third straight month in February. That said, new business from abroad increased at a modest pace overall.”

All in, Brazil remains BRIC’s weakest economy in Manufacturing sector terms every month since February 2015.


As in previous months, India was the only BRIC economy with Manufacturing PMI reading above 50.0 marker. In February 2016, Indian Manufacturing PMI stood at 51.1, unchanged in January 2016. The positive impact of this, however, is weak, at 51.1 marks relatively low (by historical comparisons) growth in the Indian Manufacturing sector.

Per Markit: “Manufacturing business conditions in India continued to improve, with new orders, exports, output and purchasing activity all rising in February. However, a faster expansion in new business inflows failed to lift growth of output and workforce numbers were left broadly unchanged again. PMI
data also highlighted a weaker rise in costs and the first reduction in selling prices since September 2015… Reflecting sustained growth of new work, Indian manufacturers raised their production volumes in February. That said, the rate of expansion eased since January and was marginal overall.”

On a 3mo MA basis, Indian Manufacturing PMI averaged 50.4 in 3 months through February 2016, down on 50.7 average for the 3mo period through November 2015 and down massively on 52.9 3mo average through February 2015.

Overall, India remains the best performing economy in the BRIC group, even though its Manufacturing sector growth is now in slow growth mode since September 2015.


In summary, in February, BRIC group of world’s largest emerging markets economies has posted another deeply disappointing performance across the Manufacturing sector. This compounds adverse headwinds in these economies in January and signals strong possibility of the BRICs exerting a significant negative pressure on global growth.

Wednesday, March 2, 2016

2/3/16: China Manufacturing PMI: February


Chinese Manufacturing PMI for February signalled worsening operating conditions in the sector and marked 12th consecutive month of recessionary readings, reaching 48.0 in February, down from 48.4 in January and down from 50.7 in February 2015.

Per Markit: “Operating conditions faced by Chinese goods producers continued to deteriorate in February. Output and total new orders both declined at slightly faster rates than at the start of 2016, which in turn contributed to the quickest reduction in staffing levels since January 2009. Lower production was a key factor leading to the steepest fall in stocks of finished goods in nearly four-and-a-half years during February. At the same time, lower intakes of new work enabled firms to marginally reduce their level of work-in-hand for the first time in ten months. Prices data indicated weaker deflationary pressures, with both selling prices and input costs
declining at modest rates.”

On a 3mo MA basis, 3mo average through February stood at 48.2 - second lowest in the BRICs, up marginally on 48.0 3mo average through November 2015, but down on 50.0 3mo average through February 2015.

It is simply impossible to imagine how this data can be consistent with 6.9 percent growth recorded in 2015 or with over 6% growth being penciled for 1Q 2016.


As shown above, China is now a consistent under-performer in the BRIC group since July 2015 with its Manufacturing PMI reading below that of Russia (in a recession) and above Brazil (in a deep recession).

2/3/16: Russia Manufacturing PMI: February


Russian Manufacturing PMI for February produced another disappointment, falling from a marginally contractionary reading of 49.8 to somewhat faster contraction-signalling 49.3.

Per Markit, “Russian manufacturers reported a further deterioration in operating conditions during February, the third in as many months. Job cuts
were evident amid a sharp fall in backlogs of work. However, production remained broadly unchanged as a slight rise in new orders was reported. Meanwhile, price pressures remained evident, as both output charges and input costs rose.” So firms effectively were reducing their backlogs of orders, with work-in-hand reductions continuing now every month since March 2013.

On a slightly positive note, per Markit: “Russian goods producers recorded a slight expansion in new business volumes during February. According to anecdotal evidence, a higher volume of new work reflected the development of new products. However, the rise in new orders was driven by the domestic market, as new export orders declined further. The rate of contraction accelerated to the sharpest in 19 months and was marked overall.”

On a 3mo MA basis, 3mo average through February 2016 stood at 49.3, which is lower than the 3mo average through November 2015 (49.8), but still better than the 3mo average through February 2015 (48.7).

So the key reading from this data is that Manufacturing remains in a shallow downturn for the third month in a row, signalling a poor start to 2016 and leaving no doubt that the economy is now set to post another quarter of negative growth, unless there is a major improvement in Services sector readings in February and a major gain across both sectors in March.


Monday, February 1, 2016

1/2/16: BRIC Manufacturing PMI January: A Test of Stagnation?


I covered China Manufacturing PMI in an earlier separate note here: http://trueeconomics.blogspot.com/2016/02/31116-china-manufacturing-pmi-its-at.html with core conclusion that Chinese Manufacturing PMIs have been now running second worst in the BRIC’s group since July 2015, staying above only Brazil’s - a country that is in an outright recession. PMI index came in tat 48.4 in January, marginally up on 48.2 in December 2015, marking 11th consecutive month of sub-50 readings. 3mo average through January 2016 is now at 48.4 against 3mo average through October 2015 at 47.6. Current 3mo average is down significantly on 49.8 3mo average through January 2015. Last time Chinese Manufacturing posted statistically significant expansion (as measured by PMI reading above 51.46 - the statistically significant growth marker - was back in July 2014.

India Manufacturing PMI posted a rise to 51.1 in January from 49.1 in December, with January reading being highest in 4 months. This sounds like good news, expect it is not. The reason is that at 51.1, the PMI is well below historical average of 54.5. And it is below January 2015 level of 52.9. 3mo average through January 2016 is at zero growth mark 50.0, which compered poorly to 3mo average through October 2015 at 51.4 and worse relative to 53.6 which is 3mo average through January 2015. Market release was quite upbeat on India numbers, however, noting that “the industry recovered following the contraction seen at the end of last year. Alongside a resumption of output at some firms impacted by December’s flooding, manufacturers also benefited from rising inflows of new business from domestic and export clients.” The sectoral breakdown of the index is also concerning. Again per Markit, “The consumer goods subsector remained the principal growth engine at the start of the year, seeing substantial expansions of both output and new orders. In contrast, producers of investment goods saw output and new orders fall, while production volumes stagnated in the intermediate goods category.”

Russian PMIs were covered in a stand alone post here: http://trueeconomics.blogspot.com/2016/02/1216-russian-manufacturing-pmi-january.html with core conclusion that although Russia retained its's position as the second strongest performing economy by Manufacturing PMIs in the BRIC group in January, the latest reading puts Russian Manufacturing in a stagnation zone too close to 50.0 to call it a full-blown contraction. This has meant that over the last 3 months, Russian Manufacturing PMI averaged 49.7, a reading nominally below 50.0, although an improvement on 49.1 average for 3 months through October 2015, and on 49.4 3-mo average through January 2015. In simple terms, Russian Manufacturing continued to contract in 3 months through January 2016, but the rate of contraction was virtually indistinguishable from zero growth.


This leaves us to cover Brazil Manufacturing PMI. Brazil Manufacturing index posted a rise in January, hitting an 11-mo high of 47.4. By all normal metrics, this is a disaster territory reading, consistent with rather sharp deterioration in trading conditions. But for Brazil - this was an improvement, especially as output and news orders both were contracting at slower rates in January. Per Markit: “The downturn in the Brazilian manufacturing sector continued at the start of 2016, with levels of production and new orders contracting for the twelfth successive month. This continued to filter through to decisions relating to staff hiring, stock holdings and purchasing activity, all of which also declined during the latest survey month.”  On the positive (sort of) side, “output declined at weaker rates in each of the three production categories (consumer, intermediate and investment) covered by the survey. Underlying the latest decrease in output was a further reduction in the level of incoming new orders. The latest drop in inflows of new work received was mainly centred on the domestic market, as the volume of new export business expanded for the second straight month in January.” On a 3mo average basis, 3mo average through January 2016 is at 44.5, which is worse that 3mo average through October 2015 (45.6) and 3mo average through Ja
nuary 2015 (49.9). In simple terms, Brazil remains the basket case of BRIC economies, leading the group to the downside on Manufacturing.

Chart and table below summarise the BRIC’s outlook:


So, overall, BRIC Manufacturing side of the economy is still in a woeful shape. India's return to growth is relatively weak, while contractionary conditions prevail in Brazil (strong, albeit moderating on the end of 2015), Russia (very weak contraction, closer to stagnation) and China (where PMI data has been at serious odds with official national accounts data for some time now). The net result for the global growth is not exactly encouraging.

31/1/16: China Manufacturing PMI: It's at Recession Levels, Folks


China manufacturing PMI signalled another month of deterioration in operating conditions for January 2016. Per Markit, “with both output and employment declining at slightly faster rates than in December. Total new business meanwhile fell at the weakest rate in seven months, and despite a faster decline in new export work.’

Overall, PMI index came in tat 48.4 in January, marginally up on 48.2 in December 2015, marking 11th consecutive month of sub-50 readings. 3mo average through January 2016 is now at 48.4 against 3mo average through October 2015 at 47.6. Current 3mo average is down significantly on 49.8 3mo average through January 2015. Last time Chinese Manufacturing posted statistically significant expansion (as measured by PMI reading above 51.46 - the statistically significant growth marker - was back in July 2014.

Interestingly, Markit is using very ‘diplomatic’ language in their release, saying that “Production at Chinese goods producers fell for the second successive month in January. Though modest, the rate of contraction was the fastest seen in four months. According to panellists, relatively weak market conditions and fewer new orders had led firms to cut production.” In simple terms, this means that the Manufacturing sector in Chine is not growing slower, but is contracting. Which, of course, is vastly inconsistent with official GDP growth data. Over the last 15 months, Chinese Manufacturing managed to hit PMI >50.0 on only one month. One month. How this can be consistent with an economy growing at 6.9 percent is anyone’s guess.

And Chinese companies are now appearing to be deep in revenue recession too. per Markit: “Weaker client demand led manufacturers to discount their prices charged again in January, thereby extending the current sequence of deflation to 18 months (although the rate of reduction was the slowest seen since June 2015). Lower selling prices were supported by a further fall in average input costs at the start of the year.”

In fact, Chinese Manufacturing PMIs have been now running second worst in the BRIC’s group since July 2015, staying above only Brazil’s - a country that is in an outright recession.


I mean you getting any signs of the 6.8-6.9 percent growth anywhere here? No? Well, in general, Services PMIs are also in a tanking mode, but more on this separately.

Monday, January 4, 2016

4/1/16: BRIC Manufacturing PMIs: December 2015 and 4Q 2015


BRIC Manufacturing PMIs posted another sector-wide weakening in growth conditions in December, ending 2015 on foot of an outright contraction across the sector in all BRIC economies for the first time since late 2013.

Russian manufacturing PMI posted a deterioration in sector performance in December, falling to 48.7 from 50.1 in November. This reverses two consecutive months of above 50 readings in October and November. On a quarterly basis, 4Q 2015 average reading was 49.7, which is better than 48.4 average for 3Q 2015, but still below 50.0 line. Overall December reading was the weakest since August 2015 and signals that the much anticipated stabilisation of the Russian economy did not take place in December. More detailed analysis of Russian PMIs is available here for monthly data and here for quarterly data. Overall, Russia was the third weakest PMI performer in Manufacturing sector terms within the BRIC group.

Brazil’s Manufacturing PMI remained deeply below 50.0 mark in December, although rising to 45.6 from 43.8 in November. December reading stands as the highest in 3 months, but still signals sharp rate of activity contraction. 4Q 2015 average is at 44.5, which is down on 46.7 average for 3Q 2015. Brazil has now posted Manufacturing PMI readings below 50.0 for 11 months in a row, the longest such record in the group of BRIC countries. In addition, Brazil remained the weakest performer in terms of Manufacturing PMIs in the BRIC group.

Per Markit: “Brazilian manufacturing companies reported worsening operating conditions at the end of 2015. December saw output and new orders dip at rates that, although slower, remained sharp…Amid evidence of cashflow problems, stocks of purchases and post-production inventories both decreased at rates that were the quickest in over six years. …severe downturn in the sector that was evident among the three monitored market groups: consumer, intermediate and investment goods. …December data pointed to a further decline in incoming new work, the eleventh in as many months. …Panellists indicated that a deeper economic retreat and falling purchasing power among consumers had led domestic demand to dwindle. Conversely, new orders from abroad rose. The weaker real had reportedly supported firms in securing new business from external clients. That said, the overall pace of expansion was only marginal.”

China Manufacturing PMI fell from 48.6 in November to 48.2 in October, marking 10th consecutive month of sub-50 readings and the weakest reading in 3 months. On a quarterly basis, 4Q 2015 reading was 48.4 which is somewhat better than 47.4 reading for 3Q 2015, although still signifying overall contraction in the sector. By all metrics, Chinese Manufacturing PMI came in second weakest in the BRIC grouping after Brazil.

Per Markit: “Operating conditions faced by Chinese goods producers continued to deteriorate in December. Production declined for the seventh time in the past eight months, driven in part by a further fall in total new work. Data suggested that client demand was weak both at home and abroad, with new export business falling for the first time in three months in December. As a result, manufacturers continued to trim their staff numbers and reduce their purchasing activity in line with lower production requirements. Meanwhile, deflationary pressures persisted, as highlighted by further marked declines in both input costs and selling prices.” Overall, this was the first time exports orders fell since September 2015.

India Manufacturing PMI posted a moderate drop from 50.3 in November to 49.1 in December, putting PMI reading below 50.0 line for the first time since June 2015. However, on a quarterly average basis, 4Q 2015 came in at 50.0, signalling zero growth in the sector over the last quarter of 2015, down from relatively robust growth posted in 3Q 2015 (with PMI averaging 52.1). PMI averaged 51.7 in 2Q 2015. The data confirms my previously expressed view that India is now skirting dangerously close to a manufacturing recession and that overall economic growth conditions in the economy have deteriorated significantly compared to 2014.

Per Markit: “Indian manufacturers saw business conditions deteriorate at the end of 2015. December’s incessant rainfall in Chennai impacted heavily on the sector, with falling new work leading companies to scale back output at the sharpest pace since February 2009. On the price front, inflation rates of both input costs and output charges were at seven month highs. …Consumer goods bucked the sub-sector trend and was the only category to see improving business conditions in December as production and new orders rose. Conversely, incoming new work and output fell in both the intermediate and investment goods market groups. Having risen for 25 straight months, total
manufacturing production in India fell during December. Furthermore, the rate of contraction was the sharpest in almost seven years.”

Summary table:

And a chart to illustrate


Hence, overall, as of December, 

  • Brazil manufacturing PMI continued to move along the general downward trend that started around 1Q 2013 and runs unabated since then, with Manufacturing recession setting in firmly from 2Q 2015 on. 
  • China, having displaced Russia for the second weakest position in the BRIC economies in terms of Manufacturing PMIs back in July 2015 remains the second weakest link in the BRIC group. Chinese manufacturing has been posting negative trend in PMIs since mid 2014, although in the last 3 months of 2015 this trend somewhat improved. 
  • Meanwhile, Russian Manufacturing is once again taking on water, having reverted down from a positive sub-trend that was present over May-November 2015.
  • Last, but not least, the bright star of India is now fading in terms of Manufacturing PMIs, with both trend (downward since December 2014 and more pronounced downward trend since July 2015) and absolute level of PMI reading signalling a risk of manufacturing sector recession in India. 

Overall, we now have all BRIC Manufacturing PMIs below 50 line for the first time since March 2009. This strongly shows overall continued downward pressures on growth in world’s largest emerging markets.

Thursday, October 1, 2015

1/10/15: China PMIs: Signalling Deeper Problems Ahead


Latest Manufacturing and Services PMI data for China posted a strong signal of continued deterioration in the economy.

Manufacturing PMI came in at the lowest levels since March 2009, posting 47.2 in September, compared to 47.3 in August, and marking 7th consecutive month of sub-50 readings. Over the last 12 months, Manufacturing PMI reached above 50.0 in just two months, hit exactly 50.0 in one (marking zero growth in the sector) and was below 50 (marking contraction of activity) in the rest. Last time Manufacturing PMI was statistically above 50.0 was in July 2014 and last time it happened before then was in October-November 2013. In other words, there has not been statistically significant growth singled by Manufacturing PMIs for some two years now.

Per Markit release, things were even worse than the headline Manufacturing index suggested:

  • “Total new work fell at the quickest rate in over three years, partly driven by a steeper fall in new export business. 
  • “As a result, companies cut output at the sharpest rate in six-and-a-half years, while staff numbers fell at the quickest pace since the start of 2009. 
  • “The health of the sector has now deteriorated in each of the past seven months. Furthermore, the latest deterioration was the most marked since March 2009.”


On Services side, Markit’s Services PMI for September came in at 50.5, the lowest reading since July 2014. Services PMI for China has never posted a sub-50 reading in the series history, so there is little we can tell about actual levels of activity in the sector based on this data. Still, 50.5 reading is so bad, it ranks as the second lowest reading in the history of the series.

Which brings us to the Composite PMI. China’s Composite PMI posted another sub-50 reading, falling from August 48.8 to September 48.0. This implies the fastest rate of contraction across the economy since January 2009.

Per Markit:

  • “Employment trends continued to diverge across the manufacturing and services sectors in September. Manufacturers cut their workforce numbers at a solid pace that was similar to that seen in the prior month, while service providers continued to increase their payroll numbers. However, the rate of job creation was only slight, despite improving upon August’s fractional pace. Consequently, employment at the composite level declined for the fourth successive month.
  • “Manufacturing companies signalled a further increase in outstanding workloads in September, which was often linked to reduced productive capacity. Meanwhile, softer growth in new work enabled service sector firms to work through their unfinished business in September and at the fastest rate in ten months. Overall, backlogs of work declined again at the composite level, albeit at a marginal rate.”


In simple terms, whatever growth was squeezed out of both sectors, that growth came from depleting outstanding orders, rather than signing new business.

Two charts to highlight these trends: