Friday, May 25, 2012

25/5/2012: Mortgages in Arrears: Q1 2012

Latest mortgages arrears data from the CB of Ireland came in with a slight surprise that most of the media should have anticipated. During the launch of the annual report, the CBofI has pre-leaked some of the top-level figures for arrears, with media reports of 10.5% (or ca 80,000) of mortgages in arrears expected in Q1 2012 figures. Of course, given the usual tactic of first exaggerating, then underwhelming (presumably there's some psychological strategy working its magic somewhere here), it should have been expected that actual numbers - bad as they may be otherwise - will 'surprise' to the positive side relative to the leak-related expectations. It might have worked.

Alas, the end numbers - whether or not they are better than leaked out 'estimates' - are pretty dismal.

In Q1 2012, there were 764,138 mortgages outstanding amounting to €112,688.5 million. The latter number is €789 million down on Q4 2011 and€3.27 billion lower than Q1 2011 figure. So in 12 months, with foreclosures and restructuring factored in, Irish mortgagees were able to pay down just 2.82% of the mortgages outstanding. This is not exactly a massive rate of de-leveraging for heavily indebted households.

Of these, 77,630 mortgages were in arrears over 90 days (up 9.4% qoq and 56.5% yoy), with total outstanding amounts of €15,386 million (up 10% qoq and 60.3% yoy). Previous quarter-on-quarter increases were, respectively, 12.7% and 13.1%.

Repossessions in Q1 2012 stood at 961 up from 896 in Q4 2011.

Restructured mortgages:

  • At the end of Q1 2012, there were 38,658 mortgages restructured, but not in arreas, up 5.06% qoq (against previous qoq rise of 1.16%) and up 5.44% yoy.
  • In addition, there were 41.054 restructured mortgages that were in arrears, up 9.23% qoq against previous quarterly rise of 12.67%, and up 56.25% yoy.
Overall, defining at risk or defaulted mortgages as those mortgages that are currently in arrears (including restructured and in arrears), plus restructured but not in arrears mortgages and repossessions:
  • At the end of Q1 2012 there were 117,249 at risk or defaulted mortgages, constituting 15.34% of all mortgages outstanding and amounting to €21.72 billion, or 19.27% of total volume of mortgages outstanding.
  • Number of mortgages at risk or defaulted has increased 7.93% qoq in Q1 2012 as compared to a rise of 8.39% qoq in Q4 2011. Annual rise in Q1 2012 was 34.83%.
  • Volume of mortgages at risk or defaulted has increased 8.09% qoq in Q1 2012 as compared to a rise of 9.8% qoq in Q4 2011, and there was an annual increase of 37.67%.
  • In Q4 2011, mortgages that are at risk or defaulted constituted 14.13% of the total number of mortgages, while in Q1 2011 the proportion was 11.11%, and this rose to 15.34% in Q1 2012.
CHARTS:


Note: more on this next week.

Monday, May 21, 2012

21/5/2012: Quick note on US Markets' Crash Indices

The risk-off thingy is starting to bite - with a few frantic calls over the weekend from across the Atlantic. People are shifting strategies like feet in Swan Lake's pas de deux. Here's an nice set of charts that shows we are in a precarious starting point to the risk-off market indeed.

The Yale University Crash Index - latest data takes us only through April, shows that the base off which we have entered May markets is already loaded with high risk:


April 2012 Institutional Index came in at 26.94 reading, which compares unfavorably to historical average of 36.86 and to crisis period average of 31.27. Jittery markets mean that 2011-present average is 29.88 - worse than crisis period average and that April 2012 was even worse than that. Meanwhile, individual investors index showed usual lags, with lower pessimism in April at 28.47, which is a better reading than 26.57 for crisis period average and better than 24.76 for 2011-present average. Still, individual investors are more risk conscious than historical average of 33.70.

One interesting bit - disregarding the issue of lags, historical correlation between two indices is 0.76 while crisis period correlation is 0.82, which suggests that May reading should come down like a hammer for individual investors. The same is confirmed by looking at changes in indices volatility. Standard errors for Institutional investors responses have compressed from historical 3.82 average to crisis period 2.99 average to 2.85 average for the period since January 2011. Similarly, for individual investors, historical average standard error is 3.36, declining to 2.731 for crisis period and 2.724 average since January 2011.

Note that per charts above, since the beginning of the crisis in mid-2007 (data shows clear break in data at June 2007), Individual investors index has been flat trending (volatile along trend), while Institutional investors index has been trending down (with loads of volatility, too).

21/05/2012: Sunday Times 20/5/2012: Euro area crisis - no growth in sight


Here's my Sunday Times article from May 20, 2012. Unedited version, as usual.


Welcome to the terminal stage of the Euro crisis. Only two years ago European press and politicians were consumed with the terrifying prospects of a two-speed Europe. This week, preliminary estimates of the Euro area GDP growth for the first quarter of 2012 have confirmed that the common currency area, instead of bifurcating, has trifurcated into three distinct zones.

In the red corner, we have the pack of the perennially struggling economies of Cyprus, Greece, Italy, Portugal and Spain. The Netherlands, with annual output contraction of -1.3% in Q1 2012, matching that of Italy, has quietly joined their ranks. These countries all have posted negative growth over the last six months if not longer. Cyprus, Italy, and Portugal, alongside the Netherlands, registering negative growth over the last three quarters. Ireland and Malta, two other candidates for this group are yet to report their Q1 2012 results, with the former now officially in a recession since the end of 2011, while the latter having posted its first quarter of negative growth in Q4 2011.

In the blue corner, Belgium, France, and Austria all have narrowly missed declaring a recession in the last quarter, while posting 0.5% annual growth or less.

Lastly, in the green corner, Estonia, Finland, Germany and Slovakia have served as the powerhouse of the common currency area, pushing the quarterly growth envelope by between 0.5% and 1.3%.

The red corner accounts for 40% of euro area entire GDP, the blue corner – for 29%. All in, less than one third of the euro area economy is currently managing to stay above the waterline.

Looking at the picture from a slightly different prospective, out of the Euro 4 largest economies, France has shown not a single quarter of growth in excess of 0.3% since January 2011. In the latest quarter it posted zero growth. Germany – the darling of Europe’s growth strategists – has managed to deliver 0.5% quarterly growth in Q1 2012 on foot of 0.2% contraction in Q4 2011. Annual growth rates came at an even more disappointing 1.2% in Q1 2012, down from 2.0% in Q4 2011. Italy decline accelerated from -0.7% in Q4 2011 to -0.8% in Q1 2012, while Spain has officially re-entered recession with 0.3% contraction in Q4 2011 and Q1 2012.

The Big 4 account for 77% of euro area total economic output. Not surprisingly, overall EA17 growth was zero in Q1 2012 both in quarterly terms and annual terms. The latest leading indicator for euro area growth, Eurocoin, reading for April 2012 shows slight amplification of the downward trend from March. In other words, things are not getting better.

The best countries in terms of overall hope of economic recoveries – net exports generators, such as Austria, Belgium, Ireland, and the Netherlands, are all stuck in either the twilight zone of zero growth or in a years-long recession hell.

Ireland’s exporting sectors have been booming, with total exports rising from the recession period trough of €145.9 billion in 2009 to €165.3 billion in 2011. However, the rate of growth in our exports has been slowing down much faster than projected for 2012. If in 2010 year on year total exports expanded 8.1% in current prices terms, in 2011 the rate of growth was 4.8%. Our overall trade surplus for both goods and services grew 12.8% in 2011 – impressive figure, but down on 19.7% in 2010.

So far this year, the slowdown continues.

The latest PMI data suggests that manufacturing activity is likely to have been flat in Q1 2012. Latest goods exports data, released this week, shows that the sector posted zero growth confirming overall readings from the PMI. The value of trade in goods surplus steadily declined since January 2012 peak of €3,813 million to €3,023 million in March 2012, and in annual terms, Q1 2012 surplus for merchandise trade is now down €99 million on 2011. Although the quarter-on-quarter reduction appears to be small due to relatively shallow trade surplus recorded in January 2011, March seasonally-adjusted trade surplus is down 22% or €850 million on March 2011. With patents expiring, the latest data shows that exports of Medical and pharmaceutical products fell €772 million in Q1 2012 compared to Q1 2011. Overall, comparing first quarter results, 2011 registered seasonally-adjusted annual growth of 7.9% in exports and 15.2% in trade surplus. 2012 Q1 results are virtually flat, with exports rising 0.03% and trade surplus rising 0.8%.

Looking at the geographical composition of our merchandise trade, until recently, our exports and trade surplus were strongly underwritten by re-exportation by the US multi-nationals into North America of goods produced here. This too has changed in Q1 2012, despite the fact that the US has managed to stay outside the economic mess sweeping across Europe. In three months through March 2012, Irish exports to the US have fallen 19.3% and our trade surplus with the US has shrunk 47.1% from €3.33 billion to €1.76 billion.

Services are more elusive and more volatile, with CSO reporting lagging the data releases for goods trade, but so far, indications are that services activity remained on a very shallow growth trend through Q1 2012. As in Manufacturing, Services demand has been driven once again by more robust exports, and as for Manufacturing, this fact exposes us to the potential downside risk both from the on-going euro area crisis and from the clear indication that our domestic economy continues to shrink even after an already massive four years-long depression.

No matter how we spin the data, the reality is that exports generation in Europe overall, and in Ireland in particular, is still largely a matter of trade flows between the slower growth North American and European regions.

In many ways than one, Ireland is a real canary in the mine, because of all Euro area economies excluding the Accession states, Ireland should be in the strongest position to recover and because our exporting sectors continue to perform much better than the European average. Yet the recovery is nowhere to be seen.

Instead, the growth risks manifested in significant slowdown in our external trade activity and in overall manufacturing and services sectors are now coinciding with the euro entering the terminal stage of the crisis.

Since the beginning of this week, Belgian and Cypriot, Austrian and Dutch, virtually all euro area bonds have been taking some beating. In the mean time, credit downgrades came down on Italy and Spain, and the Spanish banking system was exposed, at last, as the very anchor that is likely to drag Europe’s fifth largest economy into EFSF/ESM rescue mechanism. This week, in a regulatory filing, Spain’s second largest bank, BBVA stated that: “The connection between EU sovereign concerns and concerns for the health of the European financial system has intensified, and financial tensions in Europe have reached levels, in many respects, higher than those present after the collapse of Lehman Brothers in October 2008.” Meanwhile, Greek retail banks have lost some 17% of their customers’ deposits since mid-2011 and this week alone have seen the bank runs accelerating from €700 million per day on Monday-Tuesday, to over €1.2 billion on Wednesday.

This is not a new crisis, but the logical outcome of Europe’s proven track record of inability to deal with the smaller sub-component of the balance sheet recession – the Greek debt overhang. Three years into the crisis, European leadership has no meaningful roadmap for either federalization of the debts or for a full fiscal harmonization. There is no growth programme and the likelihood of a credible one emerging any time soon is extremely low. Structural reforms are nowhere to be seen and productivity growth as well as competitiveness gains remain very shallow, despite painful adjustments in private sector employment and wages. Inflation is running well above the targets. Austerity is nothing more than a series of pronouncements that European leaders have absolutely no determination to follow through. EU own budget is rising next year by seven percentage points, while Government expenditure across the EU states is set to increase, not decrease.

In short, three years of wasteful meetings, summits, and compacts have resulted in a rather predictable and extremely unpleasant outcome: aside from the ECB’s long term refinancing operations injecting €1 trillion of funds into the common currency’s failing banking system, Europe has failed to produce a single meaningful response to the crisis.

CHARTS:


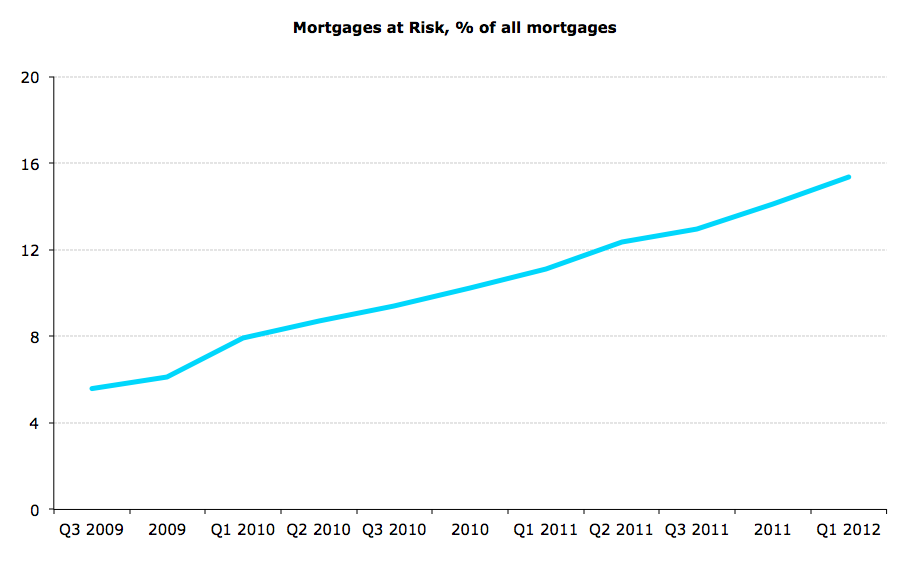
Box-out:  Speaking at this week’s conference of the Irish economy organized by Bloomberg, Department of Finance Michael Torpey has made it clear that whilst one in ten mortgagees in the country are now failing to cover the full cost of their loans, strategic defaults amount to a negligible percentage of those who declare difficulty in repayments. This statement contradicts the Central Bank of Ireland and the Minister for Finance claims that the risk of strategic defaults is significant and warrants shallow, rather than deep, reforms of the personal bankruptcy code. Furthermore, the actual levels of mortgages that are currently under stress is not 10% as frequently claimed, but a much higher 14.1% - the proportion corresponding to 108,603 mortgages that have either been in arrears of 30 days and longer, or were restructured in recent years and are currently not in arrears due to a temporary reduction in overall burden of repayments, but are at significant risk of lapsing into arrears once again. The data, covering the period through December 2011 is likely to be revised upward once first quarter 2012 numbers are published in the next few weeks. In brief, both the mortgages arrears dynamics and the rise of the overall expected losses in the Irish banking system to exceed the base-line risk projections under the Government stress tests of 2011 suggest that the state must move aggressively to resolve mortgages crisis before it spins out of control.

21/5/2012: Gold Demand: Q1 2012

Q1 2012 global gold demand figures were published last week and, surprise, surprise, there has been some decline in investment components of demand. Predictably. What is surprising, however, are the dynamics. For some time now we've been hearing about the gold bubble and about recent price moderations being the sign of the proverbial 'hard landing'. Sorry to disappoint you, not yet.

Let's chart some data and discuss:

  • Jewellery demand increased from 476 tons in Q4 2011 to 520 tons in Q1 2012 - a rise of 9.24% q/q, but a drop of 6.3% y/y. This contrasts price movements (see below). More significantly, peak Q1 jewellery demand was in Q1 2007 and Q1 2012 demand is only 8.1% below the peak level. Not the fall-off you'd expect were jewellery buyers exercising their option to stay away from higher priced gold.
  • Technology-related demand came in at 108 tons in Q1 2012, up on 104 tons in Q4 2011 (+3.8%), but down 6.1% y/y/ Peak Q1 demand for technology gold was in Q1 2008 and Q1 2012 demand came in 11.5% below that. Again, no serious drama here - some substitution away from higher priced gold, but also much of the effect due to global slowdown in production of white goods and electronics, plus price moderation in substitutes on the back of a global economic slowdown and crises.
  • Bar & Coin Investors' demand (more longer-term physical investment demand) was down from 356 tons in Q4 2011 to 338 tons in Q1 2012, a fall off of 5.06% q/q and 16.75% y/y - virtually in line with price movements, but in the opposite direction. Substitution and other factors (see below) suspected. Incidentally, Q1 2011 was also the peak quarter in total demand for Bar & Coin investors.
  • ETFs - more volatile demand source - reduced their demand for gold to 51 tons in Q1 2012, down from 95 tons in Q4 2011. These funds tend to have exceptionally volatile net demand, including negative readings in some quarters.

Here's a handy table comparing demand levels by investment/use type as follows:
  1. First I compute Q1 average demand for 2006-2011
  2. Second I report by how many tons Q1 2012 demand was different from the above average:
Source: Author calculations based on Gold Council data (same for charts below)

Conclusion out of the table: no drama. As expected - physical demand is still ahead of average, but moderating gradually. Jewellery demand is above average - a massive surprise for those who use this demand component to argue that decline in jewellery demand shows that gold is a bubble driven solely by investment objectives. Within investment gold: ETFs are becoming less relevant (more speculative component) while gold bars and coins (less speculative, more 'long-hold' component, especially on coins side) becoming more important.

To show decline in Jewellery and Technology (non-investment) gold relative role, here's a chart:


In Q1 2012, non-investment gold demand accounted for 61.8% of all demand (excluding Central Banks) - Q1 2006-2011 average share is 67.3%, which is above the current share. However, the current share is the highest since Q1 2011.

Now, end-of-quarter prices in USD: Q1 2012 ended with gold priced at USD1,662.5/oz - the highest quarter-end price on record and up 8.6% on Q4 2011 and 15.53% on Q1 2011.

Next two charts plot relationship between price and volume demanded by specific category:


Notice the following:
  1. There is a strong positive relationship between gold price and demand by gold bar & coin investors. Perverse? Not if you know that gold is an inflation / USD hedge.
  2. Basically zero relationship to ETFs demand. Surprising? Not really - these are actively managed and not exactly risk-hedging entities (see below).
  3. Weak negative relationship for physical non-investment demand (jewellery & technology) - suggesting some substitution effect, but not much of one. Which, in turn, implies that there is some other driver here - perhaps shorter term changes in demand for goods produced using gold and longer term technological change (think dental demand - when was the last time you fitted a gold tooth?)
  4. Weak positive relationship between price and overall demand for gold. Funny thing is - if there's a bubble, you'd expect a much stronger relationship, don't you? After all, there would be hype of rapidly rising demand as prices rise? 
So what is happening on the demand side of gold markets, then? Here are my views:
  1. Dollar strengthening and oil price moderation are both signaling that gold price moderation should be impacting USD price more than other currencies-denominated prices. This is true, when you compare changes in USD price and Euro price;
  2. ETFs are clearly suggesting a signal that some of the gold demand (primarily speculative component) is being drawn down during the 'risk-off' periods, like the one we are currently going through. Speculative demand is moderating significantly, which is good medium-term;
  3. Tax changes on gold bullion in India had significant impact, including on jewellery-related gold demand from there;
  4. Central banks demand pushes price-demand relationship out toward flatter slope and reduces price-elasticity of global demand.


Disclaimer:
1) I am a non-executive member of the GoldCore Investment Committee.
2) I am a Director and Head of Research with St.Columbanus AG, where we do not invest in any individual commodity.
3) I am long gold in fixed amount over at least the last 5 years with my allocation being extremely modest. I hold no assets linked to gold mining or processing companies.
4) I have done and am continuing doing academic work on gold as an asset class, but also on other asset classes. You can see my research on my ssrn page the link to which is provided on this blog's front page.
5) I receive no compensation for research appearing on this blog. Everything your read here is my own personal opinion and not the opinion of any of my employers, current, past or future.
6) None of my research - including that on gold - should be considered as an investment advice or an advise to buy or invest in any asset or asset class.

Saturday, May 19, 2012

19/5/2012: Eurozone crisis: Globe & Mail and Wall Street Journal

My article on the latest re-iteration of the Euro crisis with Canada's Globe & Mail is here.

And a comment on related topic with Wall Street Journal here.

Monday, May 14, 2012

14/5/2012: Irish Construction Sector PMIs for April 2012

The Irish Construction PMI published by the Ulster Bank posted another massive fall, declining to 45.4 in April, from 46.7 in March. This is the sharpest rate of decline in the sector since October 2011. 


Breakdown by sub-sector:
Which means that
  1. Housing sector activity is now sharper than overall activity, for the first time in seven months and is sharpest since September 2011
  1. Commercial sector activity is on shallower decrease path in April than in March, but nonetheless, there is no improvement, despite the claims by our development agencies and reports by some real estate houses that MNCs are literally falling over each other trying to build massive new facilities. 

14/5/2012: Russian Banks Credit Supply to SMEs


Moody's latest note on Russian banks, titled SME Lending in Russia: Growth Supports Profitability, but Cyclical Credit Risks Remain is available in Russian.

The note argues that since 2010-2011, Russian banks' origination of credit to SMEs has grown on the back of banks' strategic expansion within the SME sector that sees growth in lending to SMEs exceeding that for larger corporates.

"Overall, we believe that the banks' expansion of their SME portfolios and their plans to further this expansion are credit positive. The SME sector supports the banks' net interest margins, provides cross-selling opportunities and contributes to further diversification of banks' risks," explains Olga Ulyanova, a Moody's Vice President and author of the report. "However, if the economic cycle enters another phase of downturn, SME loans are likely to be the segment most vulnerable to weakened conditions, and credit losses might reach levels seen during 2008-09," adds Ms. Ulyanova. Doh, as Homer would say. See this note and this to check the likelihood of the Russian economy contracting...

On a serious note, of importance to anyone trading in Russian markets: Moody's said that relative to other asset classes, SME lending poses greater risks to banks credit profiles, due to:

  1. Weak corporate governance and financial reporting practices of many SMEs; 
  2. Their concentration and dependence on a small number of large customers and/or suppliers; 
  3. Fewer refinancing options available to SMEs as opposed to large corporates; 
  4. SMEs' elevated exposure to domestic currency fluctuations; 
  5. Poor track record of SME loan recoveries, partly because of the low realisable value of collateral; 
  6. Weak court and legal systems for settling debt; and
  7. Weak enforcement mechanisms for court judgements.
I would agree with the above risks assessment. However, interestingly, Moody's reported that credit losses generated by SME loans originated after 2008-2009 crisis are currently running below those for pre-crisis vintages, "reflecting post-crisis economic stabilisation in Russia and the somewhat tightened credit underwriting procedures that the banks implemented".

Moody's identify key trends in Russian SME lending over the next 12-18 months:

  • The total volume of bank loans to SMEs will exceed 10% of the country's GDP (compared with 9.3% at year-end 2011). 
  • By 2015, SME lending will likely stabilise at around 15% of GDP, a level comparable with that of peer countries. 
  • Net interest margins improvement is the core objective for banks diversification of lending to SMEs.
  • Credit losses on loans issued in 2011-2012 to be contained within overall lower losses trend since 2010.

14/5/2012: De List of Mr Enda

In the world of totally planted and utterly absurd stories, this one takes at least an honorable mention prize. Now, just think - a secret meeting in the back of the pub. A 'source' - a 'Government source' - confiding to the author about the 'list' of 'special projects' to milk the EU subsidies into the sunset. You have to laugh... or cry... 

14/5/2012: Euro area austerity - a chart


Austerity in Europe? Ok, table below shows General Government expenditure as % of nominal GDP in 2011-2012 compared to 2000-2007 average.


Chart below shows nominal values of General Government expenditure, in billions of euros.


Chart above clearly shows that during the entire crisis, euro area General Government Expenditure dipped  only once - in 2011 compared to 2010. The 'savage' cut was €13.02bn for EA12 combined, or 0.14% of 2011 GDP. Continuing with 'savage austerity', 2012 is forecast by the IMF to post General Government Expenditure increase of €43 billion for EA12 and €43.9 billion for EA17. By the end of 2012, under 'severe austerity', euro area Governments will be spending €30 billion more than in 2010.

Things get even worse under the 'savage cuts' of 2013. In 2013, EA12 governments will be spending €66.2 billion more than in 2012 and €96.2 billion more than in 2010.

Oh, yes, and the trend continues into 2017 projections by the IMF.

In family analogy, 'Darling, with one of our jobs lost, try not to buy a fancier Gucci bag, next time you go out for groceries!' 

15/5/2012: Austerity, Stimulus & Euro Area Crisis

An excellent article for Bloomberg by Peter Boone and Simon Johnson, titled As European Austerity Ends, So Could the Euro.


Note the referencing of 90% debt/GDP ratio for the euro area. In 2012, per IMF more detailed WEO database, General Government Gross Debt in EA17 will rise to 89.95% of GDP from 88.08% in 2011. For EA12 (old euro area member states), the GGD will rise from 88.75% of GDP in 2011 to 90.61% of GDP in 2012, while removing Luxembourg out of EA12 (the country is a massive outlier for virtually all GDP-related parameters due to its huge 'brass plate' sector), implies EA11 debt to GDP ratio of 90.915% of GDP in 2012, up from 89.06% in 2011.


In addition to Table 5 in the GFSR (linked by Boone and Johnson), I suggest you take a look at the Statistical Table 9.a on page 69 of the report, especially columns 2-5. These detail parameters of sustainability of unfunded future health and pensions obligations.  Ireland, with its 'demographic dividends' is fourth worst-off country in the EA17 in terms of future pensions liabilities increases, although we are much better than average in terms of health liabilities.


Table 10.a page 71 of the said report (reproduced below) shows that Ireland is facing the worst 
Required Adjustment and age-related spending, 2011–30 and 2011-2020 horizon in the advanced economies, save for Japan and the US.


Sunday, May 13, 2012

13/5/2012: Russian Economy forecasts H2 2012

Quick set of slides on Russian Economy forecasts for 2012:


13/5/2012: Russian economy - Inflation & Monetary Policy


Russia’s central bank (CBR) refinance rate was affirmed at 8.00% last week, with the overnight deposit rate at 4%, the minimum auction repo rate at 5.25% and the fixed repo rate at 6.25%. Per Danske Markets, “the CBR stated that it views rates as being acceptable for the coming months as inflation pressures arise in H2 12.”

The following analysis is based on Danske Markets forecasts and my own outlook. IMF latest projections are tabulated below.


Inflationary pressures remain at the core of the CBR concerns as economy is running on-track to hit 4.0-4.3 percent real growth (close but below 4.3% in 2011 and 2010 amidst more adverse global growth conditions in 2012). Core growth drivers are: Private Consumption (expected +4.9-5% yoy), Investment (+8.0-9.0% yoy and run close to 23.6% of GDP, slightly less than 20.7 and 23.2 in 2010 and 2011). Investment grew 6.0% and 5.5% in 2010 and 2011, so 2012 expectation is for acceleration. Exports growth (+7.5-8% yoy) is expected to fall short of imports growth (16.0-16.5%). Exports grew at 10.5 and 21.8 percent annually in 2010 and 2011, while imports expanded 22.1 and 25.4 percent, respectively. With trade surplus expanding at 7.0-7.3% against 8.6% growth in 2011. Current account surplus grew 4.7% in 2010, 5.5% in 2011 and is expected to slow down to 4.8% in 2012.

Unemployment is expected to remain intact of decline at 6.0-6.6% in 2012, close to 6.5% observed in 2011.

These dynamics suggest inflationary pressures not abating in 2012 on demand drivers, even absent robust employment growth, implying lack of easing momentum for CBR. Inflation is expected to come in at 6.3-6.7% in 2012, up on 6.1% in 2011 and down on 6.9% in 2010. On year-end CPI basis, expected inflation for 2012 is around 6.2% according to the IMF and average price increases on CPI basis should be around 4.8%. Furthermore, 2013 Russian economy is expected to experience structural de-acceleration in GDP growth to below 4% with 3.5% projected in real terms, with IMF forecast for 2012 real growth of 4.01% down from 4.3% in 2010 and 2011.

Additional factors strengthening inflationary expectations are delayed introductions of tariffs increases and fuel prices liberalization (revision up).

Meanwhile, owing to tighter monetary policy, consumer prices have posted another record low inflation in April (3.6% yoy) after similar post-Soviet period record of 3.7% yoy in March 2012.