Showing posts with label Irish services. Show all posts

Thursday, September 5, 2013

5/9/2013: A Cautionary Note on Irish Services PMIs

having just written about the Irish Services PMI performance in August, here's an update on the link between PMI and actual Services Activity Index, published by the CSO (one month lag).

The latest data from CSO on Services Index will be analysed in the subsequent post, but for now a health warning reminder: Services PMI has barely any bearing on the actual Services activities in Irish economy:

Basically, correlation - from January 2009 through July 2013 - between the Services PMI and CSO Services Activity Index is exceptionally poor: it stands at just 0.1367. Services PMI readings have no explanatory power when it comes to tracking performance of the Services Activity Index. On log-changes chart, PMI is capable of capturing just 0.0071% of variation in Services Activity Index. On straight levels even less. Lags are not yielding any meaningful improvements in explanatory power, neither do non-linear models.

In my view, this testifies to the extreme skews in PMI survey data to reflect the role of MNCs in ICT and IFSC sectors here.

Thursday, July 4, 2013

4/7/2013: Irish Services Sector Activity Index: May 2013

Irish Services Index for May was out today, so here are the updated trends.

Wholesale Trade activity rose from 114.7 to 116.7 between April and May 2013, with index up 1.74% m/m having posted a 7.9% rise m/m in April. 3mo average through May 2013 is down on 3mo average through May 2012 by some 7.45% and 6mo average through May 2013 is down 6.47% y/y. Thus, two last months' readings are encouraging, but not yet enough to reverse overall slower activity recorded y/y.

Wholesale and Retail Trade and Repair of Motor Vehicles etc sector activities also improved m/m in May 2013, rising 1.22% after posting a 3.61% rise m/m in April. 3mo average through May 2013 is down 5.27% y/y and 6mo average through May 2013 is down 4.22% y/y. Relative to historical max (history here references period from January 2009), the index is still down 4.27%

Transport and Storage sector is up 1.49% m/m in May 2013 having posted a 1.06% increase in April 2013. 3mo average through May 2013 is up 5.79% y/y and 6mo average is up 6.62% y/y. Relative to historical max, the index is down 5.84%.


Accommodation and Food services activity dipped 0.58% m/m in May, having recorded a 3.38% drop in April. 3mo average through May is still up 1.40% y/y and 6mo average is up 1.72% y/y. The sector is down 17.78% on peak for the period from January 2009.

Administrative & Support services activity rose 0.68% m/m in May, having recorded a 2.42% rise in April. 3mo average through May is still up 20.67% y/y and 6mo average is up 18.06% y/y. The sector is currently at a peak for the period from January 2009.


Information & Communication services activity dipped 3.23% m/m in May, having recorded a 2.11% drop in April. 3mo average through May is still up 10.31% y/y and 6mo average is up 7.72% y/y. The sector is down 5.28% on peak for the period from January 2009.

Professional, Scientific and Technical services activity dropped 4.40% m/m in May, having recorded a 0.11% decline in April. 3mo average through May is down 3.72% y/y and 6mo average is down 4.34% y/y. The sector is down 35.0% on peak for the period from January 2009.


Overall services sector activity declined 0.74% m/m in May, having recorded a 1.21% expansion in April. 3mo average through April 2013 was up 1.83% y/y and this improved to 2.31% growth for 3mo average through May 2013. 6mo average through May 2013 was up 1.72% y/y. Relative to peak, overall services activity is down 1.64%.


Friday, June 28, 2013

28/6/2013: Exports-led recovery: Q1 2013

I covered the headline numbers and trends for the GDP and GNP in previous two posts: here and here. Now, onto some more detailed analysis.

Remember, from the very beginning of the crisis, Irish and Troika leaders have been incessantly talking about the 'exports-led recovery'. Position on this blog concerning this thesis consistently remained that:

  1. Exports growth is great, but
  2. Exports growth is unlikely to be sufficient to lift the entire economy, and
  3. Exports growth projections were unrealistic, while
  4. Exports re-orientation toward services, away from goods was less conducive to delivering real growth in the economy.
Q1 2013 data continues to confirm my analysis.

In Q1 2013, based on real valuations (expressed in constant market prices),
  • Exports of Goods & Services shrunk 6.47% q/q and fell 4.09% y/y. This compares to +1.19% q/q growth in Q4 2012 and +1.28% expansion y/y. Compared to Q1 2011, when the current coalition took over the reigns in the Leinster House, total exports of goods and services are down 0.88% in real, inflation-adjusted terms. Troika sustainability projections envisioned growth of over 6% over the same period of time.
  • Imports of Goods and Services showed pretty much the same dynamics as exports in both Q4 2012 and Q1 2013, but owing to sharper contractions in 2011-2012 these are now down 4.34% compared to Q1 2011.
  • Exports of Goods fell in Q1 2013 by 3.83% q/q and 9.37% y/y, while there were declines of 2.68% q/q and 2.33% y/y in Q4 2012.
  • Exports of Services were down 8.75% q/q but up 1.27% y/y in Q1 2013, and these were up 4.77% q/q and 4.63% y/y in Q4 2012.


  • Trade Balance in Goods and Services fell 4.96% q/q and was down 3.63% y/y in Q1 2013, with Q4 2012 respective changes at -15.91% q/q and +0.98% y/y. Compared to Q1 2011, trade balance is up 15.91%
  • Trade Balance in Goods was down 6.63% q/q in Q4 2012 and this deteriorated to -10.73% growth in Q1 2013. Y/y, trade balance in goods contracted 0.05% in Q4 2012 and shrunk 10.59% in Q1 2013. On Q1 2011, trade balance in goods is down 14.04%.
  • Trade Balance in Services fell from EUR1,130mln in Q3 2012 to EUR132mln in Q4 2012 before improving to EUR601mln in Q1 2013. In Q1 2012 the balance stood at EUR28 million.


28/6/2013: Underlying dynamics in Irish GDP & GNP: Q1 2013

Q1 2013 National Accounts do not make for a pleasant reading. The implications from the business cycle perspective are pretty clear - we are in a continued (3rd quarter in a row) recession, which constitutes the fourth 'dip' since the onset of the Great Recession. The post summarising that evidence is linked here.

In this post, let's take a look at the GDP and GNP in constant prices.

On seasonally-adjusted basis (removing seasonal volatility),

  • GDP at constant factor cost (national output ex-taxes and subsidies) fell 0.65% q/q in Q1 2013, having contracted 0.12% q/q in previous quarter. On an annual basis, the GDP at factor cost declined 1.32% in Q1 2013, accelerating annual rate of decline relative to Q4 2012 when it fell 1.04%.
  • Compared to Q1 2011, when the current Government came to power, GDP at factor cost was 0.72% higher in Q1 2013.
  • Taxes rose 1.04% q/q in Q1 2013, after having posted a decline of 0.64% in Q4 2012. On an annual basis, taxes were down 0.79% in Q4 2012, but they rose 2.32% in Q1 2013.
  • Compared to Q1 2011, taxes were up 1.16% in Q1 2013.
  • To summarise the above, austerity is clearly biting. Taxes are rising at a 60% faster rate than economic activity.
  • Subsidies remained relatively constant in Q1 2013 on an annual basis, implying that net taxes rose strongly.
  • GDP at constant prices (accounting for taxes net of subsidies - the headline metric usually referenced as GDP) fell 0.58% q/q in Q1 2013, which follows a shallower contraction of 0.18% recorded in Q4 2012. On an annual basis, GDP contracted by 1.03% in Q1 2013, following a 1.02% contraction in Q4 2012.
  • Net factor income for the Rest of World (outflows to the rest of the world from factor payments, net of inflows of Irish incomes earned abroad) fell dramatically in Q1 2013, down 16.96% q/q, following a 3.22% decline q/q in Q4 2012. In year-on-year terms, net outflows fell 16.55% in Q4 2012 and by 27.58% in Q1 2013. 
  • It is impossible to tell from QNA the core drivers of the net outflows, however, from the balance of payments data we have reinvested earnings in Q1 2013 by the foreign companies in Ireland at EUR4,753 million, up on EUR4,010 million in Q4 2012 and down on EUR6,768 million in Q1 2012. The gap of Repatriations of earnings from Ireland are not provided for Q1 2013.
  • On foot of significantly reduced outflow of funds abroad, GNP at constant market prices rose in Q1 2013 rose 2.85% q/q and 5.46% y/y, beating growth of 0.51% q/q and 3.01% y/y recorded in Q4 2012. 
  • However, as analysis in the subsequent posts will show, this growth is entirely dependent on reduced outflows of funds abroad. Q/q, net expatriation of funds slowed down by EUR1,204 million, while earnings outflows abroad shrunk by EUR2,015 million.
  • Taking the average net factor payments abroad for Q1 2010-2012 in place of Q1 2013 figure, GNP growth controlling for net factor payments changes would have been around -0.01% y/y and -2.48% q/q.
Charts below summarise seasonally unadjusted series:


The chart below clearly shows that even in y/y terms, we are now in a solid, three-quarters long (so far_ recession.

The GDP/GNP gap has, predictably - given the shrinking of net factor payments abroad - declined from 25-26 percent (seasonally-adjusted and unadjusted) in Q1 2012 to 17.3-17.5 percent in Q1 2013:


It is worth noting in the chart above a significant increase in volatility in the gap, which is reflective of the greater volatility in Ireland's GDP and GNP series as well as destabilisation in growth correlation between GDP and GNP. This new pattern is most pronounced starting with Q1 2008 and is associated with both - the crisis and the underlying re-distribution of growth drivers away from the domestic economy to services exports, especially during the 2010-2011 'recovery'.

Thursday, June 27, 2013

27/6/2013: Quadru-Sextu-ple-dip Recession in Ireland: Q1 2013

All you need to know about today's QNA data release (though it won't deter me from more detailed analysis later) is:
  • Ireland is in a quadruple-dip recession (chart below)
  • You and I are in a sextuple-dip recession (second chart below)


Incidentally, just in case you felt like previous 'expansion' (officially from Q1 2010 through Q2 2012) was not much of an expansion at all, then you live in the world we inhabit, closely related to the Gross Domestic Demand. If you felt things were just fine then, you might live in Australia, or read too much of the Department of Finance presentations on their web site, or... I have no idea...

As I commented on earlier post by Brian Lucey: That light at the end of the tunnel did turn out to be an incoming train...

Update: Meanwhile, Minister Noonan thinks that the above (3 consecutive quarters of contraction in the economy, official fourth dip in the Great Recession and 6th dip in Total Domestic Demand) is "certainly disappointing but it's one set of statistics" (link). How long till Enda pops up to greet us with Dude's famous return: http://www.youtube.com/watch?v=QsogswrH6ck

Tuesday, June 11, 2013

11/6/2013: Irish Services Index: April 2013

Good news is: on an annual basis, per CSO, in April 2013:

  • Administrative and Support Service Activities rose +21.3%, 
  • Information and Communication went up +15.4%, 
  • Other Service Activities +4.2%, 
  • Transportation and Storage +1.4% and 
  • Accommodation and Food Service Activities (+0.3%) increased 
On bad news front:
  • Wholesale and Retail Trade were down -4.2% and 
  • Professional, Scientific and Technical Activities fell -0.6%.
The seasonally adjusted monthly services value index increased by 1.2% in  April 2013 when compared with March 2013 and there was an annual increase of 4.1%.

As you would know, I am not covering Services PMIs anymore, as these are no longer being released in any useful data format (Markit has decided to exclude reporting of actual levels of sub-components for PMIs, preferring to practically give instead its analysts personal opinion about these levels). 

However, I will continue reporting CSO data.

So here's more detailed analysis:
  • Wholesale Trade sub-index rose from 106 in March to 114.1 in April, marking a 7.64% rise m/m and a decline of 4.68% y/y. 3mo MA through April 2013 stood at 110.23, down on 116.67 3mo MA through January 2013 and down sharply on 122.07 3mo MA through April 2012. 6mo MA through April 2013 is at 113.45, down on 121.10 6mo MA through April 2012.
  • Wholesale and Retail Trade, repair of vehicles sub-index improved from 102.3 in March 2013 to 105.7 in April 2013 (+3.32%), but the index is down 4.17% on April 2012. 3mo MA through April 2013 is at 104.3 against 3mo MA through April 2012 at 111.27; 6mo MA through April 2013 is at 106.32 against 6mo MA through April 2012 at 110.80.
  • Transport & Storage sub-index is at 113.4 in April 2013 up marginally (+0.62%) m/m and up 1.43% y/y. 3mo MA through April 2013 is at 111.83 up on year ago 3mo MA of 106.83. 6mo MA through April 2013 is at 111.18, up on 6mo MA through April 2012 at 106.73.


  • Accommodation & Food Services slipped from 105.9 in March 2013 to 102.7 in April 2013 (-3.02%) and the index is up only 0.29% y/y. 3mo MA through April 2013 is at 103.2, which is up on 3mo MA through April 2012 at 101.2. Similarly, 6mo MA through April 2013 is at 103.77 which is up on previous year level of 101.3.
  • Much of the improvements in the above sector was driven by rising value of food services, up 3.51% y/y. Accommodation services actually fell 1.35% y/y and were down 9.07% m/m.
  • Administrative and support services activity also improved m/m (+1.66%) and rose strongly by +21.31% y/y. Huge gains were recorded in the activity on 3mo MA basis y/y and 6mo MA y/y basis. I have no explanation to this other than possibly reclassification of some activities into this category, plus boom in on-line services centres in Dublin (much of google and other ICT services firms activities here relate to support and admin, rather than R&D or professional work).


  • ICT services continue to boom, rising 15.42% y/yin April, although slipping 1.59% m/m from the historical record-breaking levels in March 2013. on 3mo MA basis, April 2013 stood at 122.13 strongly up on previous year levels of 109.87. On 6mo MA basis, April 2013 came in at 120.42, up on 110.42 a year ago.
  • In contrast to ICT services and Admin services, Professional, scientific and technical activities index declined for the third month in a row, falling to 91.0 in April 2013 from 91.2 in March 2013 (-0.22%) and is marginally lower (-0.55%) y/y. 3mo MA through April 2013 is at 91.4 and it is virtually flat on 3mo MA through April 2012 (91.2). 6mo MA through April 2014 at 91.0 is down on 94.5 6mo MA through April 2012.


  • Overall Services sector activity index rose 1.21% m/m from 107.7 in March 2013 to 109.0 in April 2013, and is up 4.11% y/y. 3mo MA through April 2013 is at 107.63 which compares marginally positively against 105.4 3mo MA a year ago. 6mo MA through April 2013 is at 107.62, also marginally up on 105.47 6mo MA through April 2012. However, 3mo MA through April 2013 was identical to 3mo MA through January 2013, implying zero growth, and 6mo MA through April 2013 was slightly ahead of 6mo MA through October 2013 (107.6 relative to 105.9).


Tuesday, May 7, 2013

7/5/2013: Irish Services Index, Q1 2013 data

Irish Services Index is out today for Q1 2013 and here are some details (monthly data analysis to follow). Keep in mind, data only starts from Q1 2009, so when referencing current levels of activity to peak, that refers to peak from Q1 2009 and not relative to pre-crisis activity.

  • Value in Wholesale & Retail Trade, Repair of Motor Vehicles & Motorcycles sector declined in Q1 2013 to 105.2 q/q (down 3.22% from 108.7 in Q4 2012) and is down 5.40% y/y. Q4 2012 value index was down 1.36% y/y, so things are getting worse faster. Relative to peak (since 2009 Q1 data start) the index is now down 5.40%. 
  • Value index for Transportation and Storage sector slipped marginally from 110.5 in Q4 2012 to 110.0 in Q1 2013 (-0.45% q/q) and is up 5.97% y/y. However, rate of annual growth declined in Q1 2013 compared to Q4 2012 when it stood at 8.97%. Relative to peak the index is still down 9.39%.
  • Accommodation and food services activities index also slipped marginally from 104.7 in Q4 2012 to 104.3 in Q1 2013 (down 0.38% q/q). Y/y index is up 3.48% in Q1 2013 and this is a slight gain on 3.05% y/y growth in Q4 2012. However, relative to peak index reading is still down 14.86%.


  • Information and communication sector index remained practically flat in Q1 2013 in q/q terms at 116.6 which is only 0.09% up on 116.5 in Q4 2012. Y/y index is up 3.83% and this shows deceleration in growth from +8.47% growth posted in Q4 2012. Despite this, Q1 2013 marks the peak of activity in this sector for any quarter since Q1 2009.
  • In contrast with ICT sector activity, the knowledge economy core services sub-sector, Professional, scientific and technical activities index has suffered steep declines since 2009. In Q1 2013 the index stood at 91.2 (up 0.22% q/q) up only 0.55% y/y. This marks a minor reversal of a significant decline of -8.36% recorded in 12 month through Q4 2012. The index is down massive 29.14% on peak.


  • Administrative and support service activities index has been a surprising performer during the crisis. In Q4 2012 it stood at 104.7 and Q1 2013 this increased to 110.4 a gain of 5.44% q/q. Index is now up 20.92% y/y and this compounds 11.38% y/y growth recorded in Q4 2012. Q1 2013 marks the peak quarter on record for the sub-sector.
  • Overall services index slipped from 107.2 in Q4 2012 to 106.2 in Q1 2013 (-0.93% q/q), although activity is still up 0.85% y/y. Y/y growth in Q1 2013 marks a slowdown from 2.19% y/y expansion in Q4 2012. The index overall is 0.93% below the peak and is currently running slightly behind the level of activity recorded in Q1 2009.


Overall, quarterly data shows weakening in Services sectors performance, and stripping out the effects of ICT (dominated by tax transfers-booking MNCs), Services side of the economy is showing weaknesses that are alarming. Recall that exports of services growth in 2010-2012 acted to compensate for declines in domestic demand and weaker growth (turning negative) in exports of goods. Should Services activity continue to suffer even modest declines, our GDP and GNP growth will be impaired. 

To see more forward-looking data, read my analysis of Services PMI for April: http://trueeconomics.blogspot.ie/2013/05/352013-irish-services-pmi-april-2013.html

Saturday, May 4, 2013

4/5/2013: Profit margins in Irish Services and Manufacturing: April 2013


Since I've been updating my database on PMI for Ireland (see Manufacturing PMI baseline results for April, as well as a post on Services PMI and a post on latest trends in employment as signalled by PMIs), it is also time to update dynamics analysis on profitability in both sectors.

Now, Services PMI survey covers profitability as a separate question, and it is reported in the post linked above. There is no comparative question in PMI for Manufacturing survey.

Over time, I have been tracking implied profitability changes in both sectors on a comparable basis as a difference between changes in input costs and output charges by the reporting firms. In a sense - it is a metric of profit margins dynamics that is comparable across both sectors.


Profit margins index for Services has declined from -14.29 in March 2013 to -16.39 in April. April reading was worse than -11.96 a year ago and worse than 12mo MA at -15.7. Dynamically, 3mo MA through April is at -15.0 which represents worsening in profitability conditions compared to -13.6 average for 3mo through January 2013 and is worse than -13.8 3mo average through April 2012.

Longer-term comparatives: since January 2012 through April 2013, Services profitability index averaged -15.31 - a rate of profit margins decline that is worse than the average rate recorded for 3 years period of January 2009-December 2011.


Profit margins in Manufacturing sectors have also deteriorated in April 2013 at -7.32, but the rate of deterioration was slower than in March 2013 when it stood at -12.04 and much slower than -22.86 rate of decline in profit margins recored in April 2012.

12mo MA is now at -11.1 and 3mo average rate was -15.2 for 3 months through January 2013, while 3mo average for February-April 2013 is at much more benign -9.9. In other words, there is moderation in the rate of margins decreases in recent months.

Longer-term dynamics are shown on the chart below in terms of 3 year averages. Since January 2012 through April 2013, Manufacturing profitability index averaged -13.83 - a rate of profit margins decline that is better than the average rate recorded for 3 years period of January 2009-December 2011 (-14.1). January 2012-April 2013, average rate of deterioration is still the second worst on the record.


An interesting aside: notice significant improvements in profitability in late 2008 - mid 2010 being exhausted in 2011-present in the Services sector and similar, but slightly differently timed changes in Manufacturing? These nicely coincide with the period of most dramatic unit labour costs declines and overall cost-competitiveness gains in the Irish economy. And, just as those gains virtually stopped in 2011-on, so did profit margins conditions improvements.

Sunday, April 7, 2013

7/4/2013: Irish Services Activity Index - February 2013


Irish Services activity fell in February 2013 per latest CSO data, marking second consecutive month of decline. In February 2013, Irish services index dropped 1.03% m/m and was down 0.45% y/y. The index 3mo MA is now at 106.43, only slightly ahead of 106.07 in 3mo period through November 2012, and still ahead of 105.43 3mo MA through February 2012. The same dynamics are repeated at the 6mo MA level.


Largest m/m declines were recorded in Wholesale Trade (-7.17% m/m and down 10.71% y/y), Accommodation & Food Services (-1.89% m/m and down 0.69% y/y). Largest m/m increases were in Administrative & Support Services (+2.95% m/m and up 15.74% y/y) and in Professional, Scientific & Technical Activities (+1.68% m/m and 2.02% y/y). 
In annualised terms, largest increases were recorded in Administrative & Support Services (+15.74% y/y), Accommodation Services (+6.92% y/y) and Transport & Storage (+5.61%).


One interesting point in terms of longer range analysis:


As chart above shows, the PMI data for Services Activity continues to bear no relations to the actual Services Activity Index measurements. Recall that in January and February, Services Activity Index posted two consecutive declines in activity. Over the same months, PMI for Services posted robust growth signals at 56.8 in january and 53.6 in February.

Sunday, March 24, 2013

24/3/2013: Irish GDP & GNP Growth 2007-2012


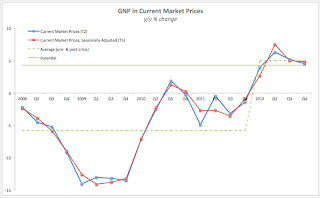
Five charts summarising Irish GDP and GNP dynamics in 2007-2012 period. The first set is of 4 charts plotting various measures of GDP and GNP in constant and current prices in terms of year-on-year changes:


In all of the above, I show two 'trend' figures: the 2% annual real growth trend as a long-term sustainability level of growth and the within-crisis (period of contracting GDP or GNP) and out-of-crisis (period of sustained positive growth) averages. These two sets of lines provide a marker for assessing as to whether or not the economy is currently running at the growth rates above or below trend.

And to summarise the state of play today:


Thus, after almost two years of 'turned corners' and 'recoveries'

  • Ireland's GDP and GNP are still massively below the pre-crisis levels of 2007. 
  • Ireland's GDP growth in constant and current prices is running below trend levels in Q3 and Q4 2012
  • Ireland's GDP growth shorter-term trend (post-crisis) is below the long-term trend levels, which is simply not consistent with normal U-shaped recovery
  • Ireland's GNP growth is running at above trend levels for 3 quarters now in constant prices terms, and close to the trend levels for current prices terms
  • By all measures (across current and constant prices) both GDP and GNP are posting markedly slower rates of growth in Q4 2012 compared to previous quarters.

Friday, March 22, 2013

22/3/2013: National Accounts 2012: Ireland - Part 4

The first post of the series covering 2012 National Accounts looked at the headline numbers for real GDP growth. The second post covered sectoral weights in GNP and our GDP/GNP gap. In the third post I explored the opportunity cost of the crisis and the effect the realignment of economic activities in Ireland is having on fiscal position.

Now, let's focus on the quarterly series. 

The headline for quarterly national accounts should be reading: Ireland is back in a recession for the fourth dip
  • Q/Q Irish GDP fell, in real terms, 1.5% in Q4 2012, which followed a 1.9% q/q contraction in Q3 2012, marking two consecutive q/q contractions. 
  • Y/Y Irish GDP was flat - exactly flat - on Q4 2011 but in Q3 2012 it was up 0.9%.

Meanwhile, 
  • GNP was up 0.67% q/q in Q4 2012 after posting a contraction of 1.75% in Q3 2012 in q/q terms.
  • Y/Y GNP was up 3.04% in Q4 2012 after posting a y/y gain of 3.9% in Q3 2012
  • In H2 2012, GDP rose 0.4 y/y and shrunk 1.4% on H1 2012, while GNP rose 3.5% y/y and was up 1.89% on H1 2012.

Volatility is the name of the game for our national accounts, folks.

You can see components of GDP dynamics here.

Quarterly GDP/GNP gap posted second consecutive easing, moving away from mean reversion, suggesting the MNCs are building up capex reserves - once these are to be deployed, prepare for the gap to shift down to 20-22% territory and GNP shrinking by up to EUR2.6bn in any given quarter of reversion relative to Q4 2012. Were mean reversion to bite in Q4 2012, we would have had GNP down y/y and q/q and ditto for H2 down y/y.


22/3/2013: National Accounts 2012: Ireland - Part 3


The first post of the series covering 2012 National Accounts looked at the headline numbers for real GDP growth. 

The second post covered sectoral weights in GNP and our GDP/GNP gap.

Overall, there are two main themes in rebalancing of the economy that showed up in data so far: 
1) Increasing share of MNCs activity in GDP (and temporarily GNP), which means that the official figures for the National Accounts now even more overestimate the real economic activity in the country; and
2) Long-term falling out of Agriculture, Forestry & Fishing and Construction sectors from the economy, with Public Administration & Defence clearly showing signs of contraction, albeit at the rate that is, so far, trailing contraction in overall economy over the period 2003-2012.

In this post, let's take a look at the opportunity cost of the crisis.

Recall that relative to peak, Irish GDP is down 5.97% as of the end of 2012 and GNP is down 8.08% despite 'two years of consecutive growth' the Government is so keen on emphasising. 

Also recall that 1980-2011 average growth rates in constant prices terms were 3.58% per annum, whilst IMF forecasts consistent structural or potential growth rate is currently around 2%. Using 2% figure we can, therefore, estimate the opportunity cost of the current crisis as losses to GDP and GNP arising from the growth foregone during the crisis. Chart below illustrates:


The grand total in opportunity cost due to the crisis (note, this is not an exercise in 'blaming the Government' or providing any estimate of real or actual losses, but rather an estimate of the opportunity cost of the crisis) is:
-- EUR104.5bn of cumulated foregone GDP for 2008-2012 or per-capita EUR22,823;
-- EUR58.8bn of cumulated foregone GNP for 2008-2012 or EUR12,828 per capita

With taxes net of subsidies at 9.647% of the GDP in 2012, the above implies roughly EUR10.1bn in foregone net tax receipts or ca EUR2bn in annual receipts. Using 2008-2012 average weight of net taxes in GDP implies EUR2.4bn in foregone annual net tax receipts.

What does this mean? Aside from the massive opportunity cost of the crisis, we have a rather revealing figure on foregone tax receipts. The figure clearly suggests that even were economic activity running at the 2% growth rate since 2007 without the crisis, re-alignment of economic activity away from domestic sectors toward MNCs-dominated activities and toward MNCs-dominated services activities in particular would still result in unsustainable deficits and would still required some sort of a fiscal adjustment, thanks to our taxation system that is extremely unbalanced when it comes to supporting MNCs-focused activities.

22/3/2013: National Accounts 2012: Ireland - Part 2


The first post of the series covering 2012 National Accounts looked at the headline numbers for real GDP growth (link here).

This post covers sectoral weights in GNP and our GDP/GNP gap.

In terms of the latter, GDP/GNP gap in 2012 stood at 22.02% in favour of GDP, down from the record 25.0% in 2011, but still the third highest in 2003-2012 period. The trend remains up and latest decline in the gap clearly appears to be mean-reverting adjustment similar to the pattern established since 2005-2006.


The above suggests that over time we can expect upward movement in the gap, leading to the contraction in GNP (either in growth terms or even in levels). For example, adjusting 2012 GNP for 3-year average gap implies lower GNP by some 0.3% or EUR378mln, adjusting the same for 3-year average annual growth rates in the gap implies GNP lower by EUR3.0bn or 2%.

While the above exercises are highly stylised and should not be taken as rigorous assessments, they show clearly that volatility in our GNP induced by the MNCs transfers of profits abroad is significant and renders some of the y/y comparatives highly suspect.


Now on to sectoral contributions to the economy:
  • Agriculture, Forestry & Fishing share of GNP declined from 2.4% in 2011 to 2.1% in 2012, thus falling back to where it was at the peak of the property and construction boom in 2006. This is the joint-lowest sector weight in GNP in 2003-2012 series with 2006 being another year of lowest contribution. Put simply, we have a Department out there in the Civil Service that is overseeing something that amounts to only 2.1% of the economy and not once in 2003-2012 period amounted anything more than 2.9%. In fact, 2003-2012 average contribution for the sector is just 2.53% with subsidies from EU accounting for much of that. You don't have to be a genius to see that the 'Food Island' ideal is just a pipe dream when it comes to our own production levels. We might have a larger food sector, but it is not dependent critically on our agricultural sector.
  • Industry accounted for 28.4% of GNP, down from 29.3% in 2011. 2003-2012 average contribution is 30.24% which shows overall the secular decline in the sector importance. Most of this decline was driven by the collapse of Building & Construction sector which went from 9.9% share in 2004 to 1.4% share in 2012 - massive 8 years of consecutive declines. Ex-Construction, Irish industry (well, mostly MNCs) have grown in their share of GNP contribution from 24.6% in 2003 to 27% in 2012.
  • Distribution, Transport & Comms sector share remained relatively static at 27.5% of GDP in 2012 compared to 27.6% in 2011 when it heir the record levels for 2003-2012 period.
  • In line with the declines in overall activity, Public Administration and Defence sector posted a decrease in its share of GNP from 5.9% in 2011 to 5.5% in 2012. Still: back in 2003-2006 the sector was running at 3.9% to 4.1% and 2003-2012 average is still 5.2% - below the current running levels. 
  • Other Services sector importance in GNP contribution fell back from 46.7% in 2011 to 45.2% in 2012 and the sector is now slightly behind the 46% average for 2003-2012.
  • Taxes Net of Subsidies slipped further from 12.4% in 2011 to 11.8% in 2012. The 2003-2012 peak was in 2007 at 16.1%.


Thus, overall, there are two main themes in rebalancing of the economy: 
  1. Increasing share of MNCs activity in GDP (and temporarily GNP), which means that the official figures for the National Accounts now even more overestimate the real economic activity in the country; and
  2. Long-term falling out of Agriculture, Forestry & Fishing and Construction sectors from the economy, with Public Administration & Defence clearly showing signs of contraction, albeit at the rate that is, so far, trailing contraction in overall economy over the period 2003-2012.


Thursday, March 21, 2013

21/3/2013: National Accounts 2012: Ireland - Part 1


This is the first post on the QNA data for National Accounts for 2012 released today.

In this post, let's take a look at the National Accounts in Constant Market Prices Terms for GDP disaggregation by Sector of Origin.

Top-line results:
  • Agriculture, forestry and fishing sector (the 'Food Island' thingy) posted a big decline y/y in 2012 in overall activity, down from EUR3,049bn to EUR2,744bn between 2011 and 2012. The sector is now down 30.6% on peak (2005) activity and 20.4% below the 2003-2012 average level of annual activity. Sector activity is down 27.1% on 2003. In brief, this is the sector is in the fifth consecutive year of contractions. 
  • Industry activity rose marginally in 2012 to EUR37.269bn from EUR 37.168bn in 2011 (up 0.27% y/y). The pace of annual increases slipped from 1.88% in 2010 to 1.76% in 2011 and to 0.27% in 2012. The sector activity is down 20.53% on peak (2004) and down 9.43% on 2003-2012 average, with sector activity now running at 17.03% below 2003 levels.
  • As the sub sector of Industry, Building & Construction activity continued to decline in 2012, marking 8th consecutive year of decline since the peak in 2004. The sub-sector activity dropped to EUR1.857bn in 2012 down 7.38% on 2011 level with 2012 being the first year since 2008 when activity y/y declines were in single digits percentage terms. Needless to say, the sub-sector activity is now running 86.4% below peak levels, 72.3% below 2003-2012 average and 85.1% below 2003 levels.
  • Distribution, Transport and Communications sector activity rose 3.09% y/y in 2012 to mark another year of record activity at EUR36.125bn. The rate of growth y/y was robust, but behind 3.88% recorded in 2011 and 4.7% in 2010. The sector activity is now running at 25.8% ahead of 2003-2012 average and 66.71% up on 2003 level. Good performance.
  • Public Administration & Defence sector didn't do a hell of a lot over the year, posting EUR7.236bn contribution to GDP in 2012, down 4.17% y/y. This was a deeper contraction than 3.58% decline in 2011, but shallower than 5.6% drop in 2010 and 4.5% in 2009. The sector activity overall is now down 16.7% on peak (2008) and is 2.93% ahead of the 2003-2012 average, while overall activity level is up massive 34.4% on 2003 level. All in, the sector is the only other sector (in addition to Distribution, Transport & Communications) that sees its activity running ahead of 2003 levels.
  • Other services (including rents) sector activity rose from EUR59.252bn in 2011 to EUR59.372bn in 2012 in constant prices terms, up 0.2%, marking the first year of growth since the peak in 2006. The sector overall performance is now 5.03% below 2003-2012 average and is 0.7% behind 2003 levels.

All in, as mentioned above, only two sectors of economy are currently (end of 2012) up on 2003 levels of activity once we control for inflation: Distribution, Transport & Communications and Public Administration & Defence.


Taxes net of Subsidies fell marginally from EUR15.769bn in 2011 to EUR15.456bn in 2012, down 1.98% y/y. The rate of decline has now accelerated once again from 1.13% in 2011, but is behind 2.65% drop in 2010. Compared to peak (2006), Taxes Net of Subsidies are down 32.9% and down 17.6% on 2003-2012 average. This category contribution to GDP is now down 15% on 2003 levels once we adjust for inflation.

Overall GDP at constant market prices rose to EUR160.214bn from EUR158.725bn in 2011 up 0.94% y/y, posting slower rate of growth than 1.43% in 2011. The GDP, adjusted for inflation now stands at 5.97% below the peak at 2007 and 1.11% below 2003-2012 average. Compared to 2003 GDP is up 4.74%.

Net Factor Income from the Rest of the World recorded another outflow from Ireland of EUR28.908bn in 2012, down on outflow of EUR31.742 bn in 2011, marking the second highest rate of annual outflows during 2003-2012 period.

Lower outflows and higher GDP helped push GNP up to EUR131.306bn in 2012 from EUR126.983bn in 2011, a rise of 3.4% y/y, reversing 2.47% decline in 2011 and up on 0.94% increase in 2010. Relative to peak (2007) GNP is now down 9.61% and GNP is down 3.41% on 2003-2012 average. Compared to 2003 the GNP stands at -0.45%.


So overall, 2012 did post growth of 0.94% on GDP side in real terms and a more robust gain of 3.4% on GNP side. However, both expanded on foot of external sectors and factors, namely marginal growth in Industry (+0.27% y/y marking big slowdown on 2011 growth), Distribution, Transport & Communications (+3.09% y/y in 2012 marking another slowdown on 2011 growth rates) and Other Services (+0.2% y/y - an improvement on contraction of -0.93% in 2011). GNP growth was also underpinned by reduced outflow of funds from multinationals abroad, which is a temporary factor, likely to be reversed once MNCs begin new investment outside Ireland.

In the next post I will cover sectoral weights and GDP/GNP gap.

Monday, March 11, 2013

11/3/2013: Irish Services Activity: January 2013

In an earlier post I covered annual figures for Services Index for Ireland (link here). Today's release from CSO also provides data for January 2013 (monthly series) and here is the detailed analysis of shorter-term series.


  • Wholesale Trade activity index rose in January 10 118.8 from December 2012 level of 115.2 (+3.13% m/m). The index is down 1.49% y/y. 3mo average is at 117.23 up on previous 3mo average of 115.93, but down on 3mo average through January 2012 which stood at 120.47. 6mo average is 116.6 against previous 6mo average of 120.9 and a year ago 6mo average of 119.9. Thus, at 3mo average activity through January 2013 is slower than through January 2012. Ditto for 6mo average.
  • Wholesale & Retail Trade, Repair of Motor Vehicles and Motorcycles activity index increased to 108.9 in January 2013 - up 1.02% m/m, but down 1.27% y/y. 3mo average through January 2013 is static compared to 3mo average through October 2012 and is down on 3mo average through January 2012. 6mo average through January 2013 is down on 6mo average through July 2012 and down on 6mo average through January 2012. Slowdown in the broader category, therefore, is more pronounced and stretched over the last 12 months than in Wholesale Trade alone.
  • Transport & Storage services activity index dipped from 112.1 in December 2012 to 111.5 in January 2013, a decline of 0.54% m/m. However, the index is up 10.29% y/y. 3mo average is statistically indifferent in 3mo through January 2013 (111.3), as in 3 mo through October 2012 (111.9), but is significantly ahead of 3mo through January 2012 (101.2). 6mo average through January 2013 (111.62) is ahead of 6mo average through July 2012 and ahead of 6mo average through January 2012.
  • Accommodation & Food services index declined in January 2013 to 103.5, down 1.33% m/m and marked second consecutive monthly decline. The index is up 2.38% in y/y terms. 3mo average through January 2013 is at 104.6, which is lower than 3mo average though October 2012 (105.63) but above 3mo average through January 2012 (101.6). On 6mo average basis activity through January 2013 was ahead of activity through July 2012 which itself was ahead of activity in 6 months through January 2012.
  • Information & Communication services activity declined in January 2013 from 121.7 in December 2012 to 119.8 (decline of 1.56% m/m) although activity was strongly up (+11.76%) on January 2012. 3mo average through January 2013 was at 118.7, well above 3mo average through October 2012 (112.23) and 3mo average through January 2012 (108.43). Similar increases are traceable to 6mo averages.
  • Professional, Scientific & Technical activities index rose to 90.2 in January from 89.4 in December 2012 (+0.89% m/m) although the index is down 1.85% y/y. 3mo average through January 2013 is at 90.53, ahead of 3mo average through October 2012 (87.83), but behind 3mo average through January 2012 (98.13). Similar dynamics can be traced across 6mo averages.
  • Administrative & Support services index rose strongly from 100.7 in December 2012 to 104.2 in January 2013 (+3.48% m/m). The index is up incredible 19.63% y/y and I am at a loss as to how this can be explained given the current economic environment and fiscal consolidation. on 6mo average basis index is up from 91.88 average for 6mo through January 2012 to 102.63 average for 6mo through January 2013.
Charts to illustrate:


  • Total services activity inched up to 107.9 in January 2013 from 107.7 in December 2012. Year on year, the index clocked a rise of 4.35%. 3mo average through January 2013 was at 107.57 - ahead of 3mo average a year before (105.73).

Despite these above improvements, overall services activity remains below the long-term recovery trend, albeit, owing to the strength of Wholesale Trade and ICT sectors (see the annual data analysis for these) and to the surprise uptick in Admin & Support services, the sector is tracing a shallow U-shaped recovery path so far. From January 2009, it took the index 16 months to hit the bottom, and we are 32 months into the recovery now, with still 1.55% to go (1.86% on 3mo average basis) before regaining January 2009 levels of activity. We will, barring unexpected events, close this gap in the next 2-3 months, but do keep in mind that January 2009 was already 1 year into contracting services activity in the first place.

11/3/2013: Irish Services Sectors Activity in 2012

Data for 2012 end of the year index of activity in Irish Services sectors is out and before I cover monthly data for January 2013, here are some annual results:

  • Wholesale trade services activity expanded 4.03% in 2011-2012, after growing 14.2% in 2010-2011. In 2012 the sub-sector activity was up 31.6% on 2009 and up 18.8 on 2010 making this the fastest growing sub-sector in all Irish services since 2009.
  • Wholesale and retail trade, repairs of motor vehicles and motorcycles sub-sector activity grew 2.24% in 2012 compared to 2011 after having expanded 7.2% in 2010-2011. Over 2009-2012 the sub-sector activity grew incredible 14.6% all of which was driven solely by growth in wholesale trade, offset by shrinkages in retail and other sub-sector activities.
  • Transportation and storage sub-sector activity expanded 5.39% in 2011-2012 period, having grown at 3.8% in 2010-2011 period. Since 2009 through 2012 sub-sector activity shrunk by 1.88%.
  • Accommodation and food services activities expanded at 2.27% in 2011-2012, following growth of 1.4% in 2010-2011 period. Between 2009 and the end of 2012, sub-sector activity was down 6.74%. Accommodation sub-sector alone grew 2.18% in 2011-2012 after posting growth of 5.4% in 2010-2011 and the index is on the aggregate still down 3.67% on 2009. Bizarrely, Food services activities grew since 2009 through 2012 at 1.76%, and this sub-sector posted expansion of 6.80% in 2011-2012 that followed growth of 2.9% in 2010-2011 period.
  • Information and Communication sub-sector activity was the star of the show in 2011-2012, rising 8.40% on foot of 3.6% growth in 2010-2011. The sub-sector is now up 20.11% on 2009 making this the second fastest growing sub-sector in Irish services after Wholesale trade.
  • Professional, scientific & technical activities sub-sector activity was the worst performing sub-sector in 2011-2012, shrinking 10.39%. This followed growth of 1.1% in 2010-2011. The sub-sector activity is now down 23.80% on 2009 making it overall the worst performing sub-sector, even worse than the Services (68, 92 to 96) sub-sector described below.
  • Administrative and support services activity sub-sector clearly doesn't have much in common with the sub-sectors that usually require significant admin & support (e.g. professional, scientific and technical areas of activities) as it posted an robust growth rate of 7.54% in 2011-2012, albeit on foot of strong contraction of 7.2% in 2010-2011 period.The sub-sector activity is cumulatively up 2.67% on 2009. Either Irish exports are becoming more bureaucratised to warrant increases in Admin & supports, or there's some sort of substitution from shrinking public sector employment to temps and outsourced services. Otherwise, why on earth would an economy in a deep slowdown post growth in this category on 2009 figures?
  • Services (68, 92 to 96) encompassing Real Estate activities, Gambling and betting activities and Other personal service activities were down 3.48% in 2011-2012, following virtually zero (+0.7%) expansion in 2010-2011. The grouping is down 19.67% on 2009 levels of activity.

Overall, for all services covered in the CSO data, sector growth clocked at 2.52% in 2011-2012 period, down from 3.3% growth in 2010-2011. Not a good sign, but better than posting negative growth, I guess. Compared to 2009, sector activity is up miserly 3.52%. And that is despite increases in R&D spending, massive hikes in availability of state-financed VC and angel investment (via Enterprise Ireland), big-time focus on incentives (including tax incentives) in 'key' sectors etc. Not exactly an achievement to brag about, but, again, could have been worse.

Here's another interesting chart:


As I mentioned above, Professional, scientific & technical activities sub-sector activity was down 23.80% on 2009 making it overall the worst performing sub-sector in all services sectors covered. Which isn't going well with the claims we keep hearing about our 'knowledge economy' and 'smart economy' and the rest of the hoopla surrounding branding like 'Innovation Island'. Looks like stripping ICT, there is not much of 'knowledge'-intensive trading going on out there. And we take out IFSC, the whole landscape of 'knowledge-based economy' might just as well start resembling a veritable desert? Instead, the 'traditional' (aka not 'smart' according to our Government policies priorities) wholesale trade is driving the sector activity, plus the 'smart' ICT sector.

And one last point. Here's the Services PMI data for Ireland for the period covered above in the index (see latest data here: http://trueeconomics.blogspot.ie/2013/03/533013-irish-services-pmis-february-2013.html) ...

Strange that a lift-off in PMI from ca 35 average in 2009 to 52 average in 2012 should be translating into only 3.5% increase in actual services activity, no? Sort of suggests something bizarre going on in PMI data, right? Hello, Markit!.. Station Earth paging...