Showing posts with label Irish services. Show all posts

Sunday, February 10, 2013

10/2/2013: Irish Services Index: Still Searching for a Catalyst


Catching up with some data updates, the latest monthly data for Services sectors activity in Ireland was out recently (see link to CSO release here). The data overall points to weaknesses in Services in December 2012, as the summary table shows:

However, let's take a look at subtrends and subsectors:

  • Wholesale Trade sub-index fell 4.01% m/m in December 2012 to 112.4 and was down 7.11% y/y. 3mo average through December 2012 is at 115.37 - well ahead of December 2012 monthly reading of 112.4, but down on 3mo average through September 2012 which stood at 116.23. 3mo average through December 2011 was 120.2 - significantly ahead of the average activity recorded in 3mo through December 2012. December 2012 reading was statistically within the historic average.
  • Wholesale and Retail Trade, Repair of Vehicles etc sub-sector activity fell 2.65% m/m and was down 4.23% y/y in December 2012. 3mo average through December 2012 (108.57) was ahead of December monthly reading (106.4) and virtually unchanged on 3mo average reading through September 2012 (108.27). However the index reading and its 3mo average were both behind 3mo average through December 2011 (110.57). Similar deterioration in performance marked H2 2012 readings relative to H1 2012 and H2 2011.
  • Transportation and Storage sub-sector activity remained relatively flat in December (110.1) compared to November (110.0) rising just 0.09% m/m, although the series are up 6.17% y/y. 3mo average through December 2012 (110.07) is below 3mo average through September 2012 (112.77), but well ahead of 3mo average through December 2011 (101.93). H2 2012 average stands ahead of H1 2012 average.


Per chart above, 
  • Accommodation and Food Services sub-sector activity remained largely unchanged in December 2012 (105.5) compared to November 2012 (105.6) with 0.095% decline m/m contrasting 1.74% rise y/y. 3mo average through December 2012 (104.97) was only marginally ahead of 3mo average through September 2012 (104.83) and is ahead of 102.27 reading for 3mo average through December 2011. H1 2012 average was at 101.83 and this rose to 104.9 for H2 2012 average. December 2012 marks the fifth highest index reading since November 2009.
  • Within the above sub-sector, Accommodation activity fell 0.18% m/m and rose 9.34% y/y - the largest rise in annual terms of all sub-sectors. Accommodation activity performance was particularly strong in H2 2012 (3mo average through December 2012 was 109.47 and 3mo average through September 2012 was 109.83) when activity index averaged at 109.65, compared to H1 2012 when it averaged 103.95.
  • Administrative services fell 2.64% m/m but are still up 3.75% y/y, with 3mo average through December 2012 (102.17) virtually identical to 3mo average through September 2012 (102.20) and both ahead of 3mo average through December 2011 (92.0). H1 activity came in at slower pace than H2.
In heavily exporting sub-sectors of Services:
  • ICT services activity rose 4.23% m/m in December 2012 (to 118.3) and was up 9.13% y/y. 3mo average through December 2012 stood at 114.83, ahead of 3mo average through September (110.17) and ahead of 3mo average through December 2011 (107.43). H2 2012 average activity stood at 112.5, up on 110.33 average for H1. The sub-index hit an all-time high in December 2012.
  • In contrast with ICT Services, Professional, Scientific & Technical Activities have recorded an unpleasant contraction of 3.82% m/m in December 2012 to 88.2. The index is now 11.8% behind its average activity in 2010 and it has fallen a massive 16.40% y/y. 3mo average through December 2012 stood at 90.23, slightly up on abysmal 3mo average through September 2012 (86.8) but well below the 3 mo average through December 2011 (99.0). H2 average activity (88.52) was well below H1 2012 average activity (92.4) and well below H2 2011 activity (99.45).


Chart above provides outline for the overall Services Activity Index:
  • The index has declined marginally (-0.66%) m/m to 106.0 in December 2012 and is now down 1.12% y/y. 3mo average through December 2012 was slightly healthier at 106.43 than the 3mo average reading through September 2012 (104.87), with 3mo average through December 2011 recording 105.0. However, overall H2 2012 average was practically unchanged at 105.65 against H1 2012 average of 105.43.
  • The index is now reading below its momentum trend and is only marginally above (statistically) its historical average. As the chart above clearly shows, Irish Services Sector has been bouncing along a flat for some 13 months now, following a rise in twelve months before December 2011.
  • Overall, thus, the data is not very encouraging. The sector seems to be searching for a catalyst to either the upside or the downside. Transport & Storage, ICT Services and Accommodation provide some hope (on the basis of y/y comparatives for 3mo average through December 2012, as well as December own y/y changes) for the future, whilst Wholesale services, as well as Professional, Scientific and Technical services creating a powerful downward drag.

Wednesday, December 19, 2012

19/12/2012: Irish National Accounts Q3 2012 - part 2


As promised in my first post on Q3 2012 National Accounts, here are the details of the main components of Irish GDP and GNP with more short-term trends focus (first post focused on cumulated changes for the 9 months from January through September 2012).

Unfortunately, these short-term series are less impressive than cumulated series. Here's why.

First, consider GDP and GNP decomposition by sector of activity, expressed in constant market prices terms:

  • Agriculture, Fishing & Forestry (AFF) subsector posted €564 million worth of activity in Q3 2012, down €477.o million (-45.8%) on Q2 2012 and down €123 million (-17.9%) y/y. This marks the second consecutive quarter of y/y declines, which technically means that the sector is in a recession. AFF sector overall share of GDP is now 1.41%, so it is a minute contributor to the GDP dynamics.
  • Industry activity printed at €8,868 million in Q3 2012, down €1,659 million (-15.8%) q/q and down 4.0% y/y. Only about 1/4 of the overall decline in Industry activity came from Building & Construction sub-sector which posted another fall-off in Q3 compared to Q2 (down €17 million or -3.7% q/q and down 9.9% y/y). Overall Industry share of GDP is now at 22.15% so any movement in the sector activity is significant for headline GDP and GNP.
  • Distribution, Transport and Communications (DTC) sector expanded to €8,940 million in Q3 2012 (up €1,071 million or +13.6% q/q and up 1.8% y/y). The sector now accounts for 22.33% of GDP.
  • Public Administration and Defence (PAD) sector showed €37 million (+2.1%) q/q expansion in Q3 2012, printing at €1,823 million. Y/y the sector is down 4.1% (just €78 million in net reductions). The sector now accounts for 4.55% of our GDP.
  • Other Services - a sector accounting for 37.4% of our GDP - increased activity by €239.0 mln (+1.6%) q/q and are up 0.3% or €47 million y/y. 
  • Compared to Q3 2007: Agriculture, Forestry and Fishing sector activity is down 27.4% (-€213mln); Industry activity is down 12.8% (-€1,298mln), of which Building & Construction is down 63.1% (-€765mln); Distribution, Transport and Communications sector is up 25.8% (+€1,832mln); Public Administration and Defence is down 14.9% (-€318mln); Other Services are down €980mln or -6.1%.


The above chart shows GDP and GNP prints, which posted the following dynamics in Constant Prices terms:
  • GDP at constant factor cost (ex net taxes) was down to €36,043 million in Q3 2012 (-€865mln and -2.3% q/q). Y/y GDP at constant factor cost is up €272 million (+0.8%)
  • Taxes net of subsidies rose to €3,998 million (+€353mln and +9.7% q/q) and are up €48mln (+1.2%) y/y.
  • Thus, GDP at constant market prices was down to €40,041 million in Q3 2012 (down €512mln or -1.3% q/q) and up €320mln (+0.8%) y/y. Compared to 2007 levels, GDP is down 3.3% (_€1,3540mln).
  • Net factor income from abroad contracted by €154mln in Q3 2012 (-2.1% q/q) compared to Q2 2012 to -€7,069mln. Year on year outflows are down €859 million or -10.8%. However, net outflows abroad are still up 17.2% (€1,038mln) on 2007. Currently, net transfer from Ireland abroad amount to 17.65% of our GDP.
  • With reduced outflows to the rest of the world (primarily driven by falling transfer pricing by multinationals), our GNP in constant market prices still contracted by €358 million (-1.1%) q/q. In Q2 2012 it grew by €2,075mln (+6.6%) q/q. The robust growth in Q2 was partially offset by the decline in Q3. Year-on-year our Q3 2012 GNP is still up +€1,178mln (+3.7%). However, compared to 2007, Q3 2012 GNP is down €2,237mln (-6.4%).
As the result of the above, Irish GDP/GNP gap decreased slightly from 17.81% in Q2 2012 to 17.65% in Q3 2012.


Here are the components of the above expressed as indices, with Q1 2005 set at 100:


On seasonally-adjusted basis, expressed in Constant Market Prices terms:

  • Personal Consumption of goods and services rose €160mln (+0.8%) q/q and is up €367mln (+1.8%) y/y. However, this is not the first time that personal consumption increased since the beginning of the crisis. For example, it rose €335mln in Q1 2010-Q3 2010 and by €420mln in Q3 2011-Q4 2011. 
  • In real, seasonally-adjusted terms, our personal consumption of goods and services is now at the levels between Q4 2005 and Q1 2006. However, some of this 'support' for consumption is coming from significant price increases in state-controlled sectors, which are not linearly reflected in GDP deflators (price adjustments).
  • Net expenditure by central and local government decline €4 million to €6,204 million in Q3 2012 compared to Q2 2012 (-0.1% q/q) and is now down €172 million y/y (-2.7% y/y).
  • While Personal Consumption fell €3,013 million (-12.8%) in 2007-2012 Q3 on Q3, Government spending declined €1,132 million (15.4%) over the same period of time. At annualized rates, this means a decline of personal consumption contribution to GDP of some €12 billion per annum and a decline of Government spending contribution to GDP of some €4.5 billion per annum.
  • Irish Government expenditure in real terms is running at the levels comparable with Q1-Q2 2006, or a quarter ahead of where personal consumption rests. However, any biases induced to personal consumption upside from state-controlled price increases also act to generate superficially lower government spending reported here (as this is Net expenditure by the government, excluding taxes and receipts). In other words, the true difference between Government and private spending is most likely much wider than one quarter.
  • Gross domestic fixed capital formation improved in Q3 2012 compared to Q2 2012, rising to €3,962mln (+€315mln or €8.6% q/q), which resulted in an annual increase of €323mln (+8.9%) y/y. Still capital formation is down €7,432 million (-65.2%) on Q3 2007.
  • Our fixed capital formation is now running at just 40% of Q1 2005 levels.
  • Exports of goods and services rose 1.3% (+€567mln) in Q3 2012 compared to Q2 2012 (increase of €2,788mln or +6.7% y/y). Imports are up €1,005mln (+3.0%) q/q and are up €1,742 mln (+5.3%) y/y. Compared to Q3 2007, exports are now up 17.3% (+€6,598mln) and imports are down 1.2% (-€404mln).
  • Irish exports now account for 108.01% of our GDP and our imports are at 83.38% of GDP.


In seasonally-adjusted terms:

  • Irish GDP rose €310mln (+0.8%) q/q and €1,464mln (+3.7%) y/y, but GDP remains deeply below Q3 2007 levels (-€4,632mln or -10.1%).
  • Irish GNP shrunk €245mln (-0.7%) q/q and is up €1,909mln (+6.0%) y/y. GNP remains deeply below Q3 2007 levels (-€6,357mln or -15.8%).


Tuesday, December 18, 2012

18/12/2012: QNA Q3 2012: Q1-Q3 cumulated results


Some positive news today on a major front with the release of Q3 2012 preliminary QNA estimates. Headlines are good, predominantly. Here is a post covering cumulated Q1-Q3 data for 2007-2012. More detailed analysis of dynamics in QNA components later tonight.

In Q1-Q3 (9 months) cumulated period:

  • Irish GDP in Constant Market Prices rose from €119.261 billion in 2011 to €120.246 billion, implying y/y growth rate of 0.826%.
  • Irish GNP also increased, from €94,721 million in 2011 to €97,557 million in 2012 yielding a y/y growth rate of 2.99%.
  • In nominal terms (current market prices), Irish GDP was up from €119.123 billion to €123.299 billion (+3.506% y/y), while Irish GNP increased from €94.493 billion to €99.645 billion (+5.452% y/y).
Two charts to illustrate the above:

Here's for those who feel relaxing at today's reading:

  • Compared to peak, Irish GDP in constant prices terms is still 5.37% below the level attained for Q1-Q3 2007, while in current terms it is 12.15% down on the peak.
  • Compared to peak, Irish GNP in constant prices terms is down 7.96% and in current market prices terms it is down a massive 17.04%.

Domestic demand has continued deterioration over the first 9 months of 2012, so domestic economy is still contracting overall:
  • Final Domestic Demand in constant prices terms fell in the nine months from January 2012 from €90.515 billion in 2011 to €88.987 billion (-1.69% y/y).
  • Final Domestic Demand in current prices terms also fell in the nine months from January 2012 from €91.188 billion in 2011 to €90.991 billion (-0.21% y/y).
  • Final Domestic Demand in constant terms is currently down 22.02% on 2007 (Q1-Q3) cumulative levels and is down 27.83% in current prices terms.


More on sub-series dynamics later tonight.

Friday, December 7, 2012

7/12/2012: Irish Services Index - October 2012


The latest data on Services Sector activity in Ireland for october 2012 is very encouraging and reflective of the underlying growth signaled by previous PMI in Services readings.

Headline CSO-published monthly Services Activity Index for non-financial services in Ireland rose 3.8% m/m in October (after weak -2.4% m/m reading in September) and is now standing at 107.0 - an all-time high. Note, data for these series runs only from October 2010. Year on year the index is now up 10% on October 2012, the first time annual rate of growth hit double-digits expansion in series history. 

Removing some of the volatility, 3mo MA is now at 105.3 - the highest it has ever been. Solid upward push well beyond the already upward-sloping trend is very encouraging. 3mo MA in 3 months through July 2012 was 105.0 - also strong reading, especially compared to 98.7 3mo MA through October 2011.

Growth rates are impressive: 3mo average growth rate through October is 6.7% on annualized basis, ahead of 6.1 reading for 3mo average through July 2012 (although m/m rate is 0.63%, well below previous 3mo average of 1.2%).


Decomposition by sub-sectors is also solidly expansionary:
  • Wholesale and Retail Trade index rose to 115.3 in october, up 6.2% on September (following m/m fall-off of 2.6% in September) and up 10.5% y/y - the fastest pace of annual expansion in series history. 3mo MA is at 111.8 ahead of 3mo MA through July 2012 which stood at 110 and well ahead of 3mo MA through October 2011 (104.7). Average monthly rate of growth remained 1.33% in August-October, same as in May-July 2012. Annual rate of expansion based on 3mo MA series is now at 6.8% well ahead of 6.2% recorded for 3mo through July.
  • All of activity in the wholesale and Retail Trade came in from Wholesale Trade side, with Wholesale Trade index rising to a historic high of 128.7 (+8% m/, and +15.4% y/y). Wholesale activity was booming, which might be a net positive to the holidays sales season. 
  • In ICT services, activity rose 1.2% m/m and 6.5% y/y to 107.7. This only partially reversed the contraction of 2.8% m/m recorded in September 2012. The annualized rate of growth in the sub-sector slowed down to 6.5% in october from 7.3% in September. Thus, 3mo MA series are less impressive in dynamics: 2012 3mo MA through October stood at 107.9, down on 111.3 3mo MA for period through July 2012, but still well ahead of the 3mo MA through October 2011 (101.7). 
  • The sector is pivotal to our exports and the fact that annualized rate of growth fell to the 3mo MA of 6.1% in August-October compared to 12.5% for the 3mo period through July 2012 is a bit of a concern. Still, I am happy to take 6.1% growth in the current global environment.
  • Business Services index rose to 107.8 in October, the highest reading on record, with m/m growth of 6.3% (fully reversing the slide of 1.2% recoded in September). Year on ear the series up 10.7%. 3mo MA series are showing similar performance to the core index: 3mo MA through October is at 104.5, slightly up on 3mo MA through July 2012 (104.0) and significantly up y/y (100.5 recorded in 3mo through October 2011). Surprisingly, Business Services activity m/m expansion rate has slowed down over the last 3 months from the average of +2.3% m/m in May-July 2012 to an average of +0.9% in August-October. However, annual rate of expansion picked up from +0.4% in 3mo through July to +4.2% in 3mo through October.
  • Transportation and Storage sector activity rose marginally from 113.0 in September to 113.4 in October. The sector failed to recover from a 1% m/m slide in September, gaining just 0.4% m/m in October. However, annual rates of growth in the sector are now running at double digits for 7 consecutive months and the rate of expansion has accelerated to 17.6% in October 2012, marking the fastest annual rate of growth in the sub-index history.
  • Accommodation and Food sector activity slipped for the second month in a row. 3.1% m/m drop in September was followed by a 0.3% slip in October. 3mo MA for the index is now at 91.6, against 3mo MA through July of 89.4 and 3mo MA through October 2011 of 87.8. The sector has been a major disappointment in terms of activity since the start of the series.
  • Other Services also showed persistent weakness in recent months - the fall m/m in the subindex of 0.8% in September was moderated by a rise of 0.7% in October, but overall the index is a relative laggard in the entire Services group, performing worse than even Accommodation & Food. 


So on the net, very robust index performance for Services sector activity, with good strengths in terms of 3mo MA trends in Wholesale Trade, Business Services, and Transportation & Storage, relatively steady performance in ICT services and continued weaknesses in Accommodation & Food and Other Services sub-sectors.

Sunday, November 18, 2012

18/11/2012: Irish Services Index - September 2012


Per CSO recent release (catching up with the data lags): Monthly Services Index for Ireland declined 2.9% m/m and rose 3.3% y/y in September 2012.

The dynamics were not great in m/m terms, but remain relatively firm on y/y basis:


The overall index hit second highest reading in series short history in August at seasonally adjusted 105.4 (highest reading was recorded in May 2012 at 105.9) and declined to 102.3 in September. 3mo MA through September is at a healthy 104.2, up on 103.6 3moMA through June 2012 and up on 98.7 3moMA through September 2011. In quarterly terms, 3Q 2012 ended up at 104.2, 0.6% ahead of previous quarter, marking the lowest q/q rate of growth since Q4 2011, however y/y Q3 2012 is up 5.6% - fastest growth on record so far (the records start at Q1 2011).

The slowdown in September was very broad:


In m/m terms:
  • Wholesale & Retail Trade sector posted a decline of 2% to 108.7, with 3mo MA at 110.1 still ahead of previous 3moMA (through June 2012) at 108.3 and ahead of Q3 2011 of 104. 
  • Wholesale Trade activity is down 5% to 118.3 in September.
  • Information and Communications sector posted a massive drop of 6.7% in September 2012
  • Business Services dropped 1.9% in September 2012 and posted an annual decline of -0.3%.
  • Transportation & Storage declined 1.9%, although the sector is up 14.2% y/y
  • Accommodation & Food sector is down 2.9% m/m and up 3.4% y/y
  • Other Services declined 0.5% m/m but are still up 2.1% y/y.

Looking at more stable, quarterly data:
  • Wholesale & Retail Trade sector index stood at 110.1 in Q3 2012, up 1.7% q/q and up 5.9% y/y
  • Wholesale Trade index was at 122.3, up 2.2% q/q and 10.6% y/y, which suggests that Retail Trade activity was rather subdued.
  • Information & Communications index was at 106.9 in Q3 2012, down 3.4% q/q and up 7% y/y. This marks the first quarter of q/q declines in the index reading since Q1 2011.
  • Business Services were up 2.1% q/q and y/y in Q3 2012
  • Transportation & Storage activity was up 2.7% q/q and 13.3% y/y - the fastest annual rate of growth in series history
  • Accommodation & Food Services is up 3.6% q/q and 3% y/y
  • Other Services activity fell 2.7% q/q in Q3 2012 and posted zero growth in y/y terms.
So overall, poor showing in September, relatively strong Q3 overall y/y performance, but a clear slowdown in growth in q/q terms. A mixed bag suggesting Services sectors are looking for some catalyst, most likely on the side of exports restart.


Thursday, September 20, 2012

20/9/2012: 'Flat growth' and the shrinking Irish economy


Ok, folks... the latest batch of news from CSO and the official 'Green Jerseys' reaction to same would have made a fine candiate for a Nobel literature prize, were they published in a single tome with a heading Literature of Absurd on it...

We have our routine 'Housing market has bottomed out' shrills from the property pushers in the media - despite the fact that property prices continue to fall. We also have the metronome-like 'Unemployment has stabilized' tale, a chapter of gargantuan efforts to avoid mentioning the fact that fewer and fewer people actually work in Ireland, earning living and paying taxes.

Today we have a new pearl: 'Irish economy is growing once again, albeit slowly'.

Complete porkies, if you ask me. Here's the plain and simple reality of what's going on:

In constant market prices terms, Irish GDP based on constant factor cost (in other words, the real activity in the economy carried out by MNCs and domestic enterprises, net of taxes, gross of subsidies) grew 2.3% (+€819 mln) q/q in Q2 2012. Alas, as usual, q/q growth is... err... mostly meaningless. Instead, y/y comparative shows this metric shrinking €300mln (-0.8%).

What's the dynamic here? Oh, not good, either. In Q2 2011, y/y real GDP (constant factor basis) grew 3.21% y/y. In this quarter it shrunk 0.8% y/y... a negative growth swing of 4 percentage points!

Now, adding taxes (net of subsidies) to the above figure produces official real GDP (GDP expressed in constant prices terms). This stood at €40.327 billion in Q2 2012 up €744 mln on Q1 2012 (+1.9% q/q) but down 1.1% (-€442mln) y/y. Now, wait, folks... so official GDP is down y/y. Not up.

What's the dynamics of this change? Oh, well, in Q2 2011 official real GDP was up 2.86% on same period in 2010, so Irish economic growth has overall deteriorated in Q2 2012 compared to same period a year ago by a whooping 3.9 percentage points.

Next step is for us to subtract from our real GDP outflows of payments abroad (net of inflows of income from abroad) - the so-called Net Factor Income From the Rest of the World adjustment. Bear with me here. It is important.

In Q2 2012 we, as economy, have managed to send out €7.219 billion in factor payments abroad, net of what we received from abroad. Sounds a lot? Not really - this is down on €8.397bn in Q1 2012 (which added €1,178mln to our GNP) and it is down €1,385 mln on Q2 2011 (which adds same amount to our GNP compared to Q2 2011 levels).

What the above means? Here's the punchline to reality: as the result of €744mln increase in our GDP and a €1,178mln decrease in our payments abroad, our GNP officially expanded by €1.922bn in Q2 2012 q/q. Meanwhile, due to a contraction in real GDP of €442mln offset by reduction in outflows of income abroad of €1,385mln, our GNP rose €943mln (+2.9%) y/y in Q2 2012.

Thus, real economic activity in Ireland fell, y/y in Q2 2012, but because the MNCs have decided to expatriate less income out of Ireland in Q2 2012, our GNP actually rose.

Why would MNCs decide not to expatriate much of profits? For a number of reasons:

  1. Lack of capital investment around the world means corporates have no incentive to move profits out of Ireland outside the immediate objective of boosting reported profits at home;
  2. Booming equity markets in the US mean that there is no immediate pressure for US MNCs operating here to ship retained profits out of Ireland's tax heaven;
  3. Fall-off in pharma exports from Ireland also took a bite out of the retained profits here.
Any of these have any tangible effect on our real economy? Not really. Actually - none whatsoever. 

In real economic terms, Irish economy shrunk in Q2 2012 by 1.1% (real GDP terms) y/y and that is it, folks. 

One more note. In seasonally adjusted, constant prices terms:
  • Personal Consumption of Goods & Services has hit absolute record low in Q2 2012 of €19,598mln for any quarter since Q1 2007.
  • Net Expenditure by Central and Local Government on Current Goods and Services has hit an absolute low of €5,934mln in Q2 2012 for the entire period since Q1 2007.
  • Gross Domestic Fixed Capital Formation has hit a record low of €3,427mln
  • Exports of Goods and Services have posted a contraction on Q1 2012 but are up €1 billion on Q2 2011
  • Imports of Goods and Services have posted a q/q contraction of €1.7bn and are now at a historical low for any Q2 period of 2007-present period
  • Total domestic demand is now at the absolute lowest point for any quarter since Q1 2007 and is down €1.6bn on Q1 2012 and €1.9 billion on Q2 2011.
This is not flat growth, folks. This is shrinking real economy.

Note: I will post updated charts later tonight. Stay tuned.

Saturday, September 15, 2012

15/9/2012: Irish Services Activity July 2012


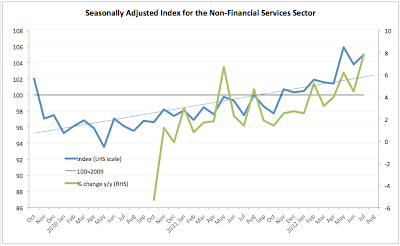
Recent release of the monthly Services sectors activity index for Ireland highlights the stabilizing nature of the current activity in the economy, since the end of Q1 2012. Here are some details:

Overall seasonally-adjusted monthly services activity rose 1.2% in July 2012 m/m and was up 7.8% y/y. Index 3mo MA through July is at 104.9 ahead of the 3mo MA through  March 2012 (101.6) and well ahead of 98.9 reading in 3mo to July 2011. Year on year increase of 7.8% is the strongest since November 2010. (Note: index is being compiled only since October 2010, so trend comparatives are against weak position. Index is set at 100=2009).

Here's the chart summarizing index levels and y/y growth rates:


By-sector activity:
  • Wholesale and Retail Trade (+3.4% m/m and +8.0% y/y), 
  • Business Services (+2.5% m/m and 3.1% y/y), 
  • Accommodation and Food Service Activities (+1.2% m/m and no change y/y) and 
  • Information and Communication (+0.1% m/m and +16.3 y/y) 
  • Transportation and Storage (-3.5% m/m and 8.0% y/y), and 
  • Other Services (-2.2% m/m and +0.9% y/y).

Chart to illustrate:


3mo MA through July 2012 are also encouraging:
  • Wholesale & Retail Trade at 109.7, up on 107.8 3 months ago and on 103.4 a year ago
  • Information & Communications at 112.9 well ahead of 109.4 in 3mo through April and on 99.6 recorded in 3 months through July 2011
  • Business Services at 103.3, strongly up on 98.4 in 3 months through April, but unchanged y/y
  • Transportation & Storage at 109.0, up on 104.0 in 3mo through April 2012 and on 98.2 a year ago
  • Accommodation and Food remain the lagging sector despite Government efforts to stimulate it at 89.0 in 3mo average through July 2012 slightly up on 87.1 in 3mo through April 2012 and down on 90.3 in 3mo through July 2011.
  • Other Services are also relatively flat, but with a slight upside at 74.3 in 3mo through July 2012 compared against previous 3mo average of 72.4 and 3mo through July 2011 average of 72.8.
Overall, some good news here and a continuation on the trend highlighted a month ago.

Saturday, August 18, 2012

18/8/2012: Irish Services Activity June 2012 & Q2 2012


Some interesting stats for Q2 2012 and June on Services sector activity in Ireland from CSO.

Headline stuff:

  • The seasonally adjusted monthly services value index declined 1.3% in June 2012 m/m and there was an annual increase of 5.6%.
  • Transportation and Storage (+4.6%), Other Services (+0.8%) and Accommodation and Food Service Activities (+0.1%) showed m/m increases in June 2012. 
  • Wholesale and Retail Trade (-3.4%), Information and Communication (-2.7%) and Business Services (-0.3%) showed m/m decreases.
  • Transportation and Storage (+14.7%), Information and Communication (+13.5%), Other Services (+4.5%) and Wholesale and Retail Trade (+3.2%) showed y/y increases in June 2012 when compared with June 2011. 
  • Accommodation and Food Service Activities (-2.0) and Business Services (-0.3%) showed y/y decreases.
  • Overall June monthly reading is the second highest in the series (since October 2009) with y/y growth in June at third highest since October 2010
Charts:


And Q2 2012 results (a bit more descriptive) are:
  • Overall Services Sector activity is up 2.6% in Q2 2012 compared to Q1 2012 and up 5.2% on Q2 2011 - solid results.
  • Wholesale & Retail Trade and repairs of vehicles & motorcycles services index is at 108.4 - up 0.5% q/q and 4/5% y/y, primarily driven by Wholesale Trade services (up 1.2% q/q and 10.7% y/y).
  • Information and Communication services index is up 2.2% q/q, and up 11.5% y/y in Q2 2012.
  • Business Services up 3.3% q/q, but down 0.5% y/y marking a third consecutive quarter of y/y contractions, albeit at much slower pace than -2.1% recorded in Q1 2012.
  • Transportation and Storage services were up 9.2% q/q and up 13.4% y/y in Q2 2012.
  • Accommodation and Food services were up 1.5% q/q, but down 2.6% y/y. Q2 2012 marked the fourth consecutive quarter of y/y contractions in the sub-index.
  • Other services posted a rise of 4% q/q and 1.6% y/y, breaking the 5 consecutive quarters of y/y declines.
So nicely solid results from the sector, albeit subject to some caveats due to the nature of the data series.

Thursday, June 7, 2012

7/6/2012: Irish Services PMI - May 2012


­­In the previous post (link here) I covered manufacturing PMI, showing a slight lift up in the growth rate from 50.1 in April (stagnant economy reading) to 51.2 in May (sluggish, but growth). More importantly, the 3mo average for March-May 2012 stood at 50.9 (weak expansion) compared to 48.9 average for December 2011-February 2012 (contraction).

Today’s Services PMI paints a weak picture in the other 48% of the private sectors economy in Ireland.

Headline Services PMI fell to 48.9 (contraction) in May from 52.2 in April. This marked the first month of sub-50 reading since January 2012. 12mo MA is at 51.2 and 3mo MA is at 51.1 in line with 12mo MA, slightly below 51.7 average for 2011.


This suggests that 5 months in 2012, growth conditions remain challenging. January-May 2012 average reading is 51.0, which, if sustained through 2012 will imply Services sectors growth of close to, but worse than a 2.15% real contraction in Services in 2011. Not exactly what I would call good news.

Of course, there are loads of various caveats to the above analysis, so don’t take it as some sort of a forecast.

New Business sub-index deteriorated from 52.7 in April to 49.6 in May, posting first usb-50 reading since January 2012. 12mo MA for the sub-index is now at 50.1, in effect implying that new business activity has been stagnant over the last 12 months. 3mo average is at 51.5 and the previous 3mo average was 50.2, some improvement on December-February period is still present. Good news, current 3mo average is ahead of same period averages for 2010 and 2011.


In line with broader indices, employment sub-index has fallen to 49.1 – returning to sub-50 level after March and April departures from the trend. Thus, 12mo MA for employment sub-index is now at 48.0 firmly signaling contraction in jobs in the sector. 3mo MA is at 50.3 owing to 51.9 spike in March, while previous 3mo average is 46.6. Current 3mo average and May level reading are both below the 3mo average for the same periods in 2011. 

Meanwhile, the giddy happiness signalled by the Services sector Confidence indicator bubbled up from 64.1 in April 2012 to 64.3 in May. The indicator runs on a silly scale well off the 50=neutral stance. Give you an example, in 2010, the indicator averaged around 66.7 and in 2011 it averaged 64.8. In both years, Irish Services sectors were, ahem… in a recession.


Output prices continued to fall, with the rate of decline accelerating to 44.4 from 44.9 between April and May. 3mo average through May is now at 45.4 and the previous 3mo average is 45.7. This marks continuation of below-50 readings in output prices since July 2008. Meanwhile, input costs rose at a faster pace (51.4) in May than in April (51.0), with 3mo average through May at 52.5, against previous 3mo average of 54.3.

Predictably, profitability was shot, again. Profitability sub-index fell to 45.8 in May from 47.5 in April.

More on profitability and employment in the following posts as usual.


Monday, May 7, 2012

7/5/2012: Analysis of April Irish PMIs (4): Profitability

This is the last post on April 2012 PMIs. In the first and the second posts, I covered headline index readings forManufacturing PMI and Services PMI for April 2012. In the third post, I looked at the Employment sub-indices for both sectors. This post will focus on profitability conditions, an index I derived from the PMI data.


April 2012 saw profit margins conditions deterioration slowing down in Services from -15.06 in march to -11.96 in April. 12mo MA is now at -15.9, shallower than the average deterioration in profit margins during the pre-crisis period (-17.8), but deeper than -14.7 average reading for the period since January 2008. Overall, -11.96 April 2012 reading is the slowest pace of profit margins deterioration recored since October 2010. 3mo MA is now at -13.8 and this marks a significant improvement on -19.8 deterioration for 3mo MA a year ago.


Manufacturing profitability index has moved from -24.84 in March 2012 to -22.86 in April 2012, marking the second sharpest decline since March 2011. 12mo MA is now at -17.1, while 3mo MA is at -23.3. This compares against pre-crisis average reading of -11.6 and January 2008-present average of -14.55.


So on the net, profitability conditions continue to deteriorate, but deterioration in Services is less pronounced and de-accelerating continuously compared to historic trends. Deterioration in Manufacturing profit margins continues unabated and is running well beyond historical averages.


The above suggests that while some positive momentum is possible for employment in Services sector, it is unlikely that profits conditions will support much of an employment uptick in Manufacturing.

7/5/2012: Analysis of April Irish PMIs (3): Employment

In the last two posts I covered headline index readings for Manufacturing PMI and Services PMI for April 2012. In this post, I am looking at the Employment sub-indices for both sectors.

Employment index rose to 52.9 in Manufacturing from 51.2 in March. The move is against 49.5 12mo MA and 50.0 average for Q1 2012, suggesting some expansion in Manufacturing employment. The change comes coincident with a decline in the rate of growth in overall sector PMI to 50.1 from 51.5 in March.

In Services, employment index declined to 50 from 51.9 in March 2012. The index 12mo MA is at 47.9 and Q1 average was 48.1. In contrast to Manufacturing, decline in Employment growth rate came against an improvement in PMI from 52.1 in March to 52.2 in April.


Short-term changes in the series, however, are pretty volatile. Chart below shows the counter-moves in the two sectors:


and the chart below plots relationship between Employment and Exports:


The good news is, March and April 2012 mark two consecutive months when exports expansions in both sectors led to above 50 readings in employment as well. Last time that happened on a monthly basis was in April 2011 and last time it happened in two consecutive months was in October 2007.

If sustained over the next 2-3 months, the trend might shift firmly to the upside.

7/5/2012: Analysis of April Irish PMIs (2): Core Services


Previous post dealt with the high level trends in Manufacturing PMI for Ireland. In this post we look at the core data for Services PMI.

Back in March, markit - the agency releasing Irish PMI data for NCB - headlined the changes in the Services index with a rather bombastic "Growth of Activity Sustained in March, and Optimism Hits a 22-month High". Of course, such was the booming time in Irish economy a month ago.

Fast forward one month to April and the headline remains bombastic: "Activity Growth Maintained in April as New Business Rises for Third Month Running"... Ok... so...

Headline PMI in Services (Business Activity index) improved from 52.1 in March to 52.2 in April, which is good news nominally, but statistically still indistinguishable from 50. Good thing is, the moving averages are a bit stronger along the just-above-50 trendline. 3mo MA is at 52.5, 12mo MA at 51.3, and 3mo MAs for 2011 and 2010 are all below the current running at 52.1 and 49.8 respectively. So business activity is indeed somewhat on the rise, albeit a very shallow rise.


Overall, headline Services Activity has been running on average above 50 since June 2009. Anyone noticed the boom, yet?

New Business Activity firmed up to 52.7 in April, from 52.1 in March, marking the third consecutive month of above 50 readings. 12mo MA is at 50.0 and 3mo MA is at 52.8, ahead of same period 3mo average in 2010 and 2011 (49.1 and 51.9, respectively). All, however, remain statistically indistinguishable from 50.


Again, trend pattern in New Business sub-index is identical to the pattern in overall Business Activity index - flat just above 50 since, roughly Q2 2011. The snapshot of more recent data illustrates, next.


Input-output prices are both moderating in trend, but input prices continue to expand, while output prices continue to post significant deflation. Profit margins, therefore, are shrinking more and more - the pattern that is running solidly since August 2009. More on this in future posts, however.


On core components of PMI: New Export Business growth moderated, but remained above waterline at 54.3 in April, down from 55.5 in March 2012. Both monthly readings were statistically significantly above 50, the same as in February. 12mo MA is now at 52.7 - barely statistically significantly above 50, while 3mo MA is at 55.0 - strong reading, ahead of 54.6 in 3mo through April 2011 and 52.8 reading for the same period of 2010.

As mentioned earlier, Profitability remained in the contraction territory, posting a reading of 47.5 in April, worse than 47.9 in March. Last time Profitability sub-index posted a reading above 50 was in December 2007.

Employment sub-index declined to 50.0 in April 2012, down from 51.9 in March 2012. 12mo MA is at 47.9 and 3mo average through April 2012 is at 49.9. This is virtually identical to 3mo MA through April 2011 which came in at 49.8 and is better than a rapid contraction-signaling 43.7 for the sub-index 3mo MA through April 2010.


Confidence slipped to 64.1in April 2012  from 70.4 in March. The series reading is now at 3mo low, but ahead of 12mo MA of 62.5. 3mo MA through April is very strong 67.1, while 3mo average through April 2011 was 66.5 and for 2010 period it was at 64.2. Overall, business confidence is relatively inflated indicator, as shown in the chart below. The indicator has relatively strong coincidental connection - in historical data - to the same period Business Activity index.


Overall, Services PMIs are showing stronger performance in the sector than in Manufacturing, but the numbers are more volatile and trending along the flatline. Business expectations continue to out-perform actual activity and exports orders, although this is hardly a new trend. With profitability severely constrained and actually deteriorating, I wonder if the 50+ readings in the last two months in Employment sub-index are credible.

Monday, March 26, 2012

26/3/2012: QNA Q4 2011 - Part 4

In the first post on QNA results for 2011 I covered data for annual GDP and GNP in constant prices terms. The second post focused on GDP/GNP gap and the cost of the ongoing Great Recession on the potential GDP and GNP. The third post focused on quarterly sectoral decomposition of GDP and GNP in constant prices terms. And a short digression from QNA results here showed how difficult it is, really, to reach any consensus on some of Ireland's economic performance parameters.

In this post, let's consider the decomposition of the GDP and GNP on the basis of expenditure lines, as measured in current market prices.

Headline numbers:

  • In Q4 2011 personal consumption of goods and services rose 0.9% qoq to €20,319mln, but declined 0.8% yoy. Compared with the same period of 2007 personal consumption is now dow 15.3%. YOY -0.8% contraction in Q4 2011 followed on 2.96% contraction in Q3 2011. In Q4 2011 personal consumption accounted for 52.45% of quarterly GDP, this is actually higher than the share of GDPit took in Q4 2007 (49.89%) - so much for 'unsustainable consumption binge' back at the peak of the Celtic Tiger period.
  • Q4 2011 net expenditure by central and local government stood at €5,991mln which was 5.1% down qoq and down 8.1% yoy. This follows on 2.32% contraction in yoy terms in Q3 2011. Relative to Q4 2007 net expenditure by central and local government now stands at -17.1%. However, the share of net government expenditure in overall GDP rose from 15.04% in Q4 2007 to 15.46% in Q4 2011.
  • Gross domestic capital formation at Q4 2011 stood at €3,923mln which was up 12.7% qoq, but down 1.9% yoy and the annual decline in Q4 2011 came in after an 18.3% contraction in Q3 2011. Fixed capital formation was down 66.8% in Q4 2011 compared to Q4 2007. In Q4 2007 gross fixed capital formation accounted for 24.56% of GDP, while inQ4 2011 this share fell to 10.13%.
Chart below illustrates the above changes


  • Exports of goods and services hit another historic record at €41,766mln in Q4 2011 - a rise of 0.4% qoq and 6.2% yoy. In Q3 2011 exports rose 1.7% yoy. Q4 2011 exports were 8.3% ahead of Q4 2007 and if in 2007 exports accounted for 80.24% of our GDP, in Q4 2011 this share was 107.8% of quarterly GDP. This is a remarkable performance.
  • Imports rose 0.4% in qoq terms to €332,904mln in Q4 2011. Q4 2011 imports are up also 0.4% yoy and this follows on a 0.35% contraction in Q3 2011. Relative to Q4 2007 imports are down 5.2%. Back in Q4 2007 imports stood at the level of 72.23% of quarterly GDP. In Q4 2011 this share was 84.93%.
  • Net trade surplus hit a record of €8,862mln - third consecutive quarterly record and third consecutive quarter with trade surpluses in excess of €8 billion. Trade surplus was up 0.3% qoq and 34.8% up yoy inQ4 2011, which comes on foot of a 10.60% yoy increase inQ3 2011. Stellar performance. In Q4 2011 trade surplus was 22.88% of GDP and this is up from 8.01% of Q4 2007 GDP. Compared to Q4 2007 trade surplus in Q4 2011 rose massive 130.2%.
  • Once again, trade figures confirm the simple reality that exports-led growth is not capable of sustaining economic recovery. Average quarterly trade surplus in 2007 stood at €4,295mln and 2005-2007 average quarterly trade surplus was €4,467mln. In 2009 average quarterly trade surplus rose to €6,234mln, followed by €7,467mln in 2010 and €8,408mln in 2011. In other words, Ireland experienced a massive exports boom for the last 3 years in a row, and yet we are continuing to remain in a recession.


  • GDP at current market prices stood at €38,743 in Q4 2011 which is 0.9 below Q3 2011, marking the second consecutive qoq decline, which is consistent with Ireland officially entering a new recession. 
  • GDP actually rose in yoy terms by 3.4% inQ4 2011 which comes on foot of a 0.79% contraction in Q3 2011. relative to Q4 2007, GDP in current market prices is now down 19.4%.
  • Net factor income from the rest of the world rose 10.8% qoq to -€9,017mln, which marks the first quarter since Q1 2010 when outflows of payments abroad exceeded trade surplus. This attests to the extreme levels of transfer pricing deployed by the MNCs in the Irish economy. Net factor income losses in Irish economy in Q4 2011 were up65.3% year on year, following a 19.5% rise in yoy terms in Q3 2011. Transfer payments abroad rose 28.3 on Q4 2007. Overall, an equivalent of some 23.27% of Irish GDP was paid out in factor payments to foreigners in Q4 2011 which is up from 14.62% in Q4 2007.
  • As the result, GNP fell to €30,051mln in Q4 2011 down 2.8% qoq marking the fifth consecutive quarter of qoq declines. Yoy, GNP in current market prices was down a massive 5.4% in Q4 2011 which comes on foot of an equally large 5.16% contraction in Q3 2011. These figures reflect deep recession continuing to ravage the Irish economy. It is incorrect to attribute the entire GNP to solely domestic activity as it includes net exports (trade balance) activity that is not expatriated abroad.
  • Overall, Irish GNP in current market price in Q4 2011 stood at 26.5% below the levels attained in Q4 2007. This means that more than 1/4 of the overall domestic and non-transfer pricing MNCs' activity has been wiped off the Irish national accounts during the current crisis.


The chart below highlights the evolution of transfers abroad relative to GDP, GNP and to trade balance. Transfers of income to the rest of the world from ireland has hit 101.75% of the trade surplus in Q4 2011 - rising above 100% for the first times since Q1 2010 when it stood at 101.80%. We are still well behind the levels of 2005-2009 when it averaged 138.74%. Which, given the negative sign with which transfers of income abroad enter the national accounts means that we have loads of room more for reductions in GNP on the back of 'exports recovery'.