Showing posts with label Irish GNP. Show all posts

Friday, July 4, 2014

4/7/2014: Q1 2014: GDP & GNP dynamics


In the previous posts I covered the revisions to our GDP and GNP introduced by the CSO and sectoral decomposition of GDP. The former sets out some caveats to reading into the new data and the latter shows that in Q1 2014, four out of five sectors of the economy posted increases in activity y/y. These are good numbers.

Now, let's consider GDP and GNP data at the aggregate levels.

First y/y comparatives based on Not Seasonally-Adjusted data:

  • GDP in constant prices came in at EUR44.445 billion in Q1  2014, which marks an increase of 4.14% y/y and the reversal of Q4 2013 y/y decline of 1.15%. 6mo average rate of growth (y/y) in GDP is now at 1.49% and 12mo average is at 1.14%. Over the last 12 months through Q1 2014, GDP expanded by a cumulative 1.13% compared to 12 months through Q1 2013.
  • Net Factor Income outflows from Ireland accelerated from EUR7.013 billion in Q1 2013 to EUR7.584 billion. Given the lack of global capes, this suggests that MNCs are booking more profit out of Ireland based on actual activity uplift here, rather than on transfers of previously booked profits. But that is a speculative conjecture. Still, rate of profits expatriation out of Ireland is lower in Q1 2014 than in Q1 2012, Q1 2011 and Q1 2010, which means that MNCs are still parking large amounts of retained profits here. When these are going to flow to overseas investment opportunities (e.g. if, say, Emerging Markets investment outlook improves in time, there will be bigger holes in irish national accounts).
  • GNP in content prices stood at EUR36.861 billion in Q1 2014, up 3.35% y/y and broadly in line with the average growth rate over the last three quarters. This marks the third consecutive quarter of growth in GNP. Over the last 6 months, GNP expanded by 2.98% on average and cumulative growth over the last 12 months compared to same period a year before is 2.67%.


Two charts to illustrate:


The above clearly shows that the GDP has been trending flat between Q2-Q3 2008 and Q1 2014, while the uplift from the recession period trough in Q4 2009 has been much more anaemic than in any period between 1997 and 2007.

The good news is that in Q1 2014, rates of growth in both GDP and GNP were above their respective averages for post-Q3 2010 period. Bad news is that these are still below the Q1 2001-Q4 2007 averages.

GNP/GDP gap has worsened in Q1 2014 to 17.1% from 16.4% in Q1 2013. The same happened to the private sector GNP/GDP gap which increased from 18.3% in Q1 2013 to 19.1% in Q1 2014. This implies that official statistics, based on GDP figures more severely over-estimate actual economic activity in Ireland in Q1 this year, compared to Q1 last.

Chart to illustrate:


Switching to Seasonally-Adjusted data for q/q comparatives:

  • GDP in constant prices terms grew by 2.67% q/q in Q1 2014, reversing a 0.08% decline in Q4 2013 and marking the first quarter of expansion. 6mo average growth rate q/q in GDP is now at 1.30% and 12mo at 1.26%. 
  • GNP in constant prices terms grew by 0.48% q/q in Q1 2014, a major slowdown on 2.24% growth in Q4 2013. Q1 2014 marked the third quarter of expansion, albeit at vastly slower rate of growth compared to both Q3 2013 and Q4 2013. 6mo average growth rate q/q in GNP is now at 1.36% and 12mo at 1.34%. 


Chart to illustrate:

Finally, let's re-time recessions post-revisions.

Red bars mark cases of consecutive two (or more) quarters of negative q/q growth in GDP and GNP:


4/7/2014: Q1 2014: Sectoral Growth Decomposition


In the previous post I covered the revisions to our GDP and GNP introduced by the CSO. Setting the caveats set out in this discussion aside, what are the core underlying dynamics in the National Accounts?

Let's deal with sectoral distribution of output, expressed in constant factor cost terms:

  • Agriculture, forestry & fishing sector output registered EUR1.042 billion in Q1 2014, which is up 11.2% on Q1 2013. Pricing effects contribute to the improvement which is now running at double digits y/y for three quarters consecutively. Compared to Q1 2011, output in this sector is up 15.3%, although activity remains below 2006-2007 average (some -6.5% lower).
  • Industry output is at EUR11.462 billion, which is 2.1% ahead of Q1 2013. This marks first quarter of increases and the pace of expansion is not exactly fast. Compared to Q1 2011 output in the Industry is up only 2.9% and compared to @006-2007 average it is down 9%.
  • Distribution, Transport, Software and Communication sector activity is at EUR9.775 billion in Q1 2014, up 8.0% y/y, marking the first quarter of increases after four consecutive quarters of y/y declines. The sector is down 2.5% on Q1 2011 and is -7.8% below 2006-2007 average.
  • Public Administration and Defence sector activity is at EUR1.495 billion in Q1 2014, down 2.0% y/y for 21st consecutive quarter of y/y decreases. The sector is now down 7% on Q1 2011 and 16.6% below activity in 2006-2007.
  • Other Services (including Rents) are up at EUR17.064 in Q1 2014, a rise of 3.9% y/y and marking 12th consecutive quarter of increases. Sector activity is now up 11% on Q1 2011 and is up 10.2% on 2006-2007 levels. All of this is down to MNCs operating in ICT services sector and much of the increase on 2006-2007 levels is accounted for by tax optimisation, not by real activity.
  • Within Industry, Building & Construction sub-sector posted EUR0.719 worth of activity in Q1 2014, which is 7.6% ahead of Q1 2013, marking a slowdown in the rate of growth from Q2-Q4 2013. The sub-sector now posted expansion over the last 6 consecutive quarters. Still, Q1 2014 activity is 4.8% behind Q1 2011 and is down 57.1% on 2006-2007 average.
  • Also within Industry, Transportable Goods Industries and Utilities sub-sector activity registered at EUR10.744 billion in Q1 2014 - an increase of 1.8% y/y and the first quarter of expansion. The sub-sector activity is now up 3.4% on Q1 2011 and is basically unchanged on 2006-2007 average.


So in the nutshell, only two sectors activity is currently running at above 2006-2007 average levels: Other Services (aka ICT Services MNCs) and Transportable Goods Industries & Utilities. All other sectors are running below 2006-2007 levels.

Charts below illustrate y/y growth rates in the sectors:


Tuesday, July 1, 2014

1/7/2014: Irish Manufacturing PMI: June 2014


June Manufacturing PMI for Ireland (released by Markit and Investec) posted a small gain, rising to 55.3 from 55.0 in May. 3mo MA is now at 55.5 and this is above the previous 3mo MA through March 2014 which stood at 53.7. 12mo MA is at 53.7 which implies that we have positive growth in manufacturing over the last 12 months. 3mo MA through June 2014 is above same period averages for 2010-2013.

Chart to summarise the series:


We are now on an upward trend from April 2013 and series are running above 50.0 marker thirteen months in a row:


And expansion remains statistically significant and well ahead of the 'recovery' period average:

All are good signals. Too bad Markit would not release more detailed sub-indices numbers, which prevents me from covering trends in Employment, Profit Margins and New Orders data.

One caveat: rate of improvement in June (m/m) was just 0.3 points, which is below 12mo average of 0.4 points and 3mo MA of m/m changes in the index are now -0.1 points, which is a slowdown on 3mo MA through March 2014 (+0.7 points) and on 3mo MA through June for 2013 and 2012.

Thursday, June 5, 2014

5/6/2014: Irish Manufacturing & Services PMIs: May 2014


Both, Irish Services and Manufacturing PMIs are now out for May 2014 (via Markit and Investec Ireland) and it is time to update my monthly, quarterly and composite series.

In this post, let's first cover the core components in monthly series terms:

  1. Manufacturing PMI eased from 56.1 in April to 55.0 in May - a decrease that reduced the implied estimated rate of growth in the sector. Still, Manufacturing index is reading above 50.0 (expansion line) continuously now since June 2013. 3mo MA through May is at 54.8 - solid expansion and is ahead of 3mo average through February which stood at 53.1. So expansion accelerated on 3mo MA basis. The current 3mo MA is ahead of 2010, 2011 and 2013 periods readings. Over the last 12 months there have been only 3 months with monthly reductions in PMIs: November 2013 (-2.5 points), January 2014 (-0.7 points) and May 2014 (-1.1 points).
  2. Services PMI eased only marginally from 61.9 in April to 61.7 in May - this implies that services sector growth barely registered a decline and remained at a blistering 61-62 reading level. Services index is reading above 50.0 (expansion line) continuously now since July 2012, helped no doubt by a massive expansion of ICT services MNCs in Ireland, which have little to do with the actual economic activity here. 3mo MA through May is at 60.0 - solid expansion and only slightly below 3mo average through February which stood at 60.3. The current 3mo MA is ahead of 2010, 2011 and 2013 periods readings. Over the last 12 months there have been 5 months with monthly reductions in PMIs, all sharper than the one registered in May 2014.
Here are two charts showing historical trends for the series:


The two series signal economic expansion across both sectors in contrast to May 2012 and 2013:

In line with the above chart, rolling correlations between the two PMIs have firmed up as well over recent months, rising from 0.33 in 3mo through February 2014 to 0.5 for the 3mo period through May 2014.

We will not have an update on Construction sector PMI (Markit & Ulster Bank) until mid-month, so here is the latest data as it stands:
  • In April 2014, Construction sector activity index rose to 63.5 from 60.2 in March 2014. This marks second consecutive month of m/m increases. In the last 12 months, there have been 7 monthly m/m rises in the index and index has been returning readings above 50 since September 2013.
Core takeaways:
  • Both services and manufacturing sectors PMIs are signaling solid growth in the economy,
  • Jointly, the two indices are co-trending well
  • Caveats as usual are: MNCs dominance in the indices dynamics and shorter duration of statistically significant readings above 50.0 line: Manufacturing shows only last three consecutive months with readings statistically significantly in growth territory; while Services index producing statistically significant readings above 50 for the last 6 months.
  • Last caveat - weak relationship remains between actual measured activity in the sectors and the PMI signals: http://trueeconomics.blogspot.ie/2014/05/1552014-pmis-and-actual-activity.html
Next post will cover quarterly data and composite PMI.

Thursday, May 8, 2014

8/5/2014: Irish Manufacturing & Services PMIs: April 2014

Irish Manufacturing and Services PMIs were out for April both showing aggregate gains, both not reported sufficiently in terms of data coverage to make any verifiable statements about composition of these gains.

Let's start from Manufacturing figures first:
  • April 2014 PMI reading was at 56.1 - which is well above statistically significant bound of expansion. 
  • 3mo MA through April is now at 54.8, some 1.9 points above 3mo MA reading though January 2014 and 5.5 points ahead y/y. Both good indicators of improving growth in the sector.


On Services side:
  • April 2014 PMI reading was at blistering 61.9 - which is strongly above statistically significant bound of expansion. 
  • 3mo MA through April is now at 60.0, basically flat on 3mo MA reading though January 2014 (60.13) and 2.8 points ahead y/y. Both good indicators of continued strong growth in the sector.


However, 3mo MA on 3mo MA changes are not spectacular in Services sector, as the chart below shows. This might simply be due to already sky-high readings attained in recent months.


Both indices show expansion in the economy (a changed from same period 2013) and as the chart below shows, correlation between the two indices is running strong (both co-move currently).


So based on top-level data, things are improving. The caveats are as usual:
  1. We have no idea what is happening on the underlying side of the above stats as Investec & Markit no longer make available sub-indices information
  2. Much of the PMIs-signalled activity is not coinciding with actual activity on the ground over the medium term (although some indications are that once we are firmly on growth trend path, the two sets of data - CSO and PMIs - will start comoving again).
In short, just as sell-side stockbrokers reports and Consumer Confidence Indicator, PMIs are least useful in telling the real story just when the demand for such story is most acute. 

Thursday, April 3, 2014

3/4/3014: In the eye of a growth hurricane? Irish National Accounts 2013


This is an unedited version of my Sunday Times article from March 23, 2014


Russian-Ukrainian writer, Nikolai Gogol, once quipped that "The longer and more carefully we look at a funny story, the sadder it becomes." Unfortunately, the converse does not hold. As the current Euro area and Irish economic misfortunes aptly illustrate, five and a half years of facing the crisis does little to improve one’s spirits or the prospects for change for the better.

At a recent international conference, framed by the Swiss Alps, the discussion about Europe's immediate future has been focused not on geopolitical risks or deep reforms of common governance and institutions, but on structural growth collapse in the euro area. Practically everyone - from Swedes to Italians, from Americans to Albanians - are concerned with a prospect of the common currency area heading into a deflationary spiral. The core fear is of a Japanese-styled monetary policy trap: zero interest rates, zero credit creation, and zero growth in consumption and investment. Even Germans are feeling the pressure and some senior advisers are now privately admitting the need for the ECB to develop unorthodox measures to increase private consumption and domestic investment. The ECB, predictably, remains defensively inactive, for the moment.


The Irish Government spent the last twelve months proclaiming to the world that our economy is outperforming the euro area in growth and other economic recovery indicators. To the chagrin of our political leaders, Ireland is also caught in this growth crisis. And it is threatening both, sustainability of our public finances and feasibility of many reforms still to be undertaken across the domestic economy.

Last week, the CSO published the quarterly national accounts for 2013. Last year, based on the preliminary figures, Irish economy posted a contraction of 0.34 percent, slightly better than a half-percent drop in euro area output. But for Ireland, getting worse more slowly is hardly a marker of achievement. When you strip out State spending, taxes and subsidies, Irish private sector activity was down by more than 0.48 percent - broadly in line with the euro area’s abysmal performance.

Beyond these headline numbers lay even more worrying trends.

Of all expenditure components of the national accounts, gross fixed capital formation yielded the only positive contribution to our GDP in 2013, rising by EUR 710 million compared to 2012. However, this increase came from an exceptionally low base, with investment flows over 2013 still down 28 percent on those recorded in 2009. Crucially, most, if not all, of the increase in investment over the last year was down to the recovery in Dublin residential and commercial property markets. In 2013, house sales in Dublin rose by more than EUR1.2 billion to around EUR3.6 billion. Commercial property investment activity rose more than three-fold in 2013 compared to previous year, adding some EUR1.24 billion to the investment accounts.

Meanwhile, Q4 2013 balance of payments statistics revealed weakness in more traditional sources of investment in Ireland as non-IFSC FDI fell by roughly one third on 2012 levels, down almost EUR6.3 billion. As the result, total balance on financial account collapsed from a surplus EUR987 million in 2012 to a deficit of EUR10 billion in 2013.

Put simply, stripping out commercial and residential property prices acceleration in Dublin, there is little real investment activity anywhere in the economy. Certainly not enough to get employment and domestic demand off their knees. And this dynamic is very similar to what we are witnessing across the euro area. In 2013, euro area gross fixed capital formation fell, year on year, in three quarters out of four, with Q4 2013 figures barely above Q4 2012 levels, up just 0.1 percent.

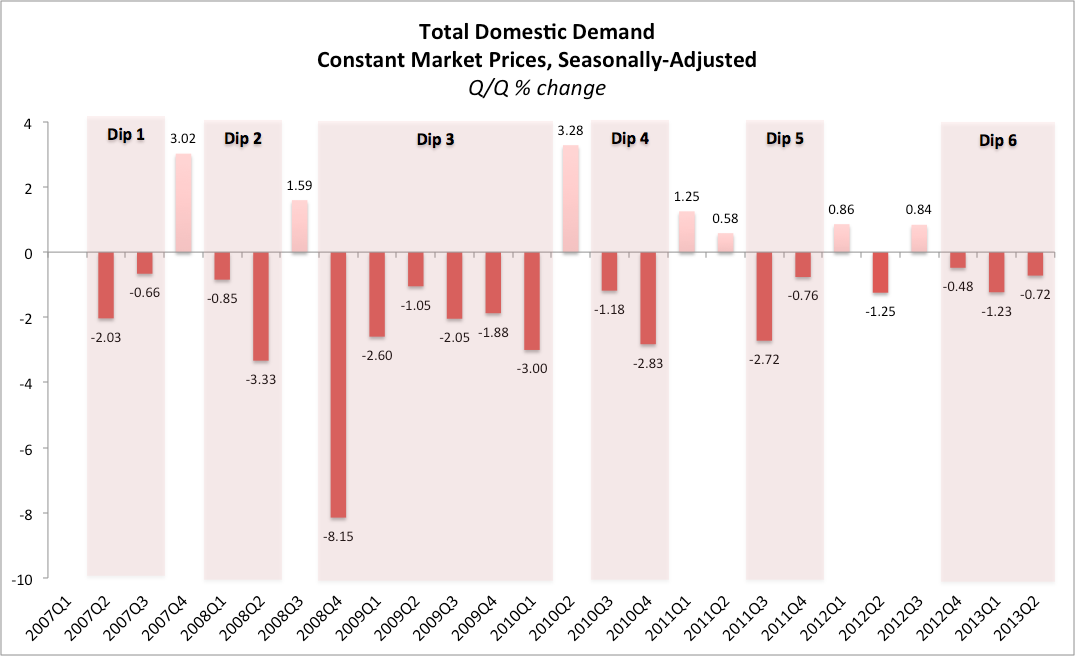
At the same time, demand continued to contract in Ireland. In real terms, personal consumption of goods and services was down EUR941 million in 2013 compared to previous year, while net expenditure by central and local government on current goods and services declined EUR135 million. These changes more than offset increases in investment, resulting in the final domestic demand falling EUR366 million year-on-year, almost exactly in line with the changes in GDP.

The retail sales are falling in value and growing in volume - a classic scenario that is consistent with deflation. In 2013, value of retail sales dropped 0.1 percent on 2012, while volume of retail sales rose 0.8 percent. Which suggests that price declines are still working through the tills - a picture not of a recovery but of stagnation at best. Year-on-year, harmonised index of consumer prices rose just 0.5 percent in Ireland in 2013 and in January-February annual inflation was averaging even less, down to 0.2 percent.

The effects of stagnant retail prices are being somewhat mitigated by the strong euro, which pushes down cost of imports. But the said blessing is a shock to the indigenous exporters. With euro at 1.39 to the dollar, 0.84 to pound sterling and 141 to Japanese yen, we are looking at constant pressures from the exchange rates to our overall exports competitiveness.

We all know that goods exports are heading South. In 2013 these were down 3.9 percent, which is a steeper contraction than the one registered in 2012. On the positive side, January data came in with a rise of 4% on January 2013, but much of this uplift was due to extremely poor performance recorded 12 months ago. Trouble is brewing in exports of services as well. In 2012, in real terms, Irish exports of services grew by 6.9 percent. In 2013 that rate declined to 3.9 percent. On the net, our total trade surplus fell by more than 2.7 percent last year.

Such pressures on the externally trading sectors can only be mitigated over the medium term by either continued deflation in prices or cuts to wages. Take your pick: the economy gets crushed by an income shock or it is hit by a spending shock or, more likely, both.

Irony has it some Irish analysts believe that absent the fall-off in the exports of pharmaceuticals (the so-called patent cliff effect), the rest of the economy is performing well. Reality is begging to differ: our decline in GDP is driven by the continued domestic economy's woes present across state spending and capital formation, to business capital expenditure, and households’ consumption and investment.


All of the above supports the proposition that we remain tied to the sickly fortunes of the growth-starved Eurozone. And all of the above suggests that our economic outlook and debt sustainability hopes are not getting any better in the short run.

From the long term fiscal sustainability point of view, even accounting for low cost of borrowing, Ireland needs growth of some 2.25-2.5 percent per annum in real terms to sustain our Government debt levels. These are reflected in the IMF forecasts from the end of 2010 through December 2013. Reducing unemployment and reversing emigration, repairing depleted households' finances and pensions will require even higher growth rates. But, since the official end of the Great Recession in 2010 our average annual rate of growth has been less than 0.66 percent per annum on GDP side and 1.17 percent per annum on GNP side. Over the same period final domestic demand (sum of current spending and investment in the private economy and by the government) has been shrinking, on average, at a rate of 1.47 percent per annum.

This implies that we are currently not on a growth path required to sustain fiscal and economic recoveries. Simple arithmetic based on the IMF analysis of Irish debt sustainability suggests that if 2010-2013 growth rates in nominal GDP prevail over 2014-2015 period, by the end of next year Irish Government debt levels can rise to above 129 percent of our GDP instead of falling to 121.9 percent projected by the IMF back in December last year. Our deficits can also exceed 2.9 percent of GDP penciled in by the Fund, reaching above 3 percent.

More ominously, we are now also subject to the competitiveness pressures arising from the euro valuations and dysfunctional monetary policy mechanics. Having sustained a major shock from the harmonised monetary policies in 1999-2007, Ireland is once again finding itself in the situation where short-term monetary policies in the EU are not suitable for our domestic economy needs.


All of this means that our policymakers should aim to effectively reduce deflationary pressures in the private sectors that are coming from weak domestic demand and the Euro area monetary policies. The only means to achieve this at our disposal include lowering taxes on income and capital gains linked to real investment, as opposed to property speculation. The Government will also need to continue pressuring savings in order to alleviate the problem of the dysfunctional banking sector and to reduce outflows of funds from productive private sector investment to property and Government bonds. Doing away with all tax incentives for investment in property, taxing more aggressively rents and shifting the burden of fiscal deficits off the shoulders of productive entrepreneurs and highly skilled employees should be the priority. Sadly, so far the consensus has been moving toward more populist tax cuts at the lower end of the earnings spectrum – where such cuts are less likely to stimulate growth in productive investment.

We knew this for years now but knowing is not the same thing as doing. Especially when it comes to the reforms that can prove unpopular with the voters.


Box-out: 

This week, Daniel Nouy, chairwoman of the European Central Bank's supervisory board, told the European Parliament that she intends to act quickly to force closure of the "zombie" banks - institutions that are unable to issue new credit due to legacy loans problems weighing on their balance sheets. Charged with leading the EU banks' supervision watchdog, Ms Nouy is currently overseeing the ECB's 1000-strong team of analysts carrying out the examination of the banks assets. As a part of the process of the ECB assuming supervision over the eurozone's banking sector, Frankfurt is expected to demand swift resolution, including closure, of the banks that are acting as a drag on the credit supply system. And Ms Nouy made it clear that she expects significant volume of banks closures in the next few years. While Irish banks are issuing new loans, overall they remain stuck in deleveraging mode. According to the latest data, our Pillar banks witnessed total loans to customers shrinking by more than EUR 21 billion (-10.3 percent) in 12 months through the end of September 2013. In a year through January 2014, loans to households across the entire domestic banking sector fell 4.1 percent, while loans to Irish resident non-financial corporations are down 5.8 percent. One can argue about what exactly will constitute a 'zombie' bank by Ms Nouy's definition, but it is hard to find a better group of candidates than Ireland's Three Pillars of Straw.


Wednesday, April 2, 2014

2/4/2014: Irish Manufacturing PMI: March 2014


We now have Manufacturing PMI for Ireland for Q1 2014, so here are couple updated charts:


Few notable things in the above:

  1. PMI now solidly above the 'statistical significance' range for the first time since October 2013. Also, March 2014 marks eighth consecutive month of PMI ahead of its post-crisis average (from January 2011).
  2. The post-crisis average is still lower than pre-crisis average.
  3. PMI continues to trend up with new short-term trend running from around June 2013.
  4. 12mo average is at solid 52.1 and 3mo average through March (Q1 2014) is at 53.7 which is basically identical to 3mo average through December 2013 (Q4 2013) which is 53.6. 
  5. Q1 2014 average is above same period reading for 2011 (49.8) and 2012 (50.1), but it is below same period 2010 average (56.1).
Key takeaway: solid PMI reading for Irish manufacturing - a good thing. As I noted before, Manufacturing PMI has stronger link to our GDP and actual industry output than Services PMI, so this is a net positive for the economy.

Thursday, March 13, 2014

13/3/2014: Domestic Demand 2013 - A Black Hole of Booming Confidence...


This is a third post on the 2013 national accounts.

Remember that boisterous claim by the Irish Government that our economy is growing at rates faster than the euro area average? Eurozone GDP down 0.4% y/y in 2013. It is down 0.65% in Ireland.

That was covered in previous posts here: http://trueeconomics.blogspot.ie/2014/03/1332014-gdp-down-gnp-up-as-2013.html and here: http://trueeconomics.blogspot.ie/2014/03/1332014-what-was-tanking-what-was.html

But aside from that, QNA also provides a look into the dynamics of domestic demand, which gives a much more accurate picture than GDP and GNP as to what is happening on the ground in the real economy.


Chart above shows y/y changes in domestic demand and its components.

Good news: Gross Fixed Capital Formation was up in 2013, rising EUR710 million y/y.

Bad news: everything else is down:

  • Personal Consumption down EUR941 million y/y in 2013 - a massive acceleration in decline compared to the drop of 'only' EUR229mln in 2011-2012.
  • Net local and central Government spending on current goods and services (so excluding capital investment) is down EUR135 million. I guess one might be tempted to say that is good, because it is an 'improvement' of sorts on a drop of EUR963 million in 2011-2012, but getting worse slower ain't exactly getting better…
  • Final domestic demand posted another year of contraction. In 2012 it was down EUR1.361 billion on 2011. Last year it shrunk EUR366 million on 2012.


In simple terms, domestic demand is now down every year since 2008 and 2013 levels of real domestic demand are down 18.4 percent on their 2008 levels. In 2013, final domestic demand was down 0.3%.


Personal consumption was down 1.15% y/y, net spending by Government on current goods and services was down 0.55% y/y, gorse fixed capital formation was up 4.15%. Something must have happened to all the confidence consumers were having throughout the year… or at lest conveying to the ESRI researchers...

In summary: there is no recovery in domestic economy. None. Which begs a question: what were all those jobs that we have 'created' in 2013 producing? We know that the 'farming jobs' added were generating output equivalent (on average) to EUR 9,900 per person. The rest? Maybe they were measuring confidence?

Chart below shows 2013 demand compared to 2010, 2011 and 2013 levels.


Good thing foreign investors and cash buyers are snapping those D4-D6 houses, because without them, the rest of the domestic economy is still shrinking…

13/3/2014: What was tanking, what was growing in Ireland in 2013?


Numbers may speak volumes, but a picture of two can really make the difference in understanding why the latest GDP and GNP figures for Ireland are so poor. So on foot of my more numbers-focused post (http://trueeconomics.blogspot.ie/2014/03/1332014-gdp-down-gnp-up-as-2013.html) here are two charts showing sources of changes in GDP and GNP.

Positive numbers imply positive contribution to GDP or GNP from the change in the specific sector/line output.

GDP first:


So largest increases in GDP are down to ICT services MNCs and taxes. Largest declines in GDP down to Industry (ex-construction) and Distribution Transport, Software and Communications.

GNP next:


So all of growth in GNP is down to lower expatriation of profits by MNCs and possible increases of inflows of income from abroad.

13/3/2014: GDP down, GNP up... as 2013 economic recovery goes up in a puff of statistical smoke


CSO released QNA for Q4 2013 and I will be blogging at length on the core results, so stay tuned.

Here is the release link: http://cso.ie/en/releasesandpublications/er/na/quarterlynationalaccountsquarter42013/#.UyGWmfTV9bs

And the key highlights:

Q4 2013: GDP down 2.3% q/q on seasonally-adjusted basis, in constant prices terms. This fully erased a 2.1% rise q/q recorded in Q3 2013, while 1.1% rise q/q in Q2 2013 was not enough to cover a decline of 1.4% in Q1 2013… Overall, annual figure fell (more on that below).

Since the official end of the Great Recession in Q1 2010, we had 9 quarters of rising GDP and 7 quarters of falling GDP.

As a result, constant market prices terms (2011 prices), GDP in Ireland now stands at EUR 162.303 billion, which is below 2011 and 2012 levels. Officially, there is no recession. Practically, GDP is shrinking.

The good news is that GNP is growing as MNCs are not expatriating profits from the land of transparent corporate taxation, so 2013 real GNP sits at EUR 137.476 billion, up strongly on EUR132.984 billion in 2012 and above the levels recorded in 2009-2011.

Decomposing the above aggregate changes:

Taxes less subsidies rose to EUR15.223 billion in 2013 from EUR14.811 billion, contributing EUR412 million to 'growth'. Taxes are snow back to levels just below 2010 which should make our trade unionists rejoice, somewhat.

Stripping out state capture of the economy, GDP at constant factor cost fell EUR965 million in 2013 compared to 2012 and is down on 2011 levels too (-EUR472 million). So much for the 'recovery', then…

Looking at sectors of economy:

  • Other Services, including rents (and including our hard working services MNCs) are up EUR1.958 billion in 2013 compared to 2012. This line of national income is now up to the levels just below those last seen in 2008. Much of this recovery, of course, is down to sales of ICT services around the world being booked into Dublin, but we shall deal with that aspect of our accounts separately.
  • Public Administration and defence is down EUR278 million y/y in 2013, and is now at the lowest level since 2008.
  • Distribution, Transport, Software and Communications sector is down EUR888 million to its lowest contribution level in any year of the crisis.
  • Building and construction sub-sector posted a rose in its contribution to GDP +EUR243 million in 2013 compared to 2012, and sector activity is up EUR52 million on 2011 levels, although it is still down EUR381 million on activity in 2011.
  • Industry, inclusive of building and construction is shrinking - presumably on foot of pharma sector woes. The sector in 2013 posted income of EUR39.341 billion, down EUR1.339 billion on 2012, down EUR1.664 billion on 2011 and down EUR724 million on 2010. In 2013, we have hit an absolute low in Industry sector despite some pick up in construction for any year of the crisis.
  • Remember 25,000 new farmers added in 2013 to our 'employment' figures? Well, they are working hard. Or rather prices inflation is working very hard in the sector. Agriculture, Forestry and Fishing sector generated increase in activity in 2013 of EUR237 million, which partially offset the decline in the sector fortunes in 2012. Still, 2013 levels of activity are EUR258 million behind 2011 levels and EUR316 million behind 2010 levels. The sector contribution to GDP in 2013 was the second lowest for the entire crisis period.


So here we go… recovery then… negative GDP growth (due to industry, distribution, transport, software and communications, and government activities shrinking, only partially offset by growth in other services, construction and agriculture, and rising taxes net of subsidies). Oh, and 25,000 new farmers adding on average ca EUR9,500 per person in annual output to the economy (remember - they are all gainfully employed, right?)...

Monday, February 10, 2014

10/2/2014: Irish Services & Manufacturing PMI, January 2014


While on the topic of PMIs (see Construction PMIs update here: http://trueeconomics.blogspot.ie/2014/02/1022014-ulster-bank-construction-pmis.html), let's update also Manufacturing and Services PMIs data.

Services:

  • January Services PMI index slipped slightly to 61.5 from 61.8 in December 2013. The deterioration was not material from statistical point of view, so the index remains effectively at the high level for the last 12 months.
  • 3mo MA through January 2014 was 60.1 - above 56.2 in the same period through January 2013, and ahead of 3mo MA through November 2013. This is good news as it allows for some correction in monthly series volatility.
  • The series are above their crisis-period trend and are still trending up.
  • The index is now above 50.0 since August 2012 - a solid performance, with the rates of growth being on average above 60.0 since at least July 2013.


Manufacturing: 

  • January Manufacturing PMI index also moderated to 52.8 from 53.5 in December 2013, with this moderation being significant, albeit shallow.
  • On a 3mo MA average, index is at 52.9, which is ahead of 51.4 in the same period of 2013 and is ahead of the 3mo MA through November 2013.
  • The index readings have rested above 50.0 nominally since June 2013, although they are significantly (statistically) above 50.0 for a shorter period of time, from somewhere around September 2013.


Overall, January posted slowdown in both indices growth, and 3mo MA for growth rates in the index is now negative for Manufacturing, and moderately positive for Services.


Longer-range good news is highlighted in the next chart, showing that in January 2014, levels of two PMIs were consistent with expansion across both sectors, contrasting the situation in January 2012 and January 2013.


Top level conclusion: The numbers show a good start to 2014, but Manufacturing remains a weaker point for the economy. Given monthly volatility in the indices, we need to see more data from PMIs to call the 2014 trends


As usual, the caveats apply: I have no data on sub-components of both PMIs - the core information that is no longer being made public by Investec and Markit (the publishers of the two series). Unfortunately, this means I no longer cover the two organisations' analysis of the components as these are unverifiable and statistically no longer testable.

Thursday, January 2, 2014

2/1/2014: Manufacturing PMI for Ireland: December 2013

Manufacturing PMI is out for Ireland today, per Markit/Investec release: "The Irish manufacturing sector ended 2013 on a positive note as growth of output and new orders gained momentum in December. Meanwhile, the current sequence of job creation was extended to seven months. On the price front, input cost inflation picked up slightly while firms raised their output prices for the fourth month running."

Please note: since Markit/Investec no longer release actual numbers for subindices (e.g. employment or orders or export orders, etc), we have to take these claims on faith. For example, the release claims increased export orders from China as one of the drivers of the new business improvement. Yet Irish exports to China are low and it is hard to see how this source of uplift can register as a driver in the overall data, unless the survey participation is severely skewed toward some specific MNCs with remaining significant exposure to exports to China.

Note: Good exports to China from Ireland in January-October 2013 stood at a miserly EUR1.642 billion, down from EUR1.885 billion recorded in the same period of 2012 and representing just 2.26% of our total goods exports in January-October 2013.

Further per release: "The seasonally adjusted Investec Purchasing Managers‟ Index® (PMI®) – an indicator designed to provide a single-figure measure of the health of the manufacturing industry – rose to 53.5 in December from 52.4 in November. This signalled a solid improvement in business conditions, and the seventh in as many months."

The last claim is a matter of interpretation. 1.1 points gain in the PMI reading is the 4th largest in 12 months of 2013 and 7th largest in the last 24 months. However, the index reading in December is the 2nd highest in 2013 and the 3rd highest over the last 2 years, which is, undoubtedly, a good thing.

Two charts and dynamic trends to illustrate headline index changes:


In terms of overall PMI, Manufacturing activity averaged at 51.1 over the last 12 months, so the current reading is above that. However, December reading is below the 3mo average for November-December 2013 which stands at 53.6.

Q1 2013 average PMI for Manufacturing was 50.13, and this fell to 49.33 in Q2 2013, before rising to 51.9 in Q3 2013 and to a healthy 53.6 in Q4 2013.

Overall, we are now into third consecutive month with the PMI for Manufacturing index statistically above 50.0. Another good thing.


Full Markit/Investec release is here: http://www.markiteconomics.com/Survey/PressRelease.mvc/119915a961bd40caa4218d77234245e2

Saturday, December 7, 2013

7/12/2013: Global Manufacturing PMIs: Summary for October-November


In previous posts I covered PMIs for Ireland for both services and manufacturing: http://trueeconomics.blogspot.ie/2013/12/5122013-services-and-manufacturing-pmis.html Also, detailed PMIs coverage is linked in the above.

Here is a neat summary of global Manufacturing PMIs via Markit:


Thursday, December 5, 2013

5/12/2013: Services and Manufacturing PMIs for Ireland: November 2013


Yesterday, Markit and Investec released the second set of Purchasing Managers' Indices (PMIs) for Ireland covering Services sector. As usual, here is the analysis of combined Manufacturing and Services PMIs.

Detailed analysis of Manufacturing PMIs was covered here: http://trueeconomics.blogspot.ie/2013/12/2122013-manufacturing-pmi-for-ireland.html. Also, note, I covered actual services activity index (latest data through October) here: http://trueeconomics.blogspot.ie/2013/12/5122013-irish-services-index-october.html

Manufacturing PMIs in November 2013:
- Slipped to 52.4 (still in expansionary territory) from 54.9 in September.
- 3mo Average through August 2013 was 52.1 against 3mo average through November 2013 at 53.3.
- 6mo average through November 2013 is up 4.6% on previous.

Services PMIs in November 2013:
- Slipped to 57.1 from 60.1 in October.
- 3mo average for the period through August 2013 was at 55.4 and 3mo average through November is at 58.0
- 6mo average is up 6.6% on previous.

Both, Manufacturing and Services PMIs are now above 50 for 6 consecutive months. In statical terms, the two PMIs are above 50.0 for 6 months for Services and 3 months for Manufacturing.


Overall, the picture is consistent with upward sub-trend over 3 months for both series.

However, changes in 3mo averages warrant caution on sustainability:


Joint evolution of the series y/y is still encouraging:


And 24-months rolling correlation between series is rising once again - currently at 0.340, the highest since December 2011 when both series were in sub-50 territory.

So net is that the PMIs are still strong, trend is still upward and the short-run uplift continues. Big question is whether this is going to translate into real activity on the ground or mark another period of booming PMIs and stagnant economy. Time will tell...


Monday, December 2, 2013

2/12/2013: Manufacturing PMI for Ireland: November 2013


Manufacturing PMI for November released by market and Investec today shows slight slowdown in the rate of manufacturing sector expansion in Ireland.

Overall PMI declined from blistering 54.9 in October to more moderate and sustainable 52.4 in November. October reading was remarkable as it was the highest PMI reading posted since 56.0 was recorded in April 2011. Thus, some moderation was expected.

November reading pushed 12mo MA to 51.1, implying that on average Irish manufacturing was expanding over the last 12 months. 6mo MA is at 52.2 and 3mo MA is 53.3 through November, up on 51.1 3mo average through August 2013. Current 3mo average is ahead of that for 2010, 2011 and 2012. even setting October reading at 3mo MA level through September still leaves the average ahead of 2010-2012.

Current reading remains in statistically significant territory - another added positive.

Aside from that, no comment is possible, since Investec and Markit are continuing not to release underlying sub-indices.


With the above we can now confirm a new upward sub-trend from May 2013. Let's hope it will continue.


Monday, November 11, 2013

11/11/2013: Services and Manufacturing PMIs for Ireland: October 2013


With some delay, let's update the data on Irish PMIs.

Before we do, quick explanation for a delay - I used to be on the mailing list for Investec releases to PMIs for years (way before the organisation became a part of Investec). This all ended some months back when I was struck off the mailing list. Presumably, being a columnist with 2 publications & blogger, who always and regularly cites PMIs and Investec as their publisher, is just not enough to earn one the privilege of being sent the release. Oh, well…

Now to numbers… 

Services PMI hit 60.1 in October, up on 56.8 in September, marking the second highest reading since January 2007 (the highest was recorded in August this year at 61.6). This is a strong return. 3mo average for the period August - October 2012 was 53.9, current run is 59.5, so the distance y/y is 10.4% - statistically significant. 

Notably, from January 2010 through current, the average deviation of PMI from 50.0 is 2.5, so we are solidly above the average.

Quarterly averages are also strong. Q1 2013 posted 54.23 and Q2 2013 was at 54.27, but Q3 2013 came in at 58.67. And we are now running well ahead of that.

With full-sample standard deviation of the PMI reading distance to 50.0 at 7.3  (same for the period from January 2008 through current being 6.84), we are now solidly in statistically significant territory for expansion since July 2013.

Manufacturing PMI also strengthened, although by much less than Services. Manufacturing PMI hit 54.9 in October, up on 52.7 in September and 3mo average through October 2013 is at 53.2, which is 3.% ahead of the 3mo MA through October 2012.

Quarterly averages are signalling weaker growth, however. Q1 2013 was at 50.1 (basically, zero growth in statistical terms), while Q2 2013 stood at 49.3 (same - zero growth in statistical terms). Q3 2013 came in at 51.3 and the October reading is ahead of this. In fact, October 2013 reading is the highest since April 2011. October reading is statistically significant, based on historical data, but it is not statistically significantly different from 50 on the basis of data from January 2008.


The above shows one thing: we are above historical and 2008-present averages for both Manufacturing and Services PMIs (good news). Below chart confirms relatively strong performance for the series on 3mo MA basis (good news):


As chart below shows, there is a third good news bit: both series have now broken away from their asymptotic trend, with Manufacturing at last showing some life.


Note to caveat the above. As I showed before, both manufacturing and services PMIs have relatively weak relation to actual GDP and GNP growth, with Manufacturing PMI being, predictably, better anchored to real growth here. Details here: http://trueeconomics.blogspot.ie/2013/10/3102013-irish-pmis-are-they-meaningful.html

Thursday, October 3, 2013

3/10/2013: Irish PMIs - are they meaningful?


Having covered Services and Manufacturing PMIs (see links here: http://trueeconomics.blogspot.ie/2013/10/3102013-services-and-manufacturing-pmis.html) in terms of Q3 2013 averages, let's have a reminder as to the links to actual growth in Irish GDP and GNP these series have.

Two charts covering through Q2 2013:


Thus, overall:

  • Changes q/q in Manufacturing PMIs have only a weak correlation with actual real (constant prices) GDP and GNP changes q/q: R-squares of just 35.6% and 29.4% respectively when we remove the constant factor (which is not significant by itself at any rate). This is weak to say the least.
  • Changes q/q in Services PMIs have only a very weak correlation with actual real (constant prices) GDP and GNP changes q/q: R-squares of just 16.4% and 17.6% respectively when we remove the constant factor (which is significant). This is very poor.
  • With positive intercepts of 0.0023 for GDP and 0.0024 for GNP, the Services PMI R-square rises to 23.7% for GDP and 22.7% for GNP. Once again, no change to the above conclusion.
The above suggests that a significant component of both PMIs come from transfer pricing and not real economic activity on the ground. Or put differently, the PMIs are not that exceptionally meaningful indicators of actual levels of activity in the economy and are only weakly-significant in indicating the direction of that activity. 

Note: this is quarterly averages data, not much more volatile data based on monthly series. Which puts to question monthly movements in PMIs even more...

3/10/2013: Services and Manufacturing PMIs for Ireland: September 2013


In the previous posts I covered separately both Service PMI for Ireland and Manufacturing PMI (released by Markit & Investec). As noted, both series show strong performance in September. Here is the combined analysis:

Both Services and Manufacturing PMIs are now above their historical crisis-period averages. Manufacturing PMI is slightly ahead (0.1 points) of its historical pre-crisis average since May 2000 when both series start running coincidently. Services PMI is now slightly below its historical pre-crisis average.

Services PMI have broken out of the flat trend and are now trending up for the last 12 months. However, Manufacturing PMI continues to move side-ways, although on average remaining positive.


Two major points: September 2013 reading puts both indices at statistically significant levels above 50.0, which is the first such occurrence since February 2011:


In addition, we are seeing stronger positive correlation between the two indices (the 12mo rolling correlation below is only indicative) established since February 2013 low:


In other words, both sides of the economy are now performing better, but we need this momentum to be sustained over 2-3 months to see serious feed-through into actual economic activity figures.

Tuesday, October 1, 2013

1/10/2013: Irish Manufacturing PMI: September 2013


Some good readings from Irish Manufacturing PMI (Investec-sponsored Markit data) for September:

  • Headline PMI is at 52.7 up on 52.0 in August and the highest reading since 53.9 in July 2012.
  • Critically, this appears to be the first statistically significant reading above 50.0 since November 2012.
  • I use 'appears' above since we have no formal analysis from Markit on this (Investec don't do analysis). The distribution is Laplace. August reading was close to being statistically significant.
  • In terms of trend, Q1 2013 average reading was 50.13, Q2 2013 at 49.33, Q3 now reads 51.9. 
  • 12mo MA is at 50.8.
  • 3mo MA through September 2013 is at 51.9, which is below the same period 2012 (52.2), but ahead of 2011 (49.2) and slightly ahead of 2010 (50.4).

Now, it appears we have broken the downward trend at last. Index volatility (36mo rolling) has fallen slightly to around 2.3 in terms of 3mo average through September, which is close to historical average of 2.4 and is well below the crisis-period average of 3.4. Positive skew on change is at 3mo average of +0.75 (for deviations from 50.0) and this contrasts with a negative -0.34 skew for historical data and -0.25 skew for crisis period data. So let's call it a trend reversal for the short term:


Sadly, nothing else to report, since Investec/Markit continue to push out data-less releases. Wish I could tell you about employment, exports orders, total orders... but there is not a single number in the press release, only comments.

Friday, September 20, 2013

20/9/2013: Domestic Economy: Continuing Its Sextuplet Dip in Q2 2013

Total Domestic Demand is defined as :

  • Consumer Spending on goods and services + 
  • Government Spending on Current (as opposed to capital) goods and services + 
  • Gross Fixed Capital Formation (basically gross investment) + 
  • Change in Stocks of goods and services in the economy. 

In a more old-fashioned way, it is Investment + Consumption + Net Government Spending.

Put differently, this is the domestic economy (excluding exports net of imports, and outflows of income to the rest of the world net of inflows of income from the rest of the world).

Now, here are the quarterly changes in the domestic economy from 2007 on, for real (constant prices) seasonally adjusted series:


I define 'dips' in the above series similar to the official definition of a recession: two consecutive q/q downward movements. Remember, we have been told since Q2 2010 that the Irish economy has 'stabilised' and even 'returned to growth'. Since then we had: eight quarters of contraction and four quarters of growth in Total Domestic Demand.

The two core drivers downward in the domestic economy on q/q basis are:

On the good news side, q/q increase in Personal Consumption component (above) and external trade (below):

And external trade showing strong performance on q/q basis, which, alas, only partially offsetting the decline recorded in Q1 2013...


And this concludes my analysis of the QNA for Q2 2013.