Showing posts with label Irish GDP. Show all posts

Monday, February 10, 2014

10/2/2014: Irish Services & Manufacturing PMI, January 2014


While on the topic of PMIs (see Construction PMIs update here: http://trueeconomics.blogspot.ie/2014/02/1022014-ulster-bank-construction-pmis.html), let's update also Manufacturing and Services PMIs data.

Services:

  • January Services PMI index slipped slightly to 61.5 from 61.8 in December 2013. The deterioration was not material from statistical point of view, so the index remains effectively at the high level for the last 12 months.
  • 3mo MA through January 2014 was 60.1 - above 56.2 in the same period through January 2013, and ahead of 3mo MA through November 2013. This is good news as it allows for some correction in monthly series volatility.
  • The series are above their crisis-period trend and are still trending up.
  • The index is now above 50.0 since August 2012 - a solid performance, with the rates of growth being on average above 60.0 since at least July 2013.


Manufacturing: 

  • January Manufacturing PMI index also moderated to 52.8 from 53.5 in December 2013, with this moderation being significant, albeit shallow.
  • On a 3mo MA average, index is at 52.9, which is ahead of 51.4 in the same period of 2013 and is ahead of the 3mo MA through November 2013.
  • The index readings have rested above 50.0 nominally since June 2013, although they are significantly (statistically) above 50.0 for a shorter period of time, from somewhere around September 2013.


Overall, January posted slowdown in both indices growth, and 3mo MA for growth rates in the index is now negative for Manufacturing, and moderately positive for Services.


Longer-range good news is highlighted in the next chart, showing that in January 2014, levels of two PMIs were consistent with expansion across both sectors, contrasting the situation in January 2012 and January 2013.


Top level conclusion: The numbers show a good start to 2014, but Manufacturing remains a weaker point for the economy. Given monthly volatility in the indices, we need to see more data from PMIs to call the 2014 trends


As usual, the caveats apply: I have no data on sub-components of both PMIs - the core information that is no longer being made public by Investec and Markit (the publishers of the two series). Unfortunately, this means I no longer cover the two organisations' analysis of the components as these are unverifiable and statistically no longer testable.

Thursday, January 2, 2014

2/1/2014: Manufacturing PMI for Ireland: December 2013

Manufacturing PMI is out for Ireland today, per Markit/Investec release: "The Irish manufacturing sector ended 2013 on a positive note as growth of output and new orders gained momentum in December. Meanwhile, the current sequence of job creation was extended to seven months. On the price front, input cost inflation picked up slightly while firms raised their output prices for the fourth month running."

Please note: since Markit/Investec no longer release actual numbers for subindices (e.g. employment or orders or export orders, etc), we have to take these claims on faith. For example, the release claims increased export orders from China as one of the drivers of the new business improvement. Yet Irish exports to China are low and it is hard to see how this source of uplift can register as a driver in the overall data, unless the survey participation is severely skewed toward some specific MNCs with remaining significant exposure to exports to China.

Note: Good exports to China from Ireland in January-October 2013 stood at a miserly EUR1.642 billion, down from EUR1.885 billion recorded in the same period of 2012 and representing just 2.26% of our total goods exports in January-October 2013.

Further per release: "The seasonally adjusted Investec Purchasing Managers‟ Index® (PMI®) – an indicator designed to provide a single-figure measure of the health of the manufacturing industry – rose to 53.5 in December from 52.4 in November. This signalled a solid improvement in business conditions, and the seventh in as many months."

The last claim is a matter of interpretation. 1.1 points gain in the PMI reading is the 4th largest in 12 months of 2013 and 7th largest in the last 24 months. However, the index reading in December is the 2nd highest in 2013 and the 3rd highest over the last 2 years, which is, undoubtedly, a good thing.

Two charts and dynamic trends to illustrate headline index changes:


In terms of overall PMI, Manufacturing activity averaged at 51.1 over the last 12 months, so the current reading is above that. However, December reading is below the 3mo average for November-December 2013 which stands at 53.6.

Q1 2013 average PMI for Manufacturing was 50.13, and this fell to 49.33 in Q2 2013, before rising to 51.9 in Q3 2013 and to a healthy 53.6 in Q4 2013.

Overall, we are now into third consecutive month with the PMI for Manufacturing index statistically above 50.0. Another good thing.


Full Markit/Investec release is here: http://www.markiteconomics.com/Survey/PressRelease.mvc/119915a961bd40caa4218d77234245e2

Saturday, December 7, 2013

7/12/2013: Global Manufacturing PMIs: Summary for October-November


In previous posts I covered PMIs for Ireland for both services and manufacturing: http://trueeconomics.blogspot.ie/2013/12/5122013-services-and-manufacturing-pmis.html Also, detailed PMIs coverage is linked in the above.

Here is a neat summary of global Manufacturing PMIs via Markit:


Thursday, December 5, 2013

5/12/2013: Services and Manufacturing PMIs for Ireland: November 2013


Yesterday, Markit and Investec released the second set of Purchasing Managers' Indices (PMIs) for Ireland covering Services sector. As usual, here is the analysis of combined Manufacturing and Services PMIs.

Detailed analysis of Manufacturing PMIs was covered here: http://trueeconomics.blogspot.ie/2013/12/2122013-manufacturing-pmi-for-ireland.html. Also, note, I covered actual services activity index (latest data through October) here: http://trueeconomics.blogspot.ie/2013/12/5122013-irish-services-index-october.html

Manufacturing PMIs in November 2013:
- Slipped to 52.4 (still in expansionary territory) from 54.9 in September.
- 3mo Average through August 2013 was 52.1 against 3mo average through November 2013 at 53.3.
- 6mo average through November 2013 is up 4.6% on previous.

Services PMIs in November 2013:
- Slipped to 57.1 from 60.1 in October.
- 3mo average for the period through August 2013 was at 55.4 and 3mo average through November is at 58.0
- 6mo average is up 6.6% on previous.

Both, Manufacturing and Services PMIs are now above 50 for 6 consecutive months. In statical terms, the two PMIs are above 50.0 for 6 months for Services and 3 months for Manufacturing.


Overall, the picture is consistent with upward sub-trend over 3 months for both series.

However, changes in 3mo averages warrant caution on sustainability:


Joint evolution of the series y/y is still encouraging:


And 24-months rolling correlation between series is rising once again - currently at 0.340, the highest since December 2011 when both series were in sub-50 territory.

So net is that the PMIs are still strong, trend is still upward and the short-run uplift continues. Big question is whether this is going to translate into real activity on the ground or mark another period of booming PMIs and stagnant economy. Time will tell...


Monday, December 2, 2013

2/12/2013: Manufacturing PMI for Ireland: November 2013


Manufacturing PMI for November released by market and Investec today shows slight slowdown in the rate of manufacturing sector expansion in Ireland.

Overall PMI declined from blistering 54.9 in October to more moderate and sustainable 52.4 in November. October reading was remarkable as it was the highest PMI reading posted since 56.0 was recorded in April 2011. Thus, some moderation was expected.

November reading pushed 12mo MA to 51.1, implying that on average Irish manufacturing was expanding over the last 12 months. 6mo MA is at 52.2 and 3mo MA is 53.3 through November, up on 51.1 3mo average through August 2013. Current 3mo average is ahead of that for 2010, 2011 and 2012. even setting October reading at 3mo MA level through September still leaves the average ahead of 2010-2012.

Current reading remains in statistically significant territory - another added positive.

Aside from that, no comment is possible, since Investec and Markit are continuing not to release underlying sub-indices.


With the above we can now confirm a new upward sub-trend from May 2013. Let's hope it will continue.


Monday, November 11, 2013

11/11/2013: Services and Manufacturing PMIs for Ireland: October 2013


With some delay, let's update the data on Irish PMIs.

Before we do, quick explanation for a delay - I used to be on the mailing list for Investec releases to PMIs for years (way before the organisation became a part of Investec). This all ended some months back when I was struck off the mailing list. Presumably, being a columnist with 2 publications & blogger, who always and regularly cites PMIs and Investec as their publisher, is just not enough to earn one the privilege of being sent the release. Oh, well…

Now to numbers… 

Services PMI hit 60.1 in October, up on 56.8 in September, marking the second highest reading since January 2007 (the highest was recorded in August this year at 61.6). This is a strong return. 3mo average for the period August - October 2012 was 53.9, current run is 59.5, so the distance y/y is 10.4% - statistically significant. 

Notably, from January 2010 through current, the average deviation of PMI from 50.0 is 2.5, so we are solidly above the average.

Quarterly averages are also strong. Q1 2013 posted 54.23 and Q2 2013 was at 54.27, but Q3 2013 came in at 58.67. And we are now running well ahead of that.

With full-sample standard deviation of the PMI reading distance to 50.0 at 7.3  (same for the period from January 2008 through current being 6.84), we are now solidly in statistically significant territory for expansion since July 2013.

Manufacturing PMI also strengthened, although by much less than Services. Manufacturing PMI hit 54.9 in October, up on 52.7 in September and 3mo average through October 2013 is at 53.2, which is 3.% ahead of the 3mo MA through October 2012.

Quarterly averages are signalling weaker growth, however. Q1 2013 was at 50.1 (basically, zero growth in statistical terms), while Q2 2013 stood at 49.3 (same - zero growth in statistical terms). Q3 2013 came in at 51.3 and the October reading is ahead of this. In fact, October 2013 reading is the highest since April 2011. October reading is statistically significant, based on historical data, but it is not statistically significantly different from 50 on the basis of data from January 2008.


The above shows one thing: we are above historical and 2008-present averages for both Manufacturing and Services PMIs (good news). Below chart confirms relatively strong performance for the series on 3mo MA basis (good news):


As chart below shows, there is a third good news bit: both series have now broken away from their asymptotic trend, with Manufacturing at last showing some life.


Note to caveat the above. As I showed before, both manufacturing and services PMIs have relatively weak relation to actual GDP and GNP growth, with Manufacturing PMI being, predictably, better anchored to real growth here. Details here: http://trueeconomics.blogspot.ie/2013/10/3102013-irish-pmis-are-they-meaningful.html

Thursday, October 3, 2013

3/10/2013: Irish PMIs - are they meaningful?


Having covered Services and Manufacturing PMIs (see links here: http://trueeconomics.blogspot.ie/2013/10/3102013-services-and-manufacturing-pmis.html) in terms of Q3 2013 averages, let's have a reminder as to the links to actual growth in Irish GDP and GNP these series have.

Two charts covering through Q2 2013:


Thus, overall:

  • Changes q/q in Manufacturing PMIs have only a weak correlation with actual real (constant prices) GDP and GNP changes q/q: R-squares of just 35.6% and 29.4% respectively when we remove the constant factor (which is not significant by itself at any rate). This is weak to say the least.
  • Changes q/q in Services PMIs have only a very weak correlation with actual real (constant prices) GDP and GNP changes q/q: R-squares of just 16.4% and 17.6% respectively when we remove the constant factor (which is significant). This is very poor.
  • With positive intercepts of 0.0023 for GDP and 0.0024 for GNP, the Services PMI R-square rises to 23.7% for GDP and 22.7% for GNP. Once again, no change to the above conclusion.
The above suggests that a significant component of both PMIs come from transfer pricing and not real economic activity on the ground. Or put differently, the PMIs are not that exceptionally meaningful indicators of actual levels of activity in the economy and are only weakly-significant in indicating the direction of that activity. 

Note: this is quarterly averages data, not much more volatile data based on monthly series. Which puts to question monthly movements in PMIs even more...

3/10/2013: Services and Manufacturing PMIs for Ireland: September 2013


In the previous posts I covered separately both Service PMI for Ireland and Manufacturing PMI (released by Markit & Investec). As noted, both series show strong performance in September. Here is the combined analysis:

Both Services and Manufacturing PMIs are now above their historical crisis-period averages. Manufacturing PMI is slightly ahead (0.1 points) of its historical pre-crisis average since May 2000 when both series start running coincidently. Services PMI is now slightly below its historical pre-crisis average.

Services PMI have broken out of the flat trend and are now trending up for the last 12 months. However, Manufacturing PMI continues to move side-ways, although on average remaining positive.


Two major points: September 2013 reading puts both indices at statistically significant levels above 50.0, which is the first such occurrence since February 2011:


In addition, we are seeing stronger positive correlation between the two indices (the 12mo rolling correlation below is only indicative) established since February 2013 low:


In other words, both sides of the economy are now performing better, but we need this momentum to be sustained over 2-3 months to see serious feed-through into actual economic activity figures.

Tuesday, October 1, 2013

1/10/2013: Irish Manufacturing PMI: September 2013


Some good readings from Irish Manufacturing PMI (Investec-sponsored Markit data) for September:

  • Headline PMI is at 52.7 up on 52.0 in August and the highest reading since 53.9 in July 2012.
  • Critically, this appears to be the first statistically significant reading above 50.0 since November 2012.
  • I use 'appears' above since we have no formal analysis from Markit on this (Investec don't do analysis). The distribution is Laplace. August reading was close to being statistically significant.
  • In terms of trend, Q1 2013 average reading was 50.13, Q2 2013 at 49.33, Q3 now reads 51.9. 
  • 12mo MA is at 50.8.
  • 3mo MA through September 2013 is at 51.9, which is below the same period 2012 (52.2), but ahead of 2011 (49.2) and slightly ahead of 2010 (50.4).

Now, it appears we have broken the downward trend at last. Index volatility (36mo rolling) has fallen slightly to around 2.3 in terms of 3mo average through September, which is close to historical average of 2.4 and is well below the crisis-period average of 3.4. Positive skew on change is at 3mo average of +0.75 (for deviations from 50.0) and this contrasts with a negative -0.34 skew for historical data and -0.25 skew for crisis period data. So let's call it a trend reversal for the short term:


Sadly, nothing else to report, since Investec/Markit continue to push out data-less releases. Wish I could tell you about employment, exports orders, total orders... but there is not a single number in the press release, only comments.

Monday, September 23, 2013

23/9/2013: A summary of changes in the Irish GDP: 1970-2012

Summary of the changes in Irish GDP composition over 1970-2012 period (all in current market prices terms):

I marked in red bold those components that perform at their worst historical comparative in 2010-2012 period and in green bold those that perform at their historical best, as per their contributions to GDP.

Notable aspects of the above table:

  1. The 'greedy decade' of the 2000s was actually distinguished by the lowest share of the economy accruing to personal consumption of goods and services - the Range Rovers of South Dublin didn't really cause the bust, folk...
  2. Government spending rose, as a share of economy, in 2010s compared to 2000s and reached above the levels recorded in the 1990s, albeit still below the disastrous years of the 1980s.
  3. Gross fixed capital formation has been demolished in the 2010s by the crisis, although its peak during the excesses of the 2000s was still lower than in the 1970s.
  4. Exports of goods and services outstripped imports of goods and services, resulting in the net exports hitting their peak in the 2010s. Some 46 percent of our net external trade went out of the window as profits expatriated by the MNCs (and that is after we also account for profits on-shored into Ireland by Irish companies and investors).
  5. Oh, and the fabled EU subsidies - well, these have been drained (note, these subsidies are reflected here gross, without accounting for EU taxes paid).

Friday, September 20, 2013

20/9/2013: Domestic Economy: Continuing Its Sextuplet Dip in Q2 2013

Total Domestic Demand is defined as :

  • Consumer Spending on goods and services + 
  • Government Spending on Current (as opposed to capital) goods and services + 
  • Gross Fixed Capital Formation (basically gross investment) + 
  • Change in Stocks of goods and services in the economy. 

In a more old-fashioned way, it is Investment + Consumption + Net Government Spending.

Put differently, this is the domestic economy (excluding exports net of imports, and outflows of income to the rest of the world net of inflows of income from the rest of the world).

Now, here are the quarterly changes in the domestic economy from 2007 on, for real (constant prices) seasonally adjusted series:


I define 'dips' in the above series similar to the official definition of a recession: two consecutive q/q downward movements. Remember, we have been told since Q2 2010 that the Irish economy has 'stabilised' and even 'returned to growth'. Since then we had: eight quarters of contraction and four quarters of growth in Total Domestic Demand.

The two core drivers downward in the domestic economy on q/q basis are:

On the good news side, q/q increase in Personal Consumption component (above) and external trade (below):

And external trade showing strong performance on q/q basis, which, alas, only partially offsetting the decline recorded in Q1 2013...


And this concludes my analysis of the QNA for Q2 2013.

20/9/2013: H1 2013 QNA: Domestic Economy vs External Trade

In the previous two posts I looked at Q2 national accounts for Ireland in terms of headline GDP and GNP figures, y/y and q/q changes in the first post; and half-yearly figures analysis in the second post. The headline conclusion was that:
  • Q2 2013 real (constant prices) GDP performance is weak, but posits some growth, pushing us out of official third dip recession. 
  • Irish real GNP fell 0.1% in Q2 2013 compared to Q2 2012, having only marginally reversed the 6.01% y/y rise recorded in Q1 2013. 
  • Broadly-speaking, H1 figures show continued economic performance within the new structural range of slower economic activity that set on with the 'recovery' of H2 2010 (the Celtic Canary period).
  • Crucially, moving to less volatile half-yearly figures, Y/Y Irish real GDP fell 1.10% in H1 2013, marking a second consecutive 6-months period of declines (it was down y/y 0.75% in H2 2012 as well). 
  • Y/Y Irish real GNP rose 2.87% in H1 2013, marking third consecutive 6-months period of increases in GNP.
  • At current rates of growth (that is taking 3-year average, since current annual rate is negative), it will take us until 2029 before we can reach real levels of GDP consistent with the pre-crisis levels. 


Now, let's take a look at the underlying components of GDP and GNP from the expenditure side of the national accounts. Since we have half-yearly data, we might as well focus on longer-term, more stable series. For this purpose, let us also look at nominal (not real) values, so we have some idea as to actual activity on the ground, reflective of price changes, as well as volumes changes. There are several reasons for doing this:
  1. Nominal values, expressed in current prices are actually linked to what we get paid, what we pay for and what the economy produces;
  2. Nominal values are also reflective of what the Government spends, collects and what the potential for debt servicing is when it comes to economy's output; and
  3. Nominal values are free from the impact of the inflation adjustments, which are made based on 'average' households and firms, rather than on what we do observe in the economy itself.

There are drawbacks to this analysis, so like everything else in economics, this is not intended to be 'completely and comprehensively' conclusive.


As can be seen from Chart above, Personal Expenditure on Goods and Services rose 0.4% y/y in H1 2013 - which is good news. However, the same was down on H1 2011 (recall that the Government is keen on claiming that consumer confidence and consumption spending rose during its tenure, which is obviously contradicted by the data we have). Compared to peak pre-crisis performance (peak referencing output peak, not specific series peak), we are down 10.61% on H1 2007.

Understandably, Government spending (net of tax receipts) is down when it comes to current goods and services (as opposed to capital goods and services): -2.11% on H1 2012, -4.27% on H1 2011 and -12.46% on H1 2007. You might think this is 'huge', but y/y over the first 6 months of 2013 our net current Government spending is down only EUR 278 million and when it comes to vast/deep cuts since 2007, H1 2007 spending was cut EUR1,754 million by the end of H1 2013.

Meanwhile, Gross Fixed Capital Formation (basically investment in the economy) is down 9.40% in H1 2013 compared to H1 2012, down 14.09% compared to H1 2011 and down 67.73% compared to H1 2007. The reductions in capital investment jun H1 2013 compared to H1 2007 are ten-fold the size of reductions in current Government spending at EUR17,542 million. For another comparison, reductions in personal expenditure on goods and services by households over the same period is EUR4,757 million.

Put in different terms, domestic economy is still falling, with no stabilisation in sight.

Next: external trade and GDP & GNP series:


Exports of goods and services - the only part of the economy that was booming (+15.94% in H1 2013 on H1 2007 and +5.44% on H1 2011) are hitting some bumps. H1 2013 posted a decline in total exports of 0.67% y/y. Meanwhile, imports of goods and services were up 0.08% y/y. As the result of this, our trade balance fell 2.32% y/y in Q2 2013 and is down 3.15% y/y for H1 2013. This is not good, as key Exchequer projections and debt sustainability analysis require healthy growth in trade surplus, not a decline. But more on this below…

GDP at current prices fell 1.49% in H1 2013 compared to H1 2012 and is down 0.28% on H1 2011 and down 15.26% on H1 2007. Recall that our real GDP fell 1.10% y/y in H1 2013. In other words, there is no growth in actual underlying activity. This is pretty bad. Actual euro notes we have in the economy's 'pockets' at the end of H1 2013 (as imperfectly measured by GDP) were fewer than at the end of H1 2012 and H1 2011. And these fewer euros were not worth more, either. I wouldn't call this 'stabilisation'.

Net factor income outflows abroad are falling as well and I commented on these in the previous posts.

GNP expressed in current market prices is 2.32% ahead in H1 2013 compared to H1 2012 and 2.92% ahead of H1 2011. This is good news, especially since GNP is a more accurate reflection of our real economy's output (also rather imperfect) than GDP. Not so good news: GNP is still down 17.53% on H1 2007. 

Chart below drills into the composition of our external trade:


The above clearly shows the massive swing of our external trade activities from goods sectors to services sectors. And on imports of goods side it shows the legacy of the consumption bust, which remains one of the two largest drivers for improved external trade statistics we see on national accounts.

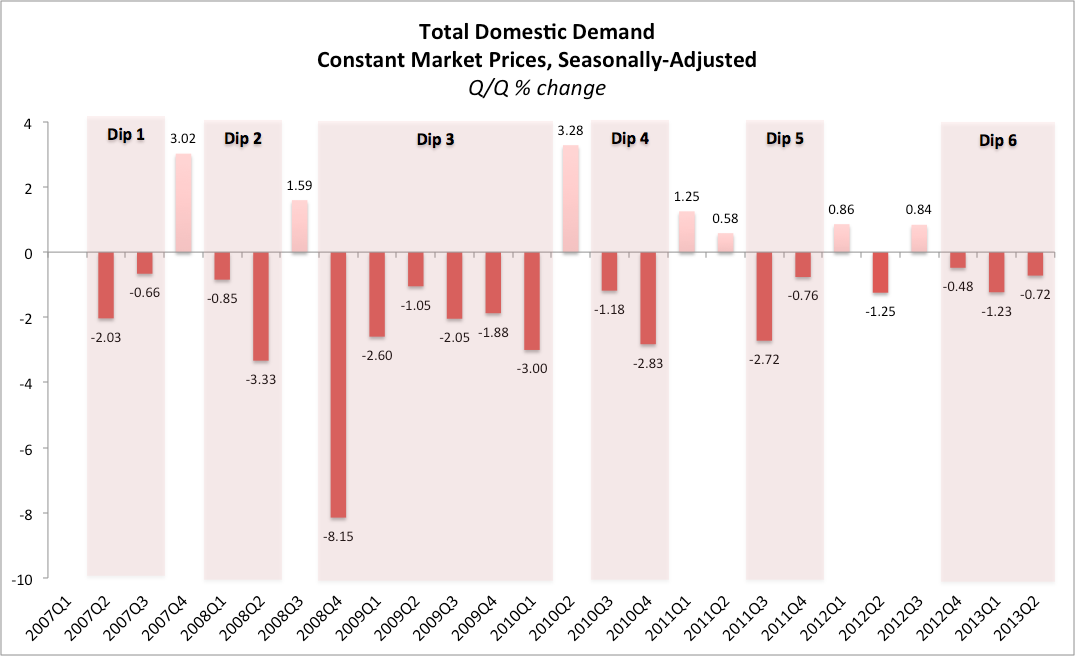
Finally, total domestic demand: the measure of the economy that covers all domestic activities of private and government consumption and investment combined, plus chafes in stocks.


As the above shows, domestic economy continues to suffer losses in activity: Total Domestic Demand fell 0.95% in H1 2013 compared to H1 2012 and is down 3.05% on H1 2011. Compared to H1 2007, Total Domestic Demand is down 27.41%.

Summary: Bad news: Despite improvements in real variables in Q2 2013, domestic economy continued to contract in H1 2013, with domestic demand down compared to H1 2012, driven by declines in Net Government Current Expenditure and in Gross Fixed Capital Formation. Good news is that decline in domestic demand was ameliorated by a marginal increase in Personal Expenditure on Goods and Services. On the bad news side, exports of goods and services fell in H1 2013 compared to H1 2012. These changes, together with domestic demand movements resulted in GDP falling in H1 2013 compared to H1 2012. Lower rate of profits repatriation out of Ireland by the MNCs has resulted in an increase in GNP in H1 2013 compared to H1 2012.


In simple terms, if Irish economy were a student asking for a report card for H1 2013, I don't think there would be much on it worth boasting about. Let's hope H2 2013 will be different for the better.

Thursday, September 19, 2013

19/9/2013: First Half 2013: Irish GDP and GNP growth divergence

CSO published Q2 national accounts for Ireland today and these are worth detailed analysis, which I will break up into a series of posts next. 

In the previous post, I covered headline GDP and GNP figures, y/y and q/q changes. As a reminder, the headline conclusions were that:
  • In Q2 2013 Irish real GDP fell 1.17% on Q2 2012, marking the fourth consecutive quarter of real GDP contractions, the longest period of continuous contractions since the end of Q2 2010. 
  • Irish real GNP fell 0.1% in Q2 2013 compared to Q2 2012, having only marginally reversed the 6.01% y/y rise recorded in Q1 2013. 
  • On quarterly basis, seasonally-adjusted Q2 2013 real GDP rose 0.45% on Q1 2013, ending the third spell of the recession that lasted from Q3 2012 through Q1 2013. The expansion, however was weak and well below the one recorded during the previous recovery periods. 
  • I am continuing to expect that Q3 2013 will post stronger performance than Q2 2013 with possible GDP q/q upside of closer to 1%.


Now, let's move onto H1 (first half of 2013) analysis.

Q2 2013 release allows us to look at half-annual GDP and GNP changes, something that removes some of the quarterly volatility and also brings us closer to the analysis that is relevant from the budgetary perspective. Remember, budgets are not based on quarterly forecasts, but annual ones.

H1 2013 GDP at constant prices seasonally adjusted fell 0.47% on H2 2012, marking the third consecutive half-yearly period of declines. Last time we had a half-yearly period of growth was in H2 2011.

H1 2013 GNP grew 2.17% over H1 2013 compared to H2 2012, marking the third consecutive 6-months period of growth. In other words, GNP perfectly countermoves against GDP. Why? Because of the changes in transfers of earned profits by the multinationals. 


Here's an interesting thing. The chart above shows three periods of Irish growth history (I am being sarcastic/humorous here, so no offence intended): 
  1. The Celtic Tiger period - for which we have consistent data here is only covered by the period from 1997 through 2000: averaged H/H growth rates of 4.49%;
  2. The Celtic Garfield period - which lasted roughly from 2001 through H1 2007; Celtic Garfield period growth averaged 2.51%; and
  3. The Celtic Canary period (as the proverbial one in the EU's economic model coal mine) that started with the imaginary 'recovery' of 2010 and is running currently: averaged growth of 0.24% (do remember, that excludes the period of massive contraction between H2 2007 and H2 2009 when the average rate of growth was -2.0% H/H)

You can see that the slowdown in growth is not only due to the crisis, but appears to be structural in nature. The Canary part is because Irish economy's fundamentals are such that we should be growing at 3.5-4.5 percent annually. Yet we are growing at - say averaging Celtic Garfield and Celtic Canary periods - at 1.35-1.4 percent annually. This is the slowdown toward the European levels of growth for Ireland... something to think about?

Next, take a look at the levels of activity based on 6 months figures:


And now, let's talk about year-on-year changes in H1 2013:
  • Y/Y Irish real GDP fell 1.10% in H1 2013 (in other words, against H1 2012), marking a second consecutive 6-months period of declines (it was down y/y 0.75% in H2 2012 as well). 
  • Y/Y Irish real GNP rose 2.87% in H1 2013, marking third consecutive 6-months period of increases in GNP.
  • Overall, H1 real GDP (non-seasonally-adjusted) was up 1.65% on H1 2010 when we first heard about the 'recovery' of Irish economy or 'stabilisation'. Thus over 3 years, our GDP grew 1.65% - producing average annual rate of growth of 0.55%. Not exactly stellar, but better than nothing.


Our current H1 2013 GDP is down 7.98% on peak levels, so we are still far away from recovering to pre-crisis levels in real terms. In fact, at current rates of growth (that is taking 3-year average, since current annual rate is negative), it will take us until 2029 before we can reach real levels of GDP consistent with the pre-crisis levels. When someone says we have a lost decade, what they really mean - in real GDP terms - is that we are likely to have lost 23 years. And that does not count the opportunity cost of foregone growth. That is one hell of a long 'lost decade'.

To summarise the above: Good news is: real GNP is up 2.87% y/y, and up for the third consecutive 6-month period. Bad news is: our real GDP is down 1.1% y/y and this marks second consecutive 6-month period of declines.

I expect growth to be positive in H2 2013, with y/y around 1.0-1.2%.  Which should push our full year growth closer to zero.


Stay tuned for more analysis of QNA results.

19/9/2013: Irish GDP and GNP: Q2 2013 & the 'end of the third recession'

CSO published Q2 national accounts for Ireland today and these are worth detailed analysis, which I will break up into a series of posts next. 

Starting with the headline GDP and GNP figures:

In Q2 2013 Irish real (constant prices) GDP fell 1.17% compared to Q2 2012, compounding the previous fall of 1.04% y/y recorded in Q1 2013. On an annual basis, this marks the fourth consecutive quarter of real GDP contractions, the longest period of continuous contractions since the end of Q2 2010. Currently, real GDP stands 7.83% below the historical peak.

At the same time, Irish real GNP fell 0.1% in Q2 2013 compared to Q2 2012, having only marginally reversed the 6.01% y/y rise recorded in Q1 2013. Despite a surprisingly robust rise in Q1, Q2 2013 real GNP stood 10.40% lower than pre-crisis peak.

The swing in the direction between GDP and GNP was driven in Q2 2013 by a 5.85% drop in the outflows of transfer payments to the rest of the world compared to Q2 2012, which compounded a massive 28.26% decline in the transfer payments recorded in Q1 2013. In other words, GNP improvements appeared to have been sustained by a massive parking of MNCs profits in Ireland. The reasons for this are unknown, but we can speculate that the MNCs are holding back profits from transferring out of Ireland due tot ax considerations and due to subdued global investment activities. It remains to be seen what happens to the GDP and GNP were the MNCs to begin once again actively exporting retained earnings.


Note: shaded periods show episodes of more than 2 quarters consecutive contractions (here on y/y basis, so these are not official recessions)

On quarterly basis, seasonally-adjusted series:

Q2 2013 real GDP rose 0.45% on Q1 2013, partially compensating for the 0.59% contraction in Q1 2013 and ending the third spell of the recession that lasted from Q3.2012 through Q1 2013. The expansion, however was weak and well below the one recorded during the previous recovery periods. For example in Q1 2010, the end of the second recessionary dip, GDP expanded by 0.82%. The end to one-quarter drop of Q2 2010 led to a GDP rise of 1.08% in Q3 2010, the end of one quarter contraction in Q4 2010 was followed by 1.48% expansion in Q1 2011 and 1.38% expansion in Q2 2011, even the end of Q1 2012 quarterly decline was marked by a 0.48% expansion in Q2 2012. In previous episodes, recovery that was associated with growth rates at below 0.7% q/q was swiftly followed by the subsequent quarter contraction in GDP. This suggests underlying weakness in the GDP performance in Q2 2013, although my personal expectation is that Q3 2013 will post stronger performance than Q2 2013 with possible GDP q/q upside of closer to 1%.

On GNP side, seasonally-adjusted real GNP fell 0.37% in Q2 2013 in q/q terms, ending two consecutive quarters of quarterly growth (Q1 2013 growth was robust 2.2% q/q and Q4 2012 growth was weak at 0.32%).

Two charts:


Note: shaded periods show episodes of more than 2 quarters consecutive contractions (here on q/q basis, seasonally adjusted, thus representing official recessions).

On historical comparison basis, table below summarises latest movements in GDP and GNP:


So a summary: we are officially out of the third dip of the Great Recession. This is a good news. 

Bad news is that this data is once again being paraded around as a sing of 'stabilisation' of economic activity. Alas, the first time we've heard this 'stabilisation' argument was in Q1 2010, when the main - longest and deepest - second dip ended. Since then, Irish economy has managed to grow by just 2.63% in real GDP terms and only 3.54% in real GNP terms. Since the onset of the recovery, we have posted average quarterly growth of only 0.18% (seasonally-adjusted figures) and this effectively means that the economy is in a stabilisation pattern closer to coma than to a sustained recovery.

Good note to all of this is that, as mentioned above, I do expect stronger activity to be recorded for Q3 2013 and possibly for Q4 2013 as well.

Monday, September 2, 2013

2/9/2013: Irish Manufacturing PMI: August 2013

Markit/Investec Irish Manufacturing PMI out for August today. As usual - no data on sub-indices, no statistical analysis released.

Headline reading improved to 52.0 in August, up on 51.0 in July, marking the highest reading since November 2012 when it stood at 52.4 and the third highest reading in 12 months. Release from Markit is here. My analysis as follows:

  • 1.0 points gain on July is a decent number. We are now into third consecutive month of nominal seasonally-adjusted readings above 50.0. All of these are good signs.
  • Another good sign: 12mo MA is now at 50.8 and 3mo MA is at 51.1. This implies that 3mo MA is ahead significantly over 48.8 reading for 3mo through May 2013. However, on a negative side, 3mo MA through August 2013 is down on 52.6 recorded for the 3mo through August 2012, although it is ahead of 3mo MA for the same period in 2011, and down on same period average for 2010.
  • Cautionary signs: current reading is still below statistically significant levels (ca 52.2), although we are in a Laplace distribution (as I noted earlier, based on higher moments). Last time the index was reading statistically above 50.0 was in November 2012.
  • Another note of caution: Q3 2013 to-date averages at 51.5 - nice number, but recall that in a contractionary Q1 2013, PMIs averaged above 50.1. Nonetheless, good news - the index for Q3 2013 to-date is above both Q1 and Q2 readings. 
Trends illustrated:


Note strong departure from 6mo MA in the chart above, which is encouraging; and in the chart below, note that we have finally reached above the crisis-period average for the index.


Another good news bit is that we have moved closer to confirming the index breakout from the downward trend that run from July 2012 through June 2013. One-two months more of this performance and we can be moving onto a new trend:


Summary: overall, decent performance by manufacturing PMI in August. 

I cannot confirm any of the statements made by Markit/Investec, and note: I have not seen Investec usual longer release so far. However, per Markit, all three main sub-sectors have posted increases in output in August, and "new orders rose for the second successive month, and at a solid pace that was the strongest since July 2012". No idea where actual indices readings are at. "Meanwhile, employment continued to rise, extending the current sequence of job creation to three months. However, the pace of increase slowed over the month." Again, no idea as per actual readings.

Friday, August 2, 2013

2/8/2013: Irish Manufacturing PMI: July 2013

Manufacturing PMI for Ireland was out yesterday. And as usual, it was worth waiting and giving the Irish media time to get through their circus of 'analysis'. The excitement of 'growth' predictions aside, here's the raw truth about the numbers (please, keep in mind that shambolic data coverage by Markit press-release is no longer conducive to any serious analysis of the underlying components of the PMIs). Note: PMI for Ireland are released by Investec and Markit.

All we have is the headline number. On the surface, headline Manufacturing PMI moved from 50.3 in June to 51.0 in July. Both numbers are above 50.0 and thus suggest expansion. This marks two consecutive months of growth.

However, there are some serious problems with the above. Read on:
-- At 51.0, July PMI is barely above 12 mo average of 50.7.
-- 3mo average through July is at 50.3, ahead of 49.4 3mo average through April 2013 - which is good news.
-- In July 2012, PMI was at 53.9 which was statistically significantly above 50.0 (in other words, statistically we did have growth in July 2012, which turned out to be pretty disastrous year for manufacturing and industry as we know). And in July 2013 at 51.0 there is no statistically significant difference in current PMI reading from 50.0, which means - statistically-speaking - we do not have growth.
-- Current 3mo MA at 50.3 is not different from 50.0 statistically
-- Current 3mo MA is below that in 2012 (52.7), ahead of that in 2011 (49.9) and below that for 2010 (52.4) - which is not exactly confidence-inspiring, right?
-- M/m (recall, these are seasonally-adjusted numbers) there was a rise in PMI of 0.7 (slightly better than m/m rise of 0.6 in June 2013). Alas, this monthly rise was also statistically indifferent from zero.

Here are two charts that illustrate the above points.


In short - good news is that PMI is reading above 50 and strengthened in July compared to June. Bad news is that statistically-speaking, neither the reading levels (in both June and July), nor increases m/m (in both June or July) are significant. Which means that we simply cannot will away the caution in reading the PMI numbers this time around.

Sunday, July 7, 2013

7/72013: Irish Manufacturing & Services PMI: June 2013

In the previous post I covered in detail the dynamics of the Services PMI (here) and few posts back, I covered Manufacturing PMIs (here). Now, lets take a look at both together.


Chart above shows the deviations of both PMIs from 50.0, with pre-crisis and post-crisis averages.
The relative weakness in Manufacturing performance, from the end of Q2 2011 through current is pretty much apparent. Both, manufacturing and services PMIs signaled much stronger growth conditions prior to the crisis, than since the beginning of 2010.

The most significant decline took place in Services, with the pre-crisis average deviation from 50.0 at 7.6 falling to 1.9 average deviation in post-January 2010 period. With STDEV at 6.5 since 2008 (7.4 prior historical), and with skew at -0.7 and kurtosis at 0.73, we are nowhere near average deviation being statistically significantly different from zero since the onset of 'recovery'.

Manufacturing decline has been more modest, given weak rates of growth in pre-crisis period. The average rate of pre-crisis deviation from 50 was 2.6 and that well to 1.1. With historical STDEV of 4.2 and STDEV since 2008 at 5.2, skew at -1.6 and kurtosis of 3.24, this is again indistinguishable from zero growth conditions.

On slightly better side of things and along shorter-run dimension, 3mo MAs are both above zero, but, once again, none are statistically significantly different from zero.


There is a strong, but non-linear relationship between Manufacturing and Services PMIs at levels, and it shows that year on year, relative gains in Manufacturing over 2011-2012 got erased over 2012-2013 and were replaced by relative gains in Services.


Irish PMIs have, however, very tenuous link to actual economic growth. Here are two charts showing this week relationship for log-log growth terms, but exactly the same picture is confirmed by taking simple level deviations in PMIs from 50, as well as for linear and cubic relationships (for robustness):


It is quite telling that Services PMIs have much weaker explanatory power for GDP and GNP growth than Manufacturing PMIs, confirming that Irish services, dominated by ICT and IFSC tax-optimising MNCs are not as relevant to Irish economy as manufacturing sectors.

Another telling thing is that both for Services and Manufacturing, the sectors activity as measured by PMIs has stronger relationship with GDP than GNP - which is also predictable, once you consider the PMIs heavy slant toward MNCs.


Note: raw data on PMIs levels is taken from Markit-Investec releases, with all analysis above, as well as deviations from 50 and all other transformations, including quarterly data computations, undertaken by myself. These transformations and analysis are intellectual property of my own and should not be cited without appropriate attribution.

Friday, June 28, 2013

28/6/2013: Expenditure Components of GDP: Q1 2013

Having looked at the recession/expansion dynamics in Irish economy on foot of Q1 2013 figures (here),  the dynamics in GDP and GNP in Ireland at the aggregate levels (here), and the mythology of the 'exports-led recovery' (here), let's round up the Q1 2013 QNA cover with a look at the expenditure-lined components of the GNP and GDP.

Below we look at the Seasonally-adjusted Current Market Prices data.

Personal Expenditure on Consumption Goods and Services fell 2.21% in Q1 2013 q/q and was up 0.01% y/y. This compares against much more benign drop of -0.07% q/q in Q4 2012 and a 1.15% rise y/y. Since Q1 2011, when the Coalition came to power, Personal Expenditure is down 1.55%. In terms of q/q changes, Q1 2013 marked second consecutive quarter of declines.

Net Government Expenditure on Current Goods and Services declined 0.1% q/q in Q1 2013 and was down 2.56% y/y. This marks moderation in declines recorded in Q4 2012 when q/q decline stood at -1.90% and y/y decline was running at -2.88%. Net Government Expenditure decline was the shallowest contributor to voerall economic contraction recorded in Q1 2013. Compared to Q1 2011, Net Government Expenditure on Current Goods & Services was down 3.98% in Q1 2013. In terms of q/q changes, Q1 2013 marked second consecutive quarter of declines.

Gross Fixed Capital Formation - the most devastated expenditure component of GNP to-date has fallen massive 7.32% in Q1 2013 in q/q terms and was down whooping 18.74% in y/y terms. This shows dramatic acceleration in decline from -2.16% drop in q/q terms in Q4 2012 and the reversal of the y/y rise of +4.31% recorded in Q4 2012. Relative to Q1 2011, Gross Fixed Capital Formation was down 14.25% in Q1 2013. In q/q terms, Q1 2013 marked second consecutive quarter of declines.

Exports excluding factor income shrunk 0.79% in Q4 2012 on q/q basis and there was 4.93% growth in y/y terms. This was then. In Q1 2013 exports of goods and services fell 4.59% q/q and were down 3.13% y/y. Relative to Q1 2011 exports of goods and services net of factor income payments were up 2.22% in Q1 2013, but we also marked two consecutive quarters of contraction here.

Imports of goods and services, net of factor income payments were down 2.12% q/q in Q1 2013 and -3.13% y/y. This marks significant shift 'South' in the series compared to Q4 2012 when imports shrunk 1.05% q/q and were up 4.57% in y/y terms. Imports are running -0.05% down on Q1 2011 and Q1 2013 marks the second consecutive quarter of q/q declines.


GDP at curent prices, seasonally adjusted fell 0.6% q/q in Q4 2012 and there was annual growth of 0.38%. In Q1 2013, GDP fell 2.16% q/q and there was annual decline of 2.09%. This marks third consecutive quarter of decline in GDP and thus officially, return of the recession is dated to Q4 2012. The average rate of recessionary decline in GDP in the current episode is so far -1.06% per quarter. This is shallower than the previous recessionary episode (Q4 2008-Q4 2009) when GDP contractions averaged 2.76% per quarter. Compared to Q1 2011, Q1 2013 GDP at current market prices stood at -1.04%, or put differently, gross domestic product in Ireland in Q1 2013 stood below the levels attained in Q1 2011 when the current Government came to power.

Net factor income from the rest of the world declined in both Q4 and Q1, with decline accelerating in Q1 2013 to 19.21% q/q from 2.92% in Q4 2012. As the result of this, GNP moved up, in the opposite direction of the GDP.

GNP at current market prices grew 0.68% q/q in Q1 2013, down on 1.18% expansion recored in Q4 2012. On y/y basis, GNP grew 4.12% in Q4 2012 and by 4.26% in Q1 2013. Compared to Q1 2011, GNP is now up 2.46%.

Both Final Domestic Demand and Total Domestic Demand posted second consecutive quarter of q/q contraction in Q1 2013.


To summarise, not a single line of expenditure posted an increase in the Q1 2013 in terms of q/q changes once seasonal adjustments are taken into the account. In other words, the sole positive improvement in the numbers - relating to GNP - was driven exclusively by reduced outflow of funds from MNCs.

Worse, not a single line in the determination of the GDP in Ireland was up in q/q terms in any quarter since the end of Q3 2012. We had, put differently, 6 months of across the board contractions in the economy, when we consider expenditure-based definition of GDP.