Saturday, June 19, 2021

19/6/21: COVID19: Worldwide Data


With some time passing since my last update, and the rates of vaccinations ramping up globally, it is easy to forget the simple, but devastating fact: we are still in a global pandemic. Here are the latest weekly totals for new cases and new deaths, worldwide:


Just as the charts show,
  • New cases have fallen significantly from the pandemic peak (Wave 4), but remain above the prior trough between Waves 3 and 4. 
  • New deaths recorded are still at extremely high levels, and showing an uptick week-on-week in the latest data.
Meanwhile, mortality of new Covid19 cases is stubbornly at the levels observed over the last two waves of the pandemic:


Put differently, the 'rich' world is getting vaccinated (albeit with some variation in the rates), while the emerging markets and middle-income economies remain well behind on vaccinations curve. Which means there is continued threat of a global pandemic re-igniting and the looming uncertainty over the new variants emerging.

So much for the 'reopening' future...

Tuesday, June 8, 2021

8/6/21: U.S. Investor Confidence under Biden

 My recent comment on the Biden Administration early successes for the Euromoney: https://www.euromoneycountryrisk.com/article/b1rqlvl15wr2mw/special-country-risk-survey-us-investor-confidence-is-returning-under-biden?LS=Adestra2055255%E2%80%A6 


8/6/21: World is more VUCA. Less Risk.

 For those who have been my students in recent years none of this will come as a surprise: the world around us is becoming less 'risk-driven' and more 'VUCA-prone'. By VUCA, of course, we mean volatile, uncertain, complex and ambiguous. 

Here is a neat summary via McKinsey:


None of the above data sets are 'risk' in any structured or definitional sense of that terms. None carry known, easy-to-define probability distributions, none have strictly identifiable impact distributions and none adhere to the normal laws of large numbers. These are uncertain events that are also inter-related through complex contagion pathways. 

Good luck fitting actuarial tables to them... 

8/6/21: This Recession Is Different: Corporate Profits Boom


Corporate profits guidance is booming. Which, one might think, is a good signal of recovery. But the recession that passed (or still passing, officially) has been abnormal by historical standards, shifting expectations for the recovery to a different level of 'bizarre'.

Consider non-financial corporate profits through prior cycles: 


Chart 1 above shows non-financial corporate profits per 1 USD of official gross value added in the economy. In all past recessions, save for three, going into recession, corporate profit margins fell below pre-recession average. Three exceptions to the rule are: 1949 recession, 1981 recession and, you guessed it, the Covid19 recession. In other words, all three abnormal recessions were associated with significant rises in market power of producers over consumers. And prior abnormal recessions led to subsequent need for monetary tightening to stem inflationary pressures. Not yet the case in the most recent one.

The second chart plots increases in corporate profit margins in the recoveries relative to prior recessions. Data is through 1Q 2021, so we do not yet have an official 'recovery' quarter to plot. If we are to treat 1Q 2021 as 'recovery' first quarter, profits in this recovery are below pre-recovery recession period average by 2 percentage points. Again, the case of two other recessions compares: the post-1949 recession recovery and post-1980s recovery are both associated with negative reaction of profits to economic cycle shift from recession to recovery.

Which means two things:

  1. Market power of producers is rising from the end of 2019 through today, if we assume that 1Q 2021 was not, yet, a recovery quarter (officially, this is the case, as NBER still times 1Q 2021 as part of the recession); and
  2. Non-financial corporate profits boom we are seeing reported to-date for 2Q 2021 is a sign not of a healthier economy, but of the first point made above.
In effect, some evidence that Covid19 pandemic was a transfer of wealth from people to companies that managed to trade through the crisis. 

Sunday, June 6, 2021

6/6/21: BRIC PMIs for May: Volatile Growth and Surging Inflationary Pressures


BRIC PMIs for May 2021 show uneven pace of recovery within the group of the largest Merging and Middle Income economies and a uniform evidence of pressure on inflation side.

  • Brazil: Manufacturing PMI is currently running at 53.0 for 2Q 2021 for two months into the quarter, down from 1Q 2021 reading of 55.9. This marks second consecutive quarter of decreases in Manufacturing sector activity in Brazil. Brazil Services PMI is currently running at a deeper recessionary reading of 45.6, compared to 1Q 2021 at 46.1. As the result, Brazil's Composite PMI fell from the already recessionary reading of 47.9 in 1Q 2021 to 46.9 in 2Q 2021 to-date. Prices, meanwhile continued to show severe inflation pressures. Per Markit: "The rate of input cost inflation across the private sector softened further from March's record high, but remained one of the strongest since composite data became available in early-2007. ... In contrast to the trend for input costs, there was a quicker increase in aggregate selling prices. In fact, the rate of charge inflation was the strongest seen in the series history. Manufacturers again saw the sharper rise, despite inflation here softening during May."
  • Russia: Manufacturing PMI remains at the same level through the first two months of 2Q 2021 (51.2) as in 1Q 2021, implying steady, but relatively weak growth. That said, monthly numbers have been more volatile in 2Q 2021 so far (range of 50.4 to 51.9) compared to 1Q 2021 (range of 50.9 to 51.5). Russia Services PMI rose to a robust reading of 57.5 in May, pushing the quarterly average to 56.4 2Q 2021 so far, up on 1Q 2021 average of 53.6. All in, Russian PMIs for both sectors are now in the second consecutive > 50.0 readings territory - a good signal. Composite PMI rose to 55.1 in 2Q 2021 to-date, compared to 53.2 in 1Q 2021. This marks the highest composite PMI for any BRIC economy for 2Q 2021 to-date. Just as with global and rest-of-BRICs cases, Russian inflationary pressures were running high in May. per Markit: "Price pressures remained high in May, with rates of private sector cost and charge inflation quickening notably. Sharper supplier price hikes and greater fuel costs reportedly spurred increases in cost burdens."
  • India: Manufacturing PMI slipped from 56.9 in 1Q 2021 to 53.2 in 2Q 2021 to-date, marking the second consecutive quarter of declining PMIs. May 2021 reading was at 50.8, signaling, statistically, zero growth conditions in the sector. Services PMI fell below 50.0 mark in May reaching 46.4, with 2Q 2021 reading so far standing at 50.2, down from 54.2 in 1Q 2021. Statistically, the 2Q 2021 reading to-date implies zero growth in the Services sector. As the result, India's Composite PMI fell to 51.8 in 2Q 2021 to-date, down from 56.4 recorded in 4Q 2020 and 1Q 2021. With domestic demand slipping, inflationary pressures remained high, but did not accelerate. per Markit: "The rate of input cost inflation at the composite level eased to a four-month low in May, with slower increases noted at manufacturing firms and their services counterparts. Aggregate selling prices rose moderately and at a rate that was similar to April's. The quicker rate of charge inflation was seen in the manufacturing industry."
  • China: China Manufacturing PMI remains relatively robust in 2Q 2021 so far (52.0) compared to 1Q 2021 (51.0), with levels of activity somewhat higher than historical average (50.7). Meanwhile, activity in the Services sector has accelerated, with Services PMI rising from 52.6 in 1Q 2021 to 55.7 in 2Q 2021. The latest Composite PMI reading remains robust at 54.3 for the first two months of 2Q 2021, compared to 52.3 in 1Q 2021, and above, statistically, historical average of 52.6. On inflation, Markit note states: "Both the gauges for input costs and output prices rose higher into expansionary range, indicating tremendous inflationary pressure. ...  "Policymakers mentioned rising commodity prices at the State Council executive meetings on May 12 and May 19. They issued instructions about stabilizing commodity supplies and prices. ... Inflationary pressure would limit the room for monetary policy maneuvering, which could hinder the economic recovery. Some enterprises began to hoard goods in response to rising raw material prices, while others suffered raw material shortages. Supply chains were also significantly affected.""


Per Markit, globally: "Higher employment also reflected companies' efforts to combat rising capacity pressures. Backlogs of work expanded at the fastest rate in 17 years, with stronger increases at both manufacturers and service providers. Demand outstripping supply also led to increased price inflation. Input costs rose to the greatest extent since August 2008 and output charges at the quickest rate on record (since at least October 2009)."

Two charts to illustrate the above trends:


5/6/21: Ireland PMIs for May: Booming Growth and Inflation Signals

 Both inflationary pressures and economic activity indicators are going through the roof in May, signaling a roaring run for 2Q 2021 growth. 

  • Manufacturing PMI for Ireland is up at 64.1 in May, compared to 60.8 in April. This is a historical high for the series, for the second month in a row.
  • Services PMI for Ireland moved up from April's 57.7 to May reading of 62.1. This marks third consecutive month of above 50 readings, with all of these being statistically above 50.0 line. 
  • Construction Sector PMI (data through mid-May) improved, but remains (at 49.3) still in the contracting activity territory. 
  • Markit's Composite PMI, based on Manufacturing and Services sectors activity indices, rose from 58.1 in April 2021 to 63.5 in May, setting a new all time high. Again, this is the third consecutive month of above 50.0 readings for the Composite PMI.
The chart above plots my own 3-Sectors Activity Index which is based on all three indices reported by Mrkit and uses Value Added contributions by each sector as weights. 3-Sectors Activity Index rose from 58.69 in April to 62.58 in May, setting an all time high. 

In line with robust economic growth, we are witnessing - just as is the case around the world - continued build up of inflationary pressures. Per Markit release: "Input price inflation accelerated for the fifth successive month in May, reaching the highest since July 2008. Manufacturers continued to see much steeper increases in input prices than service providers, although the differential narrowed in the latest period. Companies passed on higher costs to customers, with output prices increasing at a record pace in May (since September 2002)." Emphasis is mine.


Thursday, May 13, 2021

13/5/21: BRIC Composite PMIs April 2021: Recovery Fragile, Inflation Heating Up

April PMIs for BRIC economies show continued strengthening in the recovery in China and Russia, moderation in the recovery momentum in India and deepening collapse in the recovery in Brazil.

Since we are into the first month of the new quarter, there is not enough data to go about to meaningfully analyze quarterly dynamics. Hence, I am only looking at Composite PMIs:


PMIs in April run stronger, compared to 1Q 2021 averages for Russia (Services only), and China (Services and Manufacturing), while Brazil and India recorded deteriorating PMIs in both Manufacturing and Services, and Russia posted weaker Manufacturing PMI.

BRIC as a group underperformed Global PMIs in April in both Services and Manufacturing, although BRIC Services PMI in April was running ahead of Services PMI for 1Q 2021, and there was virtually no change in Manufacturing PMI for BRIC group in April compared to 1Q 2021 average. 

Global Composite PMI in April was 56.3, which is much higher than same period Composite PMIs for Brazil (44.5), Russia (54.0), China (54.7) and India (55.4).

Notable price pressures were marked in:

  • China: "At the same time, inflationary pressures remained strong, with input cost inflation hitting its highest since January 2017, while prices charges rose solidly".
  • India: "Supply-chain constraints and a lack of available materials placed further upward pressure on inflation. Input prices facing private sector companies rose at the sharpest pace in close to nine years. The quicker increase was seen among goods producers. Prices charged by private sector firms increased at the fastest pace since last November, but the overall rate of inflation was modest and much weaker than that seen for input costs."
  • Russia: "The rate of input cost inflation slowed in April to the softest for three months. That said, firms continued to pass on higher costs to their clients, as charges rose at the fastest pace since January 2019".
  • Brazil: "Meanwhile, input costs continued to increase sharply. The rate of inflation was the second-fastest since composite data became available in March 2007, just behind that seen in the previous month. Goods producers noted a stronger rise than service providers for the fifteenth straight month. Prices charged for Brazilian goods and services rose further, stretching the current sequence of inflation to nine months. The upturn was sharp and the fastest in the series history. The acceleration reflected a quicker increase in the manufacturing industry".

Monday, May 10, 2021

10/5/21: Ireland PMIs for April: Rapid Growth and Inflation Signals

Ireland's PMIs have accelerated across all two key sectors of Services and Manufacturing in April, while Construction Sector continued to post declining activity (through mid-April).

Irish Manufacturing PMI rose from 57.1 in March to 60.8 in April as larger multinationals boosted their activities and increased pass-through for inflation. This marks third consecutive month of increasing PMIs for the sector. Meanwhile, Irish Services PMI rose from 54.6 in March to 57.7 in April, marking second consecutive month of above 50 PMIs readings. 

In line with the above developments, official Composite PMI rose from 54.5 in March to 58.1 in April. 

Irish Construction Sector PMI, reported mid-month, was at 30.9 (significantly below 50.0, signaling strong rate of contraction in activity) in mid-April, a somewhat less rapid rate of decline relative to mid-March reading of 27.0. All in, Irish Construction Sector PMI has been sub-50 for four consecutive month now.

In contrast to Markit that publishes official Composite PMI, I calculate my own GVO-shares weighted index of economic activity across three sectors: my Three Sectors Index rose from 55.0 in March 2021 to 58.3 in April. 


In terms of inflation, Services PMI release states that "Cost pressures remained strong in April, linked by survey respondents to labour, insurance, fuel, shipping and UK customs. The rate of input price inflation eased slightly from March's 13-month high, however. To protect profit margins, service providers raised their charges for the second month running. The rate of charge inflation was the strongest since February 2020, albeit modest overall." The indications are that Irish services firms are operating in less competitive environment than their global counterparts, with stronger ability to pass through cost increases into their charges. However, this feature of Irish data most likely reflects the accounting complexity within major multinationals trading through Ireland. 

Similar situation is developing in Manufacturing: "Supply chains remain under severe pressure, with longer delivery times owing to new UK Customs arrangements, transport delays and raw materials shortages. These factors, combined with strengthening demand, are leading to a heightening of inflationary pressures. Input prices increased at their fastest pace in ten years, while output prices rose at a series-record pace."

All in, we are witnessing signs of continued inflationary pressures across a number of months now, with even multinationals - companies using Ireland as primarily a tax and regulatory arbitrage location for their activities - feeling the pressures. This is an indication that inflation is building up globally and, as time drags on, starting to feed through to final prices of goods and services.


10/5/21: COVID19: Nordics v Sweden

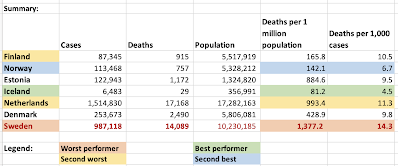
Updating data on comparatives between Sweden (the 'natural experiment' for 'Covid19 is just a flu' crowd, albeit the pandemic was not treated as such in the country itself) and the Nordics.

Note: I define three groups of 'Nordics' by composition.

First, for completeness: case counts:


The above is self-explanatory, but open to arguments concerning diagnostics and tests accuracy. Hence, let's take a look at deaths counts, which are much harder to 'fudge' for the 'Covid19 is a flu' crowd:


In simple terms, Sweden's policy approach to the pandemic, as contrasted by other Nordics, has resulted in 

  • 6,137 deaths in excess of Nordics 3 group (Finland, Norway, Estonia, Iceland, the Netherlands and Denmark)
  • 11,219 more deaths than (population-comparable) Nordics 2 group (Finland, Norway, Estonia, Iceland), and
  • 12,512 deaths in excess of Nordics 1 group (Finland and Norway).
Here are country-by-country comparatives: 


9/5/21: COVID19: U.S. vs EU27 comparatives


Updating data for the U.S. - EU27 comparatives for the pandemic through this week (week 17):


Table above reflects several major features of the recent data evolution for the Covid19 pandemic in the U.S. and the EU27, also highlighted in the charts below:
  • Firstly, total number of new cases has diverged in recent weeks. Starting with week 7 of 2021, the U.S. cases continued to fall, while the EU27 cases entered a new upward trend. The new wave - Wave 3 - formed in Europe, whilst the U.S. managed to escape development of Wave 4.
  • For eleven of the last consecutive weeks, the EU27 cases significantly exceeded those in the U.S.
  • As of Week 12, 2021: EU27's Wave 3 has peaked and we have now witnessed five continuous weeks of declines from the peak, although the EU27 case numbers still substantially exceed those in the U.S.
  • There is only one attributable difference between the two countries that can explain this divergence: vaccinations rates. In fact, whilst the U.S. response to the pandemic in its first 10 months has been an unmitigated disaster, the EU27's unroll of the vaccines has been a Trumpesque-level failure of its own. 


As the result of the above factors, EU27 trends in deaths numbers are equally concerning:
  • The EU27 started 2021 with a significantly lower per-capita death rate than the U.S. 
  • At the start of January, as reported on this blog, adjusting for age differences and population size differences, the U.S. pandemic was associated with 139,188 excess deaths compared to the EU27.
  • At the end of this week, this gap was down to 87,598.
  • Put differently, President Trump's policies were responsible for excess deaths amounting to roughly 1/3 of the total deaths sustained in the U.S. over the period of 2020. Since the start of 2021, EU27 policies on vaccinations are responsible for closing this gap by almost 40 percent.
  • The above comparatives for vaccination roll out failure effects are conservative. The EU27 has suffered Wave 3 of the pandemic amidst strict and wide-ranging lockdowns, not comparable to the U.S. measures deployed over the same period of time. 
  • In fact, Week 17/2021 U.S. deaths counts are now lowest for any week since week 27/2020. In contrast, the Eu27 deaths are currently the lowest since week 45/2020.

Tragically, for the EU27, European rates of mortality from the virus have been running above those in the U.S. every week since Week 43/2020, as shown in the chart below:

In fact, as the chart above illustrates, EU27 is yet to see the return to its lowest recorded mortality rate of 0.014 set in Week 37/2020, while the U.S. has been running below that rate on-trend over the last five weeks.

Chart next show the dramatic difference in mortality per case in the U.S. and the EU27 (vertical axis) against the world-wide mortality (horizontal axis), without adjusting for age and population size differences (a note of caution: regression lines are only indicative, at best):


In summary, therefore, the EU27 is paying a high price for its utter failure to unroll vaccinations at scale. The U.S. performance, starting with February-March, has been exemplary compared to the European policy approach, although a lot of the gains made so far are:

  1. Subject to forward uncertainty (U.S. weekly statistics have been exceptionally volatile and hard to interpret); and
  2. As of yet, not enough to erase the scars left by the Trump Administration's mismanagement of the early stages of the pandemic.

Sunday, May 9, 2021

9/5/21: COVID19: BRIICS

 Updating data for BRIICS for Covid19 pandemic through Week 17 of 2021 (current week):


Almost half of all cumulated cases within the BRIICS (Brazil, Russia, India, Indonesia, China and South Africa) group are now in India (above) and almost half of all deaths are in Brazil (below).


The pandemic dynamics have turned decisively in recent weeks: in terms of new cases, India dominates the trend up, with all other BRIICS showing amelioration in the pandemic:


Similarly, for we weekly death counts:

China data remains utterly unbelievable and hard to trust.

Summary table of recent developments:


India's pandemic dynamics are shocking, horrific and show no signs of abating. This is a humanitarian disaster that requires help from the rest of the world - help that has been coming in too-little and too-late.