Let's put together three areas on the geopolitical and economic map:
- Ukraine
- Latin America
- Central Asia
What do we have?
A conflict theatre that pitches against each other: Russia, Europe, China and the US. This conflict is drawn across both geopolitical and economic spheres and is, largely, fought via PR and finance. It is, however,
a conflict that continues to shift the global balance of power East and South, away from its traditional focus on the West and North.
Let's take a look at all three theatres of the conflict. Keep in mind that in 2013, Russian total energy output grew by 1.5% y/y to rise to 15% of the global output. This represents the largest combined oil & gas output in the world. In natural gas, Russia supplies 22% of the world total. But… and there is a proverbial 'but'… US gas output is growing and US exports of LNG are growing too.
Ukraine: Europe's Push Point
Ukraine is a clear battlefield relating to the energy supply security for EU and gas (less so oil) exports for Russia. We have been here before: most recently in 2006 and 2009, but back then Ukraine was much more independent of the EU and thus Russian-Ukrainian gas price conflict at the time did threaten to disrupt supplies of gas to Europe. This time around, Ukraine has no teeth and Russia needs gas flows, so no one West of the Uzhgorod is losing much of sleep. This sense of security is reinforced by the fact that Moscow needs sales, as Russian economy is running in the red, as opposed to 2006. 2009 was, of course, different in this sense. Another footnote to this is that in the medium term, Europe has plentiful stored reserves of gas: some 65% of its gas storage capacity into early summer is full. This is a record high, allowing EU to do some sabre-rattling vis-a-vis Russia.
In addition, EU currently holds the trump cards when it comes to completion of the South Stream pipeline. This point is very significant. South Stream can provide meaningful diversification for transit of gas into Southern European markets, currently being serviced via Ukraine. South Stream capacity is set at 63 billion cubic meters (bcm) per annum, in excess of 55 bcm capacity of Nord Stream 1 & 2 which is up and running. There are problems with capacity utilisation on Nord Stream which are down to EU regulations. The same is threatening the South Stream plans (although the EU has exempted from the said regulations the Turkish pipeline, while it is unwilling to grant an exemption to Russians).
Source: Expert.ru
EU gas imports from Russia currently run at around 1/3 of total european demand, and cost ca USD53 billion per annum. Total volume of gas sales to EU from Russia was 138 bcm in 2013 at an average price of USD387 per thousand cubic meters (mcm) or USD10.50 per million British thermal units (therm). Currently, around 15% of Russia's Federal budget comes from gas exports and Europe is by far the largest market for Russian gas. This underpins medium-term Russian dependency on Europe. But it also underpins medium-term dependency of Europe on Russia: replacing Russian gas in any meaningful quantities will be costly. According to Bloomberg report (
here) from earlier this year, "Benchmark U.K. prices would need to rise 127 percent to attract liquefied natural gas if Europe had to replace all its Russian fuel for two summer months". That is
only for summer months. Furthermore, "The EU would need to pay as much as 50 percent more to replace that with a combination of LNG, Norwegian gas and coal, according to Bruegel, a research group in Brussels."
Source: Bank of Finland, 2014.
So with power to block South Stream (primarily by pressuring EU member states through which it will pass), the EU holds some serious tramp cards against Russia. These states are: Bulgaria (which was the first signatory to South Stream construction project back in January 2008, just 5 months after South Stream MoU was signed between Eni and Gazprom; Hungary (which signed an inter-governmental agreement on South Stream at the end of February 2008), Slovenia (in South Stream partnership since November 2009) and Croatia (since March 2010). Interestingly, Austria signed a legally binding agreement to build South Stream section (50km) via its territory on June 30th (Russian version
here). The EU Commission has engaged in very heavy-handed 'diplomacy' bordering on bullying when it comes to those countries (namely Hungary, Austria, Bulgaria and Slovenia) which have been at the forefront of progressing the South Stream project. But their position is reinforced by both necessity and expedience. Neither the South Stream countries, nor Germany and Italy want to see continued EU dependence on Ukraine as transit route. Despite all the Ukrainian claims to the contrary, this transit has been less than reliable both due to Russian position vis-a-vis Ukraine and Ukraine's position vis-a-vis Russia. On expedience side, transit fees for Russian gas are lucrative to many Balkan countries and South Stream involves partnership with Italian Eni and French EDF - both of which have massive political and economic clout.
Still, Ukraine is clearly attempting to drive a wedge between EU and Russia when it comes to gas transit. Kyev has offered to construct own pipelines to transport Russian gas, in a JV with European countries (who, presumably, will fund this programme). See a report on this idea
here. And Russia considered (albeit did not follow through with it) responding in-kind: South Stream economics would significantly improve if it were to go
sea-route from Crimean land mass. However, to-date Russia has not indicated officially it is interested in this re-routing).
Russia has another, albeit more limited alternative. In April 2013, Gazprom was instructed to restart the Yamal-Europe-2 gas pipeline bypassing Ukraine, via Belarusian border to Poland and Slovakia. This was scheduled to be completed by 2019, but we can expect some acceleration in the project later this year. This will add only 15 bcm to Yamal-Europe-1 pipe that currently has capacity of 33 bcm. Beefing shipments via Belarus in the future is an alternative. It involves added costs and uncertainty for Russia too. On costs side, Belarus is heavily dependent on Russian energy subsidies and this dependency can be amplified if it serves as a more important gas transit conduit. Russia, weary of its Ukrainian experience - the never ending double-play by transit countries of EU against Russia in gas politics - is not too keen on switching Ukrainian routes to Belorussian. And on risks side, there is Poland with staunchly Russo-sceptic politics and insistence on ownership of transit infrastructure that potentially makes Russian gas hostage to Warsaw.

Source: American Enterprise Institute, 2013
On to Central Asia
All of which means that Russia is looking for diversification away from the European markets for its gas. Earlier this year, China provided a convenient outlet. China accounts for 22.4% of world's energy consumption and it signed a Chinese-Russian 30 year, USD400 billion (plus options) gas deal this May (I covered the deal
here). China is also engaged in Bazhenov super-field exploration development (see my earlier note on this
here). Both are mega-deals, beyond any doubt. But China will be buying (in first stages) only 38 bcm of gas from Russia.
The reason for this is that China has been also gradually diversifying its sources of supply. This year, China will purchase over 45% of its imports of natural gas directly from Central Asia, according to BP. Turkmenistan ships around 25 bcm of gas to China, Kazakhstan and Uzbekistan ship 2.9 bcm and 0.1 bcm. The latter has capacity to increase these shipments by 50 fold by 2015-2016. Turkmenistan holds a 65 bcm supply deal (by 2020) with China. And China is completing two pipelines linking it to Central Asia this year (see
here). Combined Central Asian pipeline capacity by 2015 will be running at 55 bcm - same as South Stream. And in December, China will launch construction of line D which is expected to be in full operation by 2020.
On the surface, this looks like China is aggressively shifting toward increasing its share of imports from Central Asia, but even with line D fully running, the target is for Central Asia to ship about 40% of China's overall imports demand for natural gas - a small decline on current share of Chinese imports. Still, China's aggressive move into Central Asia puts a bit of a chill into Russia's regional power base there. And it happened over the last 7-8 years, just at the time as Russia has been focusing increasing attention on its European border. In fact, Russian global position can be described as being under double-pressure: in the West by the EU and Nato and in the East by China - all actively moving into Russian 'near-abroad' and both actively pushing Russia into defensive position with respect to its traditional or historical economic and political allies.
This is best exemplified by Turkmenistan which used to depend almost entirely on Russian gas infrastructure and sales capacity to export its gas. The country has the sixth largest proven natural gas reserves in the world (at 7.5 trillion cubic meters) and is the second largest dry natural gas producer in Eurasia. Turkmenistan is continuously increasing its proven reserves: between 2009 and 2011 these rose 2.8 times. Since 2006, the Government has focused on diversifying its exports outside the markets supplied by Russian infrastructure. Turkmenistan exported some 42.48 bcm of natural gas in 2012, of which 52% went to China, 24% to Russia and 22% to Iran.
Crucially, from China's point of view, Beijing owns the Turkmen infrastructure: it has effectively full ownership of the pipelines and it built the USD600 million gas processing facility at the Bagtyyarlyk gas field (plant capacity is 8.7 bcm per annum). China also built the first plant at the field back in December 2009 and Chinese investment in the field runs around USD4 billion and rising. In June, the Government launched construction of another processing plant at the super-giant Galkynysh field (world's second largest gas field). Turkmenistan is also heavily pushing for a Trans-Caspian pipeline with a link to Trans-Anatolian pipe which would give it access to European markets. The EU has indicated already that the pipeline will be exempt from the European regulations relating to the Third Energy package, the same regulations that are effectively cutting Russia's Nord Stream capacity by a half and are threatening the derailment of the South Stream.
Russia's response to the Central Asian challenge is to push for more business on its Western and Eastern flanks. Azerbaijan is currently in negotiations with Moscow to join the Eurasian Economic Union. Based on economic analysis (see
here) the EEU offers significant trade and trade diversification opportunities for Azerbaijan, but it will also harmonise energy policy, reducing Azerbaijan's clout in terms of accessing the EU markets. The major sticking point, however, is Azerbaijan's ongoing 'cold' war with Armenia in which Russia backs Yerevan and Turkey backs Baku. However, there are rumours that Russia is trying to bypass this issue by negotiating simultaneous accession of Armenia and Azerbaijan into EEU. Although these are just rumours. Officially, Azerbaijan was
not (yet) invited to join. For now, Azerbaijan is
playing both sides of the Russia-West divide but how long this game can go on is a huge question. The country is pivotal for transit routes for Trans-Caspian gas to Europe and it is a major player in Central Asian developing links to Turkey. Europe is keen on incentivising (or de facto geopolitically bribing) Azerbaijan to shift toward its orbit and Turkey is keen to play the leadership role in this game. Georgia - the dealing of the West in the region - is also keen on drawing Azerbaijan into Western orbit, as it hopes to act as a bridge between oil and gas rich Caspian and cash rich Europe via the Black Sea routes.
In recent months, EU and US both stressed the importance of Azerbaijan to energy security in Europe. In April, US Secretary of State, John Kerry, declared Azerbaijan to be "the future of European energy" despite the obvious fact that even if Azerbaijan gains access to European markets via TANAP and TAP pipes linking it (via Turkey) to Austria and Italy the combined pipelines capacity will be around 30 bcm per annum. EU consumes roughly 460 bcm of natural gas annually. The 'future of European energy' is a source of no more than just 6% of the European demand. Not that absurdity of exaggerated claims ever stopped Mr. Kerry from making them in the past. Incidentally, the EU and US both have brushed aside significant security concerns relating to putting two major gas pipes through the region that is ripe with risks of terrorist threats.
Source:
http://www.tagesschau.de/wirtschaft/nabucco-aus100~magnifier_pos-1.html
From Central Asia to Broader Asia
So Russia is forced into a defensive position in Central Asia, just as it is being forced into a defensive position o its Western borders. Russian response to-date has been two-pronged:
- Engage China into broader cooperative inter-links via BRICS; and
- Find new geopolitically strategic markets.
In terms of new geopolitically and economically lucrative markets, Russia has been looking both at the BRICS and elsewhere.
On the latter front, recent move (April 2014) to cancel 90% of the Soviet-era North Korean debt and engagement with the country in trying to open transit routes to Korea show Moscow's interest in driving gas and oil exports out to the wealthier Southern Korean markets, currently reliant on excruciatingly expensive LNG shipments (97% of total energy needs of the country are imported). Russia is planning to invest some USD1 billion in North Korea, amongst other things, building a gas pipeline to South Korea.
Beyond this, there is Japan. Per
Bloomberg report a group of 33 Japanese lawmakers have backed a 1,350 kilometer USD5.9 billion (estimated cost) pipeline connecting Russia’s Sakhalin Island and Japan’s Ibaraki prefecture. Pipe capacity: 20 bcm or just over half the Chinese deal Russia signed. This pipeline, if completed, would supply up to 17% of Japan’s imports, but more importantly, open up Sakhalin fields access to a huge market. Cost savings for Japan and Korea can be sizeable. Russia-China deal was priced at around USD10.50-11 per therm, as opposed to the LNG priced at USD13.3 at around end of May (down from USD19.7 back in the winter 2014).
And then there is India, the 3rd-largest oil importer in the world after the US and China, with forecasts showing the country becoming world's largest importer by 2020. Worse, with prices sky-high and its economic growth heavily dependent on energy-intensive services sectors, India is now facing an energy crunch.
Russia has been negotiating with India the most expensive pipeline deal in history: a USD30 billion oil pipe linking Russia’s Altai Mountains to the Xinjiang province of China and northern India. Oil is a different equation for Russia (the country exports 70% of oil output against 30% of gas output and Federal revenues are more dependent on oil than on gas.
In 2012, 52% of Federal revenues came from exports of energy carriers, with gas supplying around 1/3rd of this. Still, pressure is rising. Russia's 2014 budget is balanced at around USD115-117 per barrel, which more than 5-times higher than 2006 when its budget balanced at around USD21-22 per barrel. In its revised Budget plan for 2014, based on performance over January-April 2014, Russia expects federal budget revenue of 14.238 trillion rubles (an increase of 668.3 billion rubles compared to the previously published budgetary estimates). This includes additional oil and gas revenue of 1.567 trillion rubles, up 952.1 billion rubles on previous. Moscow expects a federal budget surplus of 278.6 billion rubles in 2014. On the other hand, Russian Government actual revenues rose 10 % y/y in Q1 2014, primarily due to foreign exchange effects of ruble devaluation (dollar up, dollar revenues from exports translate into more ruble revenues). Which means that, assuming the price of Urals-grade crude stays at USD104 per barrel and if ruble/dollar exchange rate stays at around 35.5 rubles to the dollar (ca 10 % devaluation on 2013), then Russian federal budget is likely to show a forecast surplus despite lower economic activity.
Back in October 2013, India and Russia reiterated that they will continue collaborating on developing direct ground links for oil and gas transports. Indications are, the issue was mentioned at the latest BRICS summit. India imports ca 35% of its gas consumption. Interestingly, in this area, Russia can squeeze out Turkmenistan. The proposal for a USD9 billion
Turkmenistan-Afghanistan-Pakistan-India gas pipeline is currently finding it difficult to raise funding and sign a consortium lead. The project ran pitches in London, Singapore and New York but failed to attract an international major to join. India is now looking to Russia for developing a gas pipeline, similar to the oil pipeline, via China. India is already linked into Russian oil and gas industry. Back in 2011, Indian FDI into Russian energy sector totalled USD6.5 billion, with USD2.8 billion invested in Sakhalin-1 and is seeking a stake in Sakhalin-3. India is also looking to invest some USD1.5 billion in the Russian Yamal peninsula. Yamal holds one-fifth of global natural gas reserves. Last, but not least, India is trying to get off the ground gas liquefaction offshore projects in Russia for shipments to Indian market.
Source:
http://www.dailykos.com/story/2009/10/29/798609/-Building-A-Pipeline-Energy-Politics-In-Afghanistan
Here is a far-reaching possibility: India, Russia and China creating a joint/shared infrastructure system that links Russian and Central Asian oil and gas to India and China. The net losers in such a scenario will be the US (due to lower cost of LNG in Asia-Pacific), Australia (major supplier of LNG to Korea and China) and Europe. Azerbaijan, on the other hand, is likely to link up with the BRICS-led transport network, although it might require the country to sign up to the EEU.
BRICS: The Flavour of the Month
Which, naturally brings us to BRICS. This week, we had a BRICS summit and Vladimir Putin's visit to Latin America. Both played a central role in shaping the evolving Russian geopolitical strategy. Firstly, the trip and the summit shows that Russia is not a regional power (as President Obama claims), but a global player (as Russia claims). Via twin track approach: BRICS + disenfranchised states provide exactly this platform. Hence we saw Cuban visit and cancelation of 90% of the (completely un-recoverable) Cuban debts. We also saw Argentina talks, which yielded major nuclear power contract: Rosatom will build two new power generation units. There were also talks about development of Argentinian shale gas deposits.
Secondly, BRICS summit is now set to remain neutral on the issue of Ukraine. With BRIC leaders abstaining from criticising Russian position, President Putin achieves two goals:
- puts Russia into a major international decision making arena without having to deal with the issue of Ukraine; and
- shows to the West that US and EU cannot automatically count on emerging economies falling into their orbit on geopolitical issues.
Thirdly, Putin's initiative for creating a BRICS-based
development bank strengthens the BRICS cooperation and moves it toward a tangible financial and policy commitment. The same goes for a reserve fund.
On geopolitical side of things, Russia, India and China are already facing common security considerations (as well as some growing economic interests) in Afghanistan. The countries have raised a possibility of setting up a trilateral framework of cooperation there and this is also likely to feature in their discussions in Brazil, although don't expect to see it in the official reports. And BRICS are getting more active in the Latin American neighbourhood. BRICS held a meeting with
Unasur organisation and leaders of a number of Lat AM countries.
On trade side, President Putin and Brazil president Dilma Rousseff have confirmed their objective of doubling the bilateral trade between the two countries to USD10 billion dollars per annum from current (2013) USD5.56 billion. The original target was set three years ago.
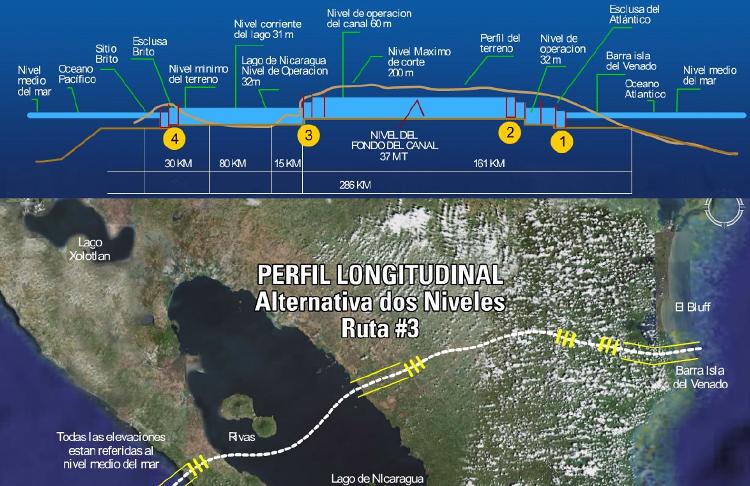
Elsewhere, in June, Russia and Nicaragua confirmed Russian engagement with the Chinese-led plan for
Interoceanic Grand Canal. Construction is expected to start by the end of 2014. The IGC will be 286 km long (Panama Canal is 81.5 km), have width of 83 meters and depth of 27.5 meters. This will make it suitable for long-range ships with a deadweight of up to 270,000 tons. The cost of which is estimated at USD30-40 billion.
Source:
http://www.qcostarica.com/wp-content/uploads/2014/02/Canal-Nicaragua.jpg
Conclusions:
The last point ties in the BRICS dynamics with Russia's economic push East. China is becoming a major partner in a number of Russia-linked initiatives, including those that are of greater benefit to Beijing than to Moscow (e.g. the IGC). In effect, Russia is gradually building up mutual inter-dependency with China in Latin America, Central Asia and, via the Northern Passage (the sea route to Europe via Russia's Arctic waters) in Europe. This process is in its early stages, but it is a part of the emerging long-term strategy that can lead to significant re-orientation of global politics and, to a lesser extent, economics. Further ahead, beyond the bilateral agreements, Russia, India and China are sitting at the centre of the vast and rapidly growing infrastructure-light markets for energy and transport. Joint co-development of this infrastructure, especially pairing transport of energy with transport of goods and other commodities, suits all regional powers well. This is similar in nature to, but more massive in scale than the ongoing emerging cooperation between China and Russia in Central and Latin America. It does not suit the West.
So Ukraine is a flashing point of the old battlefields. It is still 'hot' but it no longer matters as much as Kiev and Brussels want it to matter. From here on, keep an eye on Latin America, Central Asia and Asia-Pacific for the places where Russian strategy is going to play out next, this time around with BRICS most likely alongside Moscow. The core driver for this change is not Russian 'nationalist revival' or Kremlin's 'aggressive aspirations'. Instead it is the force of the pince-nez squeeze of Western geopolitical pressures on Russia on its Western flank and Chinese demand for natural resources on the Eastern flank that is driving Russia to a reactive, not pro-active strategy. That this strategy is defensive is clear from its reactive and lagged nature. That this strategy is getting now active is clear from the geographic reach it assumed in recent months.


