Saturday, November 17, 2012

17/11/2012: A tradeoff Ireland does not have an option of facing


"Banking Competition, Housing Prices and Macroeconomic Stability" by Oscar Arce and Javier Andres (The Economic Journal, Vol. 122, Issue 565, pp. 1346-1372, 2012 | http://papers.ssrn.com/sol3/papers.cfm?abstract_id=2174836):

The paper develops a macroeconomic model "with an imperfectly competitive bank‐loans market and collateral constraints that tie investors’ credit capacity to the value of their real estate holdings".

The model shows that "lending margins are optimally set by banks and have a significant effect on aggregate variables." [Something that can be potentially magnified by the market structure, such as, for example duopolization of the market, as in the case of Ireland today].

"Fostering banking competition increases total consumption and output by triggering a reallocation of available collateral towards investors." In other words, that 'creative destruction' works - flows of collateral are made more efficient by a competitive banking system.

"Also, stronger banking competition implies higher (lower) persistency of credit and output after a monetary (credit crunch) shock."

"In the short‐run, output, credit and housing prices are more responsive on impact to shocks in an environment of highly competitive banks." "…Key to this last result is the reaction of housing prices and their effect on borrowers' net worth. The response of housing prices is more pronounced when competition among banks is stronger, thus making borrowers' net worth
more vulnerable to adverse shocks and, specially, to monetary contractions."

"Thus, regarding changes in the degree of banking competition, the model generates a trade-off between the long run level of economic activity and its stability at the business cycle frequency."

Of course, the problem for Ireland in the current crisis is that
1) we have an ongoing monetary crisis (with interest rates and FX rates policies out of synch with the economy needs);
2) a solvency crisis (debt overhang); and
3) a liquidity crisis

We are also experiencing a dramatic collapse of competitive forces in the banking sector just when we would hope for the competition in banking to start generating those efficiencies in funding allocations and thus sustaining recovery.

In other words, we have - per paper above - the worst of both worlds, we neither had a cushion of the rigid downward shocks responses in the economy going into the crisis, nor do we have the salvation option of using a competitive banking system to drive up recovery. All that, plus no controls over monetary policy.

And we are still hearing the drivel about a 'Lost Decade' for Ireland? Try decades...

17/11/2012: Flat tax and economic efficiency


A new paper on flat tax systems, "Flat Tax Reform in an Economy with Occupational Choice and Financial Frictions" by Radim Boháček and Jozef Zubrický, (The Economic Journal, Vol. 122, Issue 565, pp. 1313-1345, 2012 | http://papers.ssrn.com/sol3/papers.cfm?abstract_id=2174793).

The paper modeled a flat tax and capital tax reforms "in an economy with occupational choice and borrowing constraints. [The paper introduces] entrepreneurs as an occupation… [and compares] steady state allocations [between] a progressive tax schedule [and] steady states with a flat tax at different exemption levels with or without a capital tax reform. [The authors] find that for low exemption levels the flat tax reform is efficient as well as welfare improving for both occupations."

This is quite interesting, since in traditional flat tax literature, there are usually welfare gains to entrepreneurs and welfare losses to employees (of smaller magnitude than gains to entrepreneurs, so overall system of flat taxes is welfare enhancing for the economy as a whole).


17/11/2012: China's Great Famine


This is a book everyone must read - a historical account of China's Great Famine 1958-1962 wholly created by the biggest mass-murderer in human history - the Communist ideology. 

One reviewer wrote: "Tombstone is the most important, most exhaustive work ever written about the tragedy. It opens a new window on what happened with research we’ve never had access to, bolstered by first-hand accounts by Chinese memoirists."

A review from the Boston Globe (here) is worth reading as well.

Friday, November 16, 2012

16/11/2012: FTT - two bits of new evidence


Financial Transactions Tax news:

First we have new research from the Bank of Canada (link here) stating:
"Little evidence is found to suggest that an FTT would reduce speculative trading or volatility. In fact, several studies conclude that an FTT increases volatility and bid-ask spreads and decreases trading volume. Furthermore, a number of challenges associated with the design and effectiveness of an FTT could limit the revenues that FTTs are intended to raise. For these reasons, countries considering the
imposition of FTTs should be aware of their negative consequences and the challenges involved in implementation."

And next we have early stage evidence from just a few months of FTT operations in France: here.

I wrote on the topic of FTT for a number of years now. Here's an article from 2010. Here's more from 2010. And more on the blog. I am also working with two co-authors on a comprehensive literature review of the FTT, which so far is not going well for supporting the idea of FTT.

Stay tuned.

Updated: and here's a SoberLook take on the French experience with FTT. Paragraph below the quote explains the little French problem... oh, well, it's a War on Speculators, then.

16/11/2012: Russian economy Q3 2012


In contrast with contraction (-0.1%) in the Euro area (see my note on Dutch woes here), Russian economy grew 2.9% in Q3 2012 - slightly ahead of consensus expectations (2.8%). However, Q3 growth marked the slowest pace of expansion since Q1 2010. Main drivers of growth performance were:

  • Private consumption remaining on slower growth path
  • Declining growth rate in investment (on monthly basis, September data showed surprise decline of 1.3% in overall investment - the first contraction since Q1 2010)
  • Industrial production increased 2% y/y in September, almost unchanged from August 2.1% rise. However strong PMI data for October should provide some boost.
  • Weaker demand for agricultural commodities was a drag on exports, alongside shallower demand for extraction sectors exports.
The net effect is that slowdown in consumer demand growth and capex are likely to adversely impact Irish exports to Russia. However, I don't foresee significant or prolonged effect here. More on bilateral trade flows to follow in subsequent analysis, so stay tuned.

Update: 

Thursday, November 15, 2012

15/11/2012: Dutch Debt Crisis and a Tripple-dip Recession?


With Eurostat publishing today preliminary estimates for Euro area GDP for Q3 2012, the Netherlands have moved firmly into the view as the country with substantial pressure on its economy.

Take a look at the core numbers:

  • In Q3 2012, the Dutch economy contracted 1.1% q/q - the sharpest quarterly contraction in all fo the EU27
  • This contraction follows 0.1% growth in Q2 and Q1 2012 and a contraction of 0.7% in Q4 2011
  • In other words, in q/q terms, the Netherlands are now heading for a tripple-dip recession.
  • In year on year terms, things are bleaker still: Q4 2011 say annual contraction of 0.4%, which was followed by a 1.0% drop in Q1 2012, 0.4% decline in Q2 2012 and now 1.4% decline in Q3 2012.
The problem the country faces, despite having a AAA-rated government debt and relatively minor issues on the fiscal side, is the debt overhang in the household sector. As charts below show, the Netherlands has the second highest gross debt/GDP ratio in the EU27 and the highest in the euro area. The debt overhang in the household sector is getting worse, not better, during the current crisis.


Gross debt to GDP ratio on households side has the same (directionally, but potentially more severe in magnitude) effect on future growth as the Government debt. Based on the OECD and IMF data:


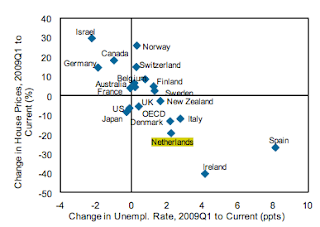
And here are some comparatives from Goldman Sachs Research, highlighting the Netherlands plight:

 Note: HP change refers to House Prices change


All of which makes the Netherlands a 'sick man' of Europe and helps explain why the Dutch Government is rightly concerned with the costs of underwriting peripheral economies 'rescue' using its own money...

15/11/2012: The impossibility of Greek 2020 targets


Euromoney headlines today with an article on the impossibility of 120% debt/GDP ratio target for Greece (link here). It so happens that few days ago, I crunched through my own estimates on Greek debt holdings and dynamics. The below is based on data from:

  • Goldman Sachs Research (debt allocations)
  • IMF WEO
  • My own scenario 2 for growth shock
Here are the institutions holding Greek debt: 

Using IMF scenario (best case scenario, based on current 2013-2017 growth projections and 2018-2020 growth at 2017 growth rate of 4.586% nominal - representing the highest annual rate projected by the IMF for 2012-2017) and my own adverse scenario (assuming growth of 2.84% on average annually in 2014-2020 as opposed to the IMF assumed average growth of 3.59% on average), the table below shows summary of forecasts for 2020 debt outrun under:
  1. Status quo - implying 2020 outrun of 137% debt/GDP ratio in the case of IMF own projections and 148.5% debt/GDP ratio in my scenario 2;
  2. Case of imposing 75% haircut on ECB-held Greek Government debt (a writedown of €33.52bn) resulting in IMF-consistent scenario estimate of 123.2% debt/GDP ratio in 2020 and 134.1% debt/GDP ratio under my adverse growth scenario 2;
  3. Case of imposing - in addition to a 75% writedown of ECB-held debt - a writedown of 25% of EFSF-held Greek debt, delivering savings / cuts to the debt of €62.74bn - and yielding 2020 Government debt/GDP ratio of 111.2% in the case of IMF projections for growth (scenario 1) and 121.4% in the case of my scenario 2.

Thus, the bottom line is: unless 
  1. IMF projections for 2.84% average growth in 2014-2017, plus my assumption that in 2017-2020 Greek economy were to growth at the 2017 IMF-projected 4.59% hold, a 75% haircut on ECB-held Greek Government debt will not be enough to get Greek Government debt/GDP ratio anywhere close to 120%.
  2. To ensure probabilistically likely delivery on 2020 target of 120% debt/GDP ratio, Greece requires much more than a writedown of 75% of its ECB-held liabilities, but will most likely require some sort of action on EFSF side as well.

Tuesday, November 13, 2012

13/11/2012: Irish CPI v Euro Area: September 2012


In the previous post I covered overall dynamics of Irish consumer prices in October. Now, let's take a quick look at comparatives across the euro area. These are reported by the CSO with one month lag, so all we have is September 2012 year on year changes in prices. For comparative reasons, I also put y/y changes in prices for January 2012. The chart below shows the difference between Irish inflation and euro area overall inflation, with positive numbers signifying by how much Irish CPI changes in specific category exceeds euro area overall CPI changes for that category. Negative numbers show by how much euro area CPI changes exceeds Irish CPI changes.


Of notable trends/patterns:

  • Irish overall consumer price inflation HICP (2.4% annual in September 2012) was below that for the EA17 (2.6%) and below EU27 (2.7%).
  • Ireland also posted lower inflation in September in Food and-alcoholic beverages, clothing and footware, Furnishings, household equipment and maintenance, Health, Recreation and culture, and Restaurants and hotels.
  • Ireland posted identical (to EA17) inflation in Alcoholic beverages & tobacco.
  • Ireland's inflation was in excess of that for the EA17 in Housing, water, electricty, gas & other fuels, Transport, Communications, education (by a massive 9.3 percentage points) and Miscellaneous goods & services.
  • Higher inflation rates in Ireland have accelerated in September, compared to January in only two categories: Housing, water, electricity, gas and other fuels, and Education.
In annual terms, Ireland is now in inflation territory since August 2010, with the peak rate of 3.11% in April 2011 and the current rate running at 1.20% - a modest inflationary environment, which means that our nominal GNP, were it to post 0% real growth is expanding at the rate closer to 1% nominally - a massive under-shooting of the rate of nominal growth required to deflate our debt pile.

13/11/2012: Consumer Prices in Ireland: October 2012

Consumer price index for October 2012, Ireland released last week chows broad continuation of the previously established trends, namely above-average inflation in state-controlled sectors, albeit the overall rate of the state-sanctioned rip-off of consumers is now moderating relative to previous months.

Overall CPI index dipped to 101.5 (2011 base year) in October compared to 101.6 in September, representing a mom change of -0.1% and y/y rise of 1.20%. 3mo average through October is at +0.36% rise on previous 3mo period and is up 1.60% y/y.

Charts below illustrate:

One thing is clear from the charts above: despite the economy still in trouble, cost of living in Ireland is now at the levels comparable with those attained in early 2008.

Looking at decomposition by broad category:

  • Price index in Food & non-alcoholic beverages category rose from 100.6 in September to 101.0 in October. The index is now up 1% y/y and 3mo average through October 2012 is 0.7% above the same period average a year ago.
  • Alcoholic beverages & tobacco prices index is slightly down from 103.7 in September 2012 to 103.5 in October 2012, but the index is still up 3.5% y/y and index 3mo average through October 2012 is up 3.57% on the same period a year ago. The index annual inflation was driven primarily by rises in price sof cigarettes (+6.9 y/y) and Other tobacco (+7.9% y/y)
  • Clothing and footware sub-category index is up from 99.5 in September to 100.5 in October. The sub-index is now up 1.01% y/y and its 3mo average through October 2012 is 0.64% ahead of the 3mo average for the same period in 2011. Garments were the only sub-category of goods in this category that showed y/y inflation (+2%), with other sub-categories posting deflation.
  • In Housing, water, electricity, gas and other fuels category, prices index rose from 96.8 in September to 98 in October, the index is up 1.24% m/m and is down 3.26% y/y. 3mo average through October is down 2.41% on a year ago. Mortgage interest posted a robust 18.1% decline y/y, but this decline is distributed unevenly with adjustable rate mortgages rising in cost, whiel tracker mortgages benefiting from ECB easy monetary policies. Meanwhile, largest y/y increases were recorded in Electricity (+8.7%), Gas (+9.3%) and Liquid fuels (+13.4%).
  • Furnishings, Household equipment and routine maintenance sub-index is down marginally from 97.4 in September to 97.2 in October. The sub-index is down 2.70% y/y and its 3mo average through October is down 2.53% y/y. Nine out of eleven sub-categories of goods and services posted deflation y/y in October.
  • Health prices index moderated from 100.4 to 100.2 m/m in October and is up only 0.3% y/y with 3mo average through October up 0.47% y/y. In Health, largest price increases in October in annual terms were in Other Medical Products (+2.9%) and Other medical and Paramedical Services (other than Doctors' fees) (+3.2%).
  • Transport sub-index fell significantly from 109.3 in September to 106.3 in October (down 2.74% m/m). However, the sub-index is still up 5.77% y/y and 3mo average through October 2012 is now up 7.34% on the same period of 2011. In Transport, largest increases in prices, annually, were in Petrol (+12.4%), Diesel (+11.1%), Motor Tax (+10.8%), Bus Fares (+9.2%), passenger Transport by Sea and Inland Waterway (+5.4%) and Combined Passenger Transport (+6.2%).
  • Communications prices sub-index moderated from 97.4 in September to 96.6 in October, down 3.40% y/y and down 2.67% y/y in terms of 3mo average through October. here, Postal services went up in price 1.5% y/y, while Telephone & telefax equipment and services were down in prices 3.6% y/y.
  • Recreation and culture prices sub-index rose from 98.7 in September to 99.2 in October, with an annual inflation registering at 6.73%. 3mo average through October was up 8.63% y/y.
  • Education costs rose at a monthly inflation of 4.6%, up 6.73 y/y in October to 104.6, while 3mo average through October 2012 was up 8.63% y/y. In education inflation was primarily diven by Secondary education (+2.5% y/y), Tertiary Education (+6.5%) and Education not definable by level (+6.6%).
  • Restaurants and hotels price index  was at 01.6 in October, down from 10.2 in September but still up 0.99% y/y, same rate of inflation as 3mo average through October 2012.
  • Miscellaneous goods and services sub-category price index rose from 104.2 in September to 105.2 in October and is up 5.62% y/y, with 3mo average through October 2012 up 5.40% on the same period a year ago. Here, health insurance costs were up 15.9% y/y and insurance connected with transport was up 4.7% y/y. Other services inflation run at 22.8% y/y in October.

 In terms of historical rates of inflation, charts below show current price indices for all main categories of goods and services relative to 1976 and 2007 readings.


Monday, November 12, 2012

12/11/2012: Quick reading list of late...


Some of my reading from today - worth checking out:

"Debunking Two Nate Silver Myths" from Scientopia.org lays our Bayesian foundations for Nat Silver's forecasting efforts. But in reality, the blog post deals with a deeper issue - the way we interpret predictive models.

"Mathematics, Marriage, and High explosives: Why There Is No Nobel Prize for Math" is a good short post on Shapley and Roth Nobel MP in Economics win, but the post repeats the myth (I am guilty of having told this one myself before) that is solidly debunked here.

A cool paper "The Collapse of the Soviet Union and the Productivity of American Mathematicians" - I recall the years of 1993-1997 when the UCLA maths department welcomed numerous faculty members from the former USSR and Eastern Block.

Foreign Policy superb article on the potential geo-political implications of the opening of the Arctic Passage: "Open Seas". The historical perspective absolutely brilliantly drawn.

NYTimes on "The science and art of listening" quote: "The difference between the sense of hearing and the skill of listening is attention" 

Aside from that - re-reading Vladimir Vonovich's "Moscow 2042" was a delight...

And I will be blogging on academic papers I read... so stay tuned.

Sunday, November 11, 2012

11/11/2012: 4 interesting charts on investment portfolia compositions


four charts showing differences between the euro area and US portfolia compositions prior to the crisis, during the crisis and now (via Morgan Stanley):

Households:

 So for households, US portfolia are relatively balanced at near 50:50 split on risk and 'riskless' sides. equity ownership is low by historical standards, but that is probably offset by higher exposures to government bonds, corporate debt, government bonds and commodities as well as funds. Lower deposits holdings compared to euro area suggest lesser precautionary savings.

On euro area side, we have dramatic long-term decline in equities holdings and structural rise in deposits and cash. Precautionary savings motive is very pronounced.

Pension Funds:

Charts below show different pattern for equities holdings in these funds against household trends above:


Interestingly, Euro area households and pension funds are relatively similar in terms of longer trend of equities holdings, suggesting that either the objectives of both types of investors are convergent (retirement expectations and demographics weighing heavily on both) or structurally, equities markets in Europe are simply not attractive to both types of investors.

Much to speculate about here... especially behaviorally...

11/11/2012: Property prices bust 2008-2012


House prices changes peak-to-2009 then 2009-present:


Via Goldman Sachs.

With core driver - fundamentals:


Note Spain (my analysis): fundamentals-driven house prices are yet to travel down to below Irish markets drop... This, of course, is not a precise fully deterministic model (feed-back loops from unemployment to house prices are also going from house prices to unemployment), but it is clear that Spanish property is still 'overvalued' grossly relative to fundamentals.

And here's some other 'bad' news:
Taking the comparative above (again, my reading of the chart), a combination of fiscal direction and debt levels implies Irish house prices are still overvalued by up to 20% or so. Spanish ones - by about 10-15%...

Full note here.

Note: these are not my forecasts. I am only pointing out the direction that the above figures above imply in my view for the property markets.