Showing posts with label Ireland consumer prices. Show all posts

Tuesday, November 13, 2012

13/11/2012: Irish CPI v Euro Area: September 2012


In the previous post I covered overall dynamics of Irish consumer prices in October. Now, let's take a quick look at comparatives across the euro area. These are reported by the CSO with one month lag, so all we have is September 2012 year on year changes in prices. For comparative reasons, I also put y/y changes in prices for January 2012. The chart below shows the difference between Irish inflation and euro area overall inflation, with positive numbers signifying by how much Irish CPI changes in specific category exceeds euro area overall CPI changes for that category. Negative numbers show by how much euro area CPI changes exceeds Irish CPI changes.


Of notable trends/patterns:

  • Irish overall consumer price inflation HICP (2.4% annual in September 2012) was below that for the EA17 (2.6%) and below EU27 (2.7%).
  • Ireland also posted lower inflation in September in Food and-alcoholic beverages, clothing and footware, Furnishings, household equipment and maintenance, Health, Recreation and culture, and Restaurants and hotels.
  • Ireland posted identical (to EA17) inflation in Alcoholic beverages & tobacco.
  • Ireland's inflation was in excess of that for the EA17 in Housing, water, electricty, gas & other fuels, Transport, Communications, education (by a massive 9.3 percentage points) and Miscellaneous goods & services.
  • Higher inflation rates in Ireland have accelerated in September, compared to January in only two categories: Housing, water, electricity, gas and other fuels, and Education.
In annual terms, Ireland is now in inflation territory since August 2010, with the peak rate of 3.11% in April 2011 and the current rate running at 1.20% - a modest inflationary environment, which means that our nominal GNP, were it to post 0% real growth is expanding at the rate closer to 1% nominally - a massive under-shooting of the rate of nominal growth required to deflate our debt pile.

13/11/2012: Consumer Prices in Ireland: October 2012

Consumer price index for October 2012, Ireland released last week chows broad continuation of the previously established trends, namely above-average inflation in state-controlled sectors, albeit the overall rate of the state-sanctioned rip-off of consumers is now moderating relative to previous months.

Overall CPI index dipped to 101.5 (2011 base year) in October compared to 101.6 in September, representing a mom change of -0.1% and y/y rise of 1.20%. 3mo average through October is at +0.36% rise on previous 3mo period and is up 1.60% y/y.

Charts below illustrate:

One thing is clear from the charts above: despite the economy still in trouble, cost of living in Ireland is now at the levels comparable with those attained in early 2008.

Looking at decomposition by broad category:

  • Price index in Food & non-alcoholic beverages category rose from 100.6 in September to 101.0 in October. The index is now up 1% y/y and 3mo average through October 2012 is 0.7% above the same period average a year ago.
  • Alcoholic beverages & tobacco prices index is slightly down from 103.7 in September 2012 to 103.5 in October 2012, but the index is still up 3.5% y/y and index 3mo average through October 2012 is up 3.57% on the same period a year ago. The index annual inflation was driven primarily by rises in price sof cigarettes (+6.9 y/y) and Other tobacco (+7.9% y/y)
  • Clothing and footware sub-category index is up from 99.5 in September to 100.5 in October. The sub-index is now up 1.01% y/y and its 3mo average through October 2012 is 0.64% ahead of the 3mo average for the same period in 2011. Garments were the only sub-category of goods in this category that showed y/y inflation (+2%), with other sub-categories posting deflation.
  • In Housing, water, electricity, gas and other fuels category, prices index rose from 96.8 in September to 98 in October, the index is up 1.24% m/m and is down 3.26% y/y. 3mo average through October is down 2.41% on a year ago. Mortgage interest posted a robust 18.1% decline y/y, but this decline is distributed unevenly with adjustable rate mortgages rising in cost, whiel tracker mortgages benefiting from ECB easy monetary policies. Meanwhile, largest y/y increases were recorded in Electricity (+8.7%), Gas (+9.3%) and Liquid fuels (+13.4%).
  • Furnishings, Household equipment and routine maintenance sub-index is down marginally from 97.4 in September to 97.2 in October. The sub-index is down 2.70% y/y and its 3mo average through October is down 2.53% y/y. Nine out of eleven sub-categories of goods and services posted deflation y/y in October.
  • Health prices index moderated from 100.4 to 100.2 m/m in October and is up only 0.3% y/y with 3mo average through October up 0.47% y/y. In Health, largest price increases in October in annual terms were in Other Medical Products (+2.9%) and Other medical and Paramedical Services (other than Doctors' fees) (+3.2%).
  • Transport sub-index fell significantly from 109.3 in September to 106.3 in October (down 2.74% m/m). However, the sub-index is still up 5.77% y/y and 3mo average through October 2012 is now up 7.34% on the same period of 2011. In Transport, largest increases in prices, annually, were in Petrol (+12.4%), Diesel (+11.1%), Motor Tax (+10.8%), Bus Fares (+9.2%), passenger Transport by Sea and Inland Waterway (+5.4%) and Combined Passenger Transport (+6.2%).
  • Communications prices sub-index moderated from 97.4 in September to 96.6 in October, down 3.40% y/y and down 2.67% y/y in terms of 3mo average through October. here, Postal services went up in price 1.5% y/y, while Telephone & telefax equipment and services were down in prices 3.6% y/y.
  • Recreation and culture prices sub-index rose from 98.7 in September to 99.2 in October, with an annual inflation registering at 6.73%. 3mo average through October was up 8.63% y/y.
  • Education costs rose at a monthly inflation of 4.6%, up 6.73 y/y in October to 104.6, while 3mo average through October 2012 was up 8.63% y/y. In education inflation was primarily diven by Secondary education (+2.5% y/y), Tertiary Education (+6.5%) and Education not definable by level (+6.6%).
  • Restaurants and hotels price index  was at 01.6 in October, down from 10.2 in September but still up 0.99% y/y, same rate of inflation as 3mo average through October 2012.
  • Miscellaneous goods and services sub-category price index rose from 104.2 in September to 105.2 in October and is up 5.62% y/y, with 3mo average through October 2012 up 5.40% on the same period a year ago. Here, health insurance costs were up 15.9% y/y and insurance connected with transport was up 4.7% y/y. Other services inflation run at 22.8% y/y in October.

 In terms of historical rates of inflation, charts below show current price indices for all main categories of goods and services relative to 1976 and 2007 readings.


Friday, September 14, 2012

14/9/2012: 36 years of state-incentivised inflation?


Some historical (up to August 2012) charts on Irish CPI. Orange bars mark state-dominated categories of goods and services. Interpret these as you wish. Summary table at the end is pretty much self-explanatory:


14/9/2012: Irish CPI for August - detailed charts


With some delay, here's the analysis of latest Consumer Price Inflation data for Ireland for August 2012:

Summary table of monthly and annual changes
Note: I will blog on overall inflation trend separately in the next post.

Here are changes by sector, including notable changes by sub-sector.

Monthly inflation:


Big spikes are in:

  • Clothing and Footware +6.6%
  • Mortgage Interest -3.2% (although CSO does not separate the differences between the ARM and trackers, which have been moving in the opposite directions)
  • Transport +1.6% (Petrol up 3.5%, Diesel up 4.0%
  • Transport Services +0.5% driven by Air Transport (+1.0%)
Year on year comparatives are more revealing:


The above clearly shows that most of the inflation on annual basis remains concentrated in the state controlled sectors (either via regulatory price hikes or direct state taxation and charges effects or via semi-states hiking prices on their own). Note that even in the 'Other Services' category, the inflation is driven by household charge being added in April 2012.

The Government strategy is clear, albeit, unlike the previous Government, the current one stays away from openly declaring this: milk Irish consumers for every penny they got via higher charges and state-captured prices. In effect, much of the price increases not caused by direct state taxation are still a form of taxation as the Government collects higher VAT and other taxes on those goods and services, provision of which it controls via semi-state bodies.

Thursday, August 9, 2012

9/8/2012: Rip-off Ireland roars again in July

Latest consumer price indices are out for Ireland. Headline number for annual comparatives is moderate inflation at 2.0% in HICP metric and 1.6% on CPI metric. M/m we have deflation.

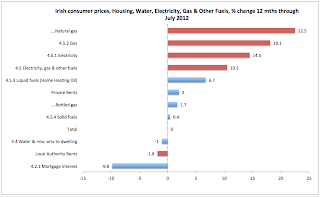
Alas, the headlines do not tell the whole story. Much is revealed in the following three charts which, in summary, show that most of inflation, including double-digit rampant inflation, is concentrated in state-controlled or state-set prices (marked in red).


You can see that even when it comes to energy, state-controlled prices (e.g. electricity and natural gas) are ahead of inflation driven by virtually identical underlying oil and gas prices (other hydrocarbons-linked fuels).

The above, of course is consistent with the State policies that have prioritized extraction of rents from the private economy in order to close fiscal gap. The State is doing this even though Irish Government is aware that we face a deleveraging crisis among our households and companies. In other words, prioritization of the policy is clear - skin consumers to save the Exchequer and to hell with households barely capable of making ends meet.

Don't think that this is not a prescription for an economic disaster. Killing off private economy to sustain public sector's lack of real reforms as well as to sustain exceptionally costly measures to underwrite Irish financial sector meltdown is not a good thing to do. But, hey, 'international investors' seem to approve.