Thursday, November 19, 2020

18/11/20: COVID19 Update: Russia

 Updating pandemic data for Russia: some summary stats first


The above stats clearly show that Russian pandemic is in  full-blown second wave of infections and deaths. As the chart below illustrates, however:
  • Russian second wave has been associated with exactly matching dynamics in both cases and deaths without any substantial lags;
  • Both cases and deaths are yet to show any signs of stabilization and peaking (which is distinct from the EU27 experience so far);
  • The two effects combined suggest that Russian pandemic numbers are likely to continue to worsen into December.
You can see more Russia summary stats and comparatives to other countries here: https://trueeconomics.blogspot.com/2020/11/181120-covid19-update-countries-with.html


18/11/20: COVID19 Update: U.S. vs EU27

Comparatives for the pandemic development across the EU27 vs U.S.:

Thanks to an absolutely savage second wave of the pandemic, EU27 is now closing the gap with the U.S. in terms of total deaths, both in absolute terms and in per capita terms:


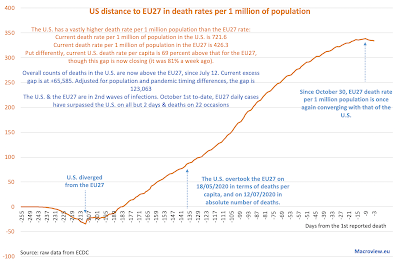
  • Deaths per capita: the U.S. has overtaken the EU27 since May 18, and the trend for the U.S. continued to be worse than that for the EU27 until early October.
  • EU27 death rate per capita has effectively flattened-out at around 308 per 1 million prior to August 2, but has been rising once again since then (498.1 currently).
  • U.S. deaths per capita continue to increase (760.1 currently).
  • The U.S. & EU27 are in 3rd (U.S.) and 2nd (EU27) waves of infections. Since Oct 1st, EU27 cases have surpassed the U.S. on all but 3 days & deaths on all but 16 days
The trends are horrifying, albeit in the EU27 we are now seeing potential decline in cases from the second peak. The U.S. appears to remain on the increasing trendline in terms of new cases: 


As the U.S. 3rd wave of new cases is blowing up, and the EU27 2nd wave appears to be subsiding, we are likely to see deaths accelerating once again in the U.S. and falling in the EU27, so the deaths gap between the U.S. and the EU27 is likely to revert back growing excess U.S. deaths.

  • Overall counts of deaths in the U.S. are now above the EU27, since July 12. 
  • Current excess gap is at +46,983, which is down on peak excess deaths gap of 68,152 attained a month ago. 
  • Adjusted for population and pandemic timing differences, the gap is 113,081. Put differently, 113,081 Americans would have been alive today were the U.S. responses to the pandemic similar to those adopted by the EU27.

Summary statistics really paint an awful picture: 
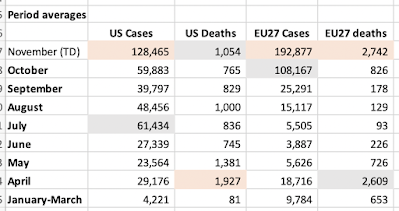
  • November has been thee worst month so far in this entire pandemic in terms of daily cases increases for both the EU27 and the U.S. 
  • In terms of deaths counts, the U.S. is still lagging behind the EU27, but November to-date is now ranks as the second worst month in daily deaths counts in the U.S. and the worst month in the EU27.


For more EU27 - U.S. comparatives, including comparatives to other countries, see: https://trueeconomics.blogspot.com/2020/11/181120-covid19-update-countries-with.html

Wednesday, November 18, 2020

18/11/20: COVID19 Update: Countries with > 100,000 cases

 Updating the tables for countries with more than 100,000 recorded cases of COVID19:


  • U.S. continues to lead globally in terms of deaths and new cases counts. On per-capita terms, the U.S. ranks 7th worst in the world in terms of cases per 1 million of population, 12th worst in terms of deaths per 1 million of population and 27th worst in the world in terms of deaths per 1,000 officially detected infections. The country has, by far, the most expensive (as a share of GDP) healthcare system in the world.
  • In contrast, were they treated as a single entity, BRIICS+Turkey have better than average performance in terms of number of cases, number of deaths per capita and an average (statistically)  rate of deaths per 1,000 cases.
  • Worldwide, 20 countries now have more than 500,000 cases and 5 countries of these have more than 50,000 deaths.
  • On per capita basis, the worst performing country in the world for cases counts is Qatar, followed by Belgium and Czechia, Armenia and Israel. In terms of deaths per capita, the worst country in the world is Belgium, followed by Peru, Spain, Argentina and Brazil. 
  • In deaths per 1,000 confirmed cases, the worst performing country is Mexico, followed by Ecuador, Bolivia, Egypt and Iran.


18/11/20: COVID19 Update: Worldwide Cases and Deaths

 Updating data on global COVID19 pandemic spread:

Some summary tables first;


November-to-date is an outlier month in terms of both, case numbers and deaths. While the former is in part driven by better availability of testing, the latter runs contrary to the expected outrun of improved testing: higher rates pf testing lead to earlier detection of the disease and, in theory, should lead to reduced deaths. Unfortunately, this is not the case. Daily average new deaths are running at 8.294 so far in November - a massive increase on October and the highest average for any month so far. Worse, thee geography of new cases has shifted from less-developed countries (South and Latin America, India etc) to more advanced economies (the U.S. and Europe), which should, in theory, see a reduction in daily deaths counts (due to better public health systems). This is not happening.


Table above shows dramatic jump in the rate of growth in deaths in November, compared to every prior month. It also suggests longer lags in deaths increases following cases increases, which may be due to earlier detection and younger cases demographics. This, however, is not comforting. Again, earlier detection and younger demographics should lead to slower rates of growth in deaths, not higher.

Charts for cases and deaths:


Moving averages clearly show relentless growth in the pandemic since the start of October for cases and the end of October for deaths. The global pandemic is accelerating, not abating.

Tuesday, November 17, 2020

17/11/20: U.S. households: Debt Hostages to the Washington

Massive stimulus deployed in Q2 2020 has lifted substantially aggregate household incomes. Meanwhile, lower interest rates have boosted debt affordability, while new demand for credit collapsed. All of which means that, at least through 2Q 2020, U.S. households enjoyed some really dramatic reduction in the burden of debt:


Income boost from Government transfers in 2Q 2020 was so large, it took household debt to income ratio down by a whooping 3 years in just one quarter, with the ratio currently at the levels last seen in the second half of 1998, moving exactly 3 years from Q3 2001 levels where they stood at the end of Q1 2020. meanwhile, actual debt levels, in US$ terms were down just $52 billion in 2Q 2020 compared to Q1 2020, a decline of only 0.26%. 

Of course, 2Q 2020 boost to incomes was a temporary measure, not related to any real economic growth and not sustainable in the longer run. A return to the pre-COVID19 levels of total debt burden relative to disposable income will shave off 1.455-1.626 percentage points off the households' disposable income net of debt servicing costs, washing out USD295-329 billion from households' budgets. Worse, following normalization of the credit markets, built up debt insolvencies delayed by the pandemic emergency measures will likely push debt to much higher levels as accumulated loans arrears get refinanced and rolled up. Assuming 5% of the loans in forbearance today, this would lead to the household income hit of USD310-346 billion. 

The twin effects of exhausted income supports and rising debt burden can see U.S. household debt burden rising to 135-136 percent of disposable income within the next 12 months.
 
All of which simply goes to show that the U.S. economy is now a complete and total hostage to monetary policy accommodation that is sustaining massive debt subsidies to the households, plus the one-off and non-sustainable income supplements.

16/11/20: The F&*ked Stay F&^ked

Here is an updated forecast for full year 2020 distribution of wealth 9based on FRED data though 2Q 2020 and stock markets data through November 16):


Hint: no, Donald Trump will not finish his tenure in the White House as the worst President for the 'bottom 90%', nor the best... 

16/11/20: Velocity of Money and the Glaciers of Complacency

Last time I looked at the velocity of money, things were going South fast: https://trueeconomics.blogspot.com/2020/05/27520-falling-velocity-of-money.html. And considering thee data through 3Q 2020, there is little improvement across the board:


You can barely notice 3Q 2020 uptick from the pandemic lows in all three measures, thee M1, M2 and MZM. And here are differentials:

Precautionary savings motives (blue line) remain extremely elevated, while investors' willingness to trade assets (in a bull market, a sign of more active management of portfolios) stays stubbornly low. Which implies that the shift from the pandemic impact to the recovery did not do much to alter demand for money, nor to break away from the monetary policy-supported glut of liquidity available to the economy as a whole and to the financial markets specifically. 

It is all as if we have frozen, from monetary policy point of view, in a singular tidal wave. A glacier of households' unease and investment markets complacency. 

16/11/20: Retail sales, Sector employment and COVID19 recovery

Retail sales suffered a sharp shock from the demand contraction following the first phase of COVID19 pandemic. As of the end of September, based on the preliminary estimates from the U.S. Census Bureau, total volume of retail sales in the U.S. has fully recovered to pre-pandemic levels:


Based on cumulative retail sales over trailing 12 months period, September 2020 stood at USD 5.519 trillion, which is USD48.371 billion above 12 months trailing cumulative for January 2020, and USD121.178 billion above the same measure for September 2019.

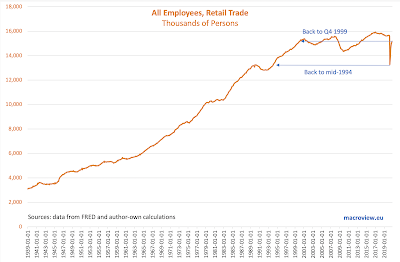
The same cannot be said about the recovery in the retail sector jobs:


As of October 2020, total employment in the U.S. retail sector stood at 15,173,500, 498,500 down on February 2020 and 471,200 less than in October 2019. In fact, the problem with the retail sector employment has been evident since the start of this Millennium. Held down by automation and increasing sales volumes flowing through web based retailers, the overall sector sales increases did not translate into sector employment growth. Over the last 10 years through September 2020, retail sales by value rose a cumulative 37%. Over the same period of time, retail sector average hourly earnings grew 27%, or 8 percentage points less than total private economy average hourly earnings inflation. Meanwhile, in 2006, $1 in hourly earnings of retail sector employees wages supported, roughly $1,380 of retail sales. As of September 2020, this number is almost $1,534.


Friday, November 13, 2020

13/11/20: The economy has two chronic illnesses (and neither are Covid)

My column for The Currency this week covers two key long-term themes in the global economy that pre-date the pandemic and will remain in place well into 2025: the twin secular stagnations hypotheses and the changing nature of the productivity. The link to the article is here; https://thecurrency.news/articles/28224/the-economy-has-two-chronic-illnesses-and-neither-are-covid/


Saturday, November 7, 2020

7/11/20: BRIC: Composite Economic Indicators for October

 I covered BRIC Manufacturing and Services PMIs for October in two earlier posts (see here https://trueeconomics.blogspot.com/2020/11/51120-bric-services-pmis-october.html), so now, Composite PMIs:


  • Brazil Composite PMI rose to 55.9 in October, compared to 51.6 in 3Q 2020, and currently sits above Global Composite PMI of 53.3. The latest increase in PMI is a robust signal of partial recovery, marking the third consecutive month of > 50.0 readings that followed five consecutive months of contraction. 
  • Russia Composite PMI was the weakest of all BRIC PMIs, falling to 47.1 in October, compared to 55.9 in 3Q 2020, and marking the first sub-50 reading in four months.
  • India Composite PMI was the strongest amongst the BRIC PMIs rising to 58.0 in October against 45.9 in 3Q 2020. Overall, Indian economy is only starting to inch out of the recession that was marked by two consecutive quarters of sharply contractionary PMIs.
  • China Composite PMI posted an increase to 55.7 in October relative to 54.7 in 3Q 2020, marking the start of the third quarter of growth. Overall, the latest reading indicates that Chinese economy has completed its recovery from 1Q 2020 recession.
Overall, BRIC Manufacturing indicator (55.2 in October, compared to 53.0 in 3Q 2020) and Services indicator (54.9 in October, compared to 51.0 in 3Q 2020) have posted better performance than their Global counterparts (53.0 and 52.9, respectively for October). BRIC Manufacturing indicator is now outperforming Global Manufacturing PMI in 8th consecutive quarters, and BRIC Services indicators is running above Global Services PMI for the first time after posting poorer performance in 3Q 2020.

7/11/20: COVID19 Update: U.S. vs EU27

 U.S. is now in a full-blown third wave of the pandemic both in terms of daily case counts and deaths, and the EU27 is in a full-blown second wave:


Summary statistics:


Histograms for both:


7/11/20: COVID19 Update: Worldwide Cases and Deaths

 The pandemic is accelerating world-wide and the death toll is now rising at an alarming rate:


The chart above is the most alarming one: rates of growth in new cases and in daily deaths counts (the second derivative) are well-above their past months' averages. Death toll is rising by a third, daily, on average since the start of November. Covid-denialists have persistently argued that despite increases in the numbers of new cases, deaths were falling (they were not: August was the only month of negative growth in daily deaths). In fact, starting with September, daily deaths, on average, grew by double-digits percentage points, and the rate of growth accelerated in October by 80 percent compared to September. 

Global second wave of the pandemic is substantially more deadly (in absolute numbers) than the prior wave.