Monday, November 5, 2012

5/11/2012: OECD Internet economy outlook 2012: part 4


This is the fourth note on the OECD Internet economy report 2012 (part 1part 2 and part 3 are linked here).

We hear much about the vast gap between Dublin and the rest of the country in digital economy. Usually this refers to the disparity of access. Yet, as the following illustrates, even the 'advantaged' Dublin scores poorly compared to its peers (other capital regionas) in the OECD:


For example, Dublin and Southern and Eastern region are worse than Scotland - the lowest scoring region in the UK. Too bad the folks at the WebSummit and other prime events in digital economy world converging onto Dublin have no clue just how poor we really are in terms of enabling and deploying ICT services-based economy. May be some of them will read these posts or the OECD document before they start extolling the virtues of Irish 'digital' economy.

But enough about the households. What about pioneering, innovative, R&D intensive, knowledge economy business environment here? After all, as I said earlier, ireland is home to so many MNCs in the sector and so one should expect business use of the web to be high...

Oops.. I thought we have hugely innovative start ups and MNCs popping up on every corner... After all, IDA and EI brochures are full of their smiling faces and sunny stories.

And usage is, as with schools, vastly lower than access:

Now, unimpressive record on the share of employees connected to the web and using it...
Equally interesting fact revealed by the above chart is that there is no impressive growth in this metric in 2005-2011 period, despite the fact that overall share should have risen dramatically due to obliteration of jobs in less computer- and web-enabled sectors such as basic consumer services and construction. In other words, the above chart shows conclusively that Irish economy is not becoming more knowledge-intensive even after jobs destruction wave sweeping traditional sectors.

The same ic confirmed by a different metric:

Remember the malarky about MNCs operations in Ireland being of great benefit to 'clustering' and 'spill-over of skills and know-how' to the broader economy? Why, it seems to be pretty much a lie too:

Per chart above, Ireland scores relatively well on internally shared systems and rather poorly on externally shared ones. In other words, if MNCs are creating knowledge and transfers here, they are more likely to keep them to themselves than to allow them to 'spill-over' to outside their own offices.

Ireland-based businesses are not even any good at invoicing via the web:

Of course, the headline figures on earnings generated via e-commerce are high, but these are grossly skewed by MNCs (e.g. google et al):

How I know that? Because the actual usage of e-based sales is poor in Ireland:
So revenue generation ranking above is skewed heavily by few businesses carrying out huge transactions volumes, not by broad reach of e-commerce.

And the same applies to ICT business spending on R&D:

Once again, more on the topic in the next post.

5/11/2012: OECD Internet economy outlook 2012: part 3


In part 1 and part 2 earlier I took a look at some stats coming from the OECD report published today and positioning Irish internet economy overall at the very best at-or-below the OECD average across e-business, connectivity and social use.

Let's continue wading through the massive report (linked in the first post above).

An interesting chart below:

This shows that Ireland overall scores relatively well in terms of schools access to the web - at least we are above the OECD average. But usage of this access is... well - well below the OECD average ranks Ireland closer to 7th from the bottom. So having access (public spending) is not equivalent to quality of use. In fact, ireland has the 5th largest gap in usage relative to access in the OECD.

Irish Government is equally poor at providing useful and user-friendly access to information on the web, on par with our sub-average performance in other ICT-enabled services:
Which is in line with general lack of transparency and engagement with services users on behalf of our State, where fixing potholes still requires a phone call to a local TDs, rather than a more modern and less corrupting approach of simply requesting a service from responsible authorities.

Back to utilization of basic ICT services:
No comment necessary.

And usability by our remarkably highly educated workforce? Why, average, again:

Remember, it's the workforce marvel that attracts MNCs into Ireland - the workforce where even highly educated don't really use the web, and where education system doesn't encourage use of the web in schools, and where stats for P2P file sharing, use in continued education, basic webpage publishing etc are all abysmally poor.

Never mind... just read an IDA brochure and believe!..

5/11/2012: OECD Internet economy outlook 2012: part 2

Here comes the second post on OECD Internet Economy Outlook 2012 report (first in the series was here), focusing on Ireland and the mythology of our 'global ICT services hub'.

So wading deeper into the OECD report, take a look at this chart:


Ireland hardly can boast of an advanced fibre infrastructure that would be consistent with real ICT economy, especially ICT services economy. Per OECD: "Fibre-based broadband connections offer the fastest data transfers..." Now, in many countries, deployment of fibre broadband is lower due to home ownership rates being lower (people tend to invest less in a fixed connection quality when they rent, other things held constant). In Ireland, abysmally low fibre coverage is coincident with very high home ownership rates.

Next up, given lack of fibre coverage, you'd think we should lead the world in overall penetration of the substitutes (e.g. wireless), although, of course, fixed fibre and wireless can be complementary to each other (e.g. fixed line at home, mobile on the go). Alas, not really:


And subsequently, the gap between broadband connections and overall internet connections in Ireland is high by comparative standards:
In fact, we are below both EU27 and OECD average on broadband coverage per above chart.

Next up: the world of data is becoming portable. And in particular it is becoming portably mobile - in other words, more and more access to data is now taking place via mobile devices, rather than portable computers... And in Ireland?
Despite all the talk about the new generation of mobile users, etc, Irish 'younger and more educated workforce' seems to be not using mobile devices.

Having netted into Ireland all flagships of ICT web communications services providers and having established ourselves as social networking capital of Europe, we show neither a dramatic rate of coverage for internet communications, nor a dramatic rate of growth from 2007 through 2011 in this category:

In fact, per OECD data, we have fewer internet users engaging in social networking than Greece, Portugal, Poland, Slovakia and Hungary (overall, we rank 12th in the group of 24 countries in terms of this parameter).

And we are not exactly content-creative either:

E-commerce is absolutely average in its reach in Ireland too and is growing relatively slowly:

As is internet-based learning:
Do note that e-learning is associated strongly with continued or life-long education, so the above suggests we tend not to upskill much via continued education once we get our degrees. Not exactly a badge of honour.

More on this in the third post.

5/11/2012: OECD Internet economy outlook 2012: part 1


Quite an interesting chart from OECD on Ireland and its peers in terms of the spread / reach of the ICT economy. Now, keeping in mind that Ireland is, allegedly, a 'knowledge-based economy' with prime talent in ICT services, attracting huge share of global ICT services firms, etc... why is, then


Or put in words, why is Ireland is one of only 3 countries with shrinking, not growing proportion of workforce engaged in ICT sector?

Per OECD report (link here), Ireland had 3 firms represented in top 250 ICT firms globally, same as, for example South Africa (which is not calling itself a 'global ICT hub' last time I checked). Nonetheless, Ireland's count is large for our relative size. Alas, in 2000 total revenue of ICT firms in Ireland was estimated at USD29.04bn and that rose to USD42.8bn in 2011 - a rise of 47.4% or a growth rate of 3.6% annually. Not spectacular, considering worldwide sector revenue grew 108% over the same period of time expanding at an average annual rate of 6.9% per annum. In other words, Ireland's ICT 'global hub' managed to grow at slightly above 1/2 the global rate of growth.

Just when you thought things couldn't get much worse. Net revenues of the ICT sector in Ireland amounted to USD3.871 billion in 2000. You would expect this to rise dramatically by 2011, especially since globally net revenues grew 127% over 2000-2011 period. But no: Irish ICT sector net revenues have actually fallen USD3.444 billion in 2011.


Now, wait: gross revenues of ICT sector in Ireland underperformed global growth rates by a factor of almost two, while net revenues have shrunk. This hardly constitutes some huge success in attracting ICT FDI and creating a global ICT services hub.

Now, chart below shows just how much of a 'leading' light our FDI magnet in ICT sector really is:

Good news is that "On average, 20% of total BERD investment is focused on the ICT sector. But the data show very large differences across countries. In 2010, ICT BERD accounted for more than a half of total business R&D expenditure in Chinese Taipei, Greece, Finland and Korea. It accounted for more than 30% in Estonia (30%), Ireland (32%), Singapore (36%) and the United States (33%)." The problem, however, is that Ireland has one of the lowest BERD investment overall in the OECD economies, so 32% of a small number can be less than 16% of a larger one...

So here's the outcome:

I will continue blogging on the OECD report tonight, so stay tuned.

5/11/2012: Academic research and market efficiency


Fascinating article on both the issue of markets efficiency (pricing-in of newsflows) and the impact of herding via learning (triggered by academic research) in finance: here.

A nice addition to our discussions both in TCD and UCD courses.

5/11/2012: Lehman Bros & Irish ISEQ - II


And a bit more on indices dynamics:

Some interesting longer term trends from the major indices and VIX revealing the underlying structure of the Irish and the euro area crises. Note: data covers period through September 2012.

Starting from the top, here are indices of major stock prices, normalized back to February 2005 for comparative purposes. Relative to the peak, currently, CAC40 stands at around -41.9%, while FTSE MIB is at -62.5%, FTSE Eurotop 100 at -31.7%, FTSE ALL Shares at -11.22%, DAX at -8.41%, S&P500 at -6.15% and IBEX35 at -48.5%. Meanwhile, 'special' Ireland's ISEQ is at -66.9%.

Chart Index 1.0 and Index 1.1.


Clearly, Ireland is the poorest performer in the class.

Now, it is worth noting that Ireland's stock market is also 'distinguished' by a very 'special' characteristic of being the riskiest of all markets compared, with STDev of returns at 36.45 (on normalized index). Compared to the French market (STDev=22.34 for the period from the start of 2005 through today), Italian market (STDev = 28.95), FTSE Eurotop 100 (STDev = 18.90), FTSE All Shares (STDev = 13.70), German DAX (STDev = 23.05), S&P500 (STDev =14.55) and Spanish market (IBEX STDev = 23.70), Ireland is a risky gamble. Given that the direction of this bet, in the case of Ireland has been down from May 2007, virtually uninterrupted, the proposition of 'patriotic investment' in Ireland's stocks is an extremely risky gamble.

Normalizing the indices at their peak values (set peak at 100), chart below clearly shows the constant, persistent underperformance of the ISEQ.

Chart Index2.0

Now, let's take a look at the core driver of global fundamentals: risk aversion as reflected in VIX index. In general, rising VIX signals rising risk aversion and should be associated with falling stock valuations. Once again, for comparative reasons, we use indexed series of weekly returns for 1999-September 2012. Up until the crisis, Irish stock prices behaved broadly in line with the same relationship to VIX that holds for all other major indices. Chart below illustrates this for FTSE Eurotop 100, but the same holds for other major indices. VIX up, risk-aversion up, stock indices, including ISEQ, down.

Chart VIX1.1

Around Q1 2009 something changed. ISEQ lost any connection with 'reality' of the global markets and acquired life of its own. Or rather - a zombie life of it own. No matter what the global appetite for risk was doing, Irish stocks did not have much of a link with global investment fundamentals.

Another interesting point of the above chart is that Lehman Brothers were not a trigger for Irish crisis (as many of us have been saying for ages, despite the Government's continued assertions to the contrary). Irish market peaked in the week of May 21st, 2007, Lehman Brothers folded on September 15th, 2008, with most of the impact in terms of our indices occurring at September 15th-October 6, 2008, some 16 months after Irish markets began crashing. Prior to Lehman Brothers bankruptcy, ISEQ dropped from a peak of 147.3 to 61.6, while following the Lehman Brothers and until the global stock market trough of March 2, 2009, ISEQ fell to roughly 31.9 reading. So even in theory, Lehman bankruptcy could have accounted for no more than 29.7 point drop on the normalized ISEQ, while pre-Lehman drivers collapsed ISEQ by 85.7 points. 

More revealingly, ISEQ steep sell-offs through out the entire crisis have led, not followed, sell-offs in major indices. In other words, if Lehman caused the global market meltdown, then ISEQ 'caused' Lehman bankruptcy. Which, of course, is absurd.

There are many other stories that can be told looking at the Irish Stock Exchange performance, especially once higher moments to returns distribution are factored in, but I shall leave it to MSc students to explore.

5/11/2012: Lehman Bros & Irish ISEQ


Here's an interesting little factoid. The theory - usually advanced by the Irish Government - goes that Lehman Brothers bankruptcy has been a major driver of the Irish crisis. I have disputed this for ages now and more and more evidence turns up contrary to that when more and more data is considered.

Now, here's a new bit.

Suppose Lehman Bros did contribute significantly to the Irish crisis gravity. In that case, given Lehman Brothers bankruptcy contributed adversely to the global markets, we can expect a dramatic contagion from the global markets panic to Irish markets. One way to gauge this is to look at the changes in correlations between the measure of overall 'panic' in the international markets and the behaviour of the returns to Irish stock market indices.

Let's take ISEQ index for Irish markets and VIX for a measure of the panic sentiment in the global markets. Let's take weekly returns in ISEQ and correlate them to weekly changes in VIX. I use log-differencing in that exercise and 52 weeks rolling correlations.

What should we expect to see? If the 'Lehmans caused Irish crisis or worsened it' theory holds, we should expect correlation between ISEQ weekly returns and changes in weekly VIX readings to be negative (VIX rising during the crisis signals rising risk aversion in the markets). For Irish markets to be influenced significantly, or differently from other markets around the world, such negative correlations should be larger in absolute value than for other countries.

What do we see? Here is a table of averages:


Contrary to the hypothesis of 'Lehmans caused Irish crisis', we see that throughout the period of the crisis, ISEQ suffered shallower, not deeper, spillover from global risk aversion to equity valuations, save for Spanish IBEX index. In other words, evidence suggests that Irish 'disease', like Spanish 'disease' was driven more by idiosyncratic - own market-specific - factors rather than by global panic.

Here's the chart, showing just how consistently closer to zero ISEQ correlation to VIX was during the post-Lehman panic period:

And here is a chart showing skew in the distribution of weekly returns which shows that during the crisis, Ireland's ISEQ suffered less from global markets 'bad news' spillovers (at the point of immediate global markets panics, such as Lehmans episode), but exhibited  a much worse negative skew than other peers in the period from June 2010 through Q1 2012.


5/11/2012: Bank credit to SMEs - demand side


My paper with Javier Sánchez Vidal, Ciaran Mac an Bhaird and Brian M. Lucey "What Determines the Decision to Apply for Credit? Evidence for Eurozone SMEs" is available here.

Tuesday, October 30, 2012

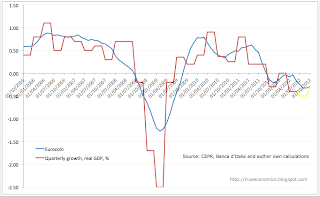
30/10/2012: Eurocoin signals continued recession in October


Euro area economy did not improve significantly in September-October, according to the leading composite indicator eurocoin published by the CEPR and Banca d'Italia.


Per eurocoin,

  • October growth reading stood at -0.29%, statistically indistinguishable from -0.32 and -0.33 recorded in September and August, respectively. 
  • October marks thirteenth consecutive month of contraction being signaled by eurocoin
  • Crucially, 3mo MA is now at -0.313 which is the same as 2008-2009 average (-0.31). 6mo average is at -0.23.
  • We are now into the fourth month of statistically significant sub-zero readings.


As charts below show, ECB remains in the operating range where inflationary target is not consistent with Taylor Rule target.


And here's a chart from Morgan Stanley Research showing PMI-based indicators are also pointing South:


30/10/2012: Feeble defense for tax arbitrage


Saturday, October 27, 2012: http://www.irishexaminer.com/ireland/gilmore-bids-to-reassure-merkels-heir-apparent-212198.html#.UI2WTN8hVo4.twitter

"Ireland’s corporation tax rate was in the sights of the man most likely to succeed Angela Merkel as German chancellor when he met Tánaiste Eamon Gilmore in Berlin. Peer Steinbruck, the Socialists’ candidate to lead the party in next year’s election, also said he doesn’t personally believe in using EU funds to pay down bank debt."

Now, here's the problem: Steinbruck has been "deeply critical of Ireland’s generous corporation tax, blaming it for Germany losing income from German companies, when he was finance minister in the previous coalition government with Ms Merkel."

Per report, "the Tánaiste tried to reassure him that Ireland’s tax rate of 12.5% — the second lowest in the EU — posed no threat to Germany… …Over 1,000 multinationals are based in the country and last year was a record for inward investment. "This is not a threat to Germany or to our other partners in Europe — there are more jobs in Irish companies operating in Germany than there are in German companies operating in Ireland. "In fact, in many instances we are competing for mobile investment with other parts of the world and not with our fellow European," said Mr Gilmore."


One wonders if Mr Gilmore is simply playing an ignorant or is indeed unaware of the fact that beyond his own prowess of policy foresight, other countries in Europe, including Germany, would like to see European HQs of non-EU MNCs set up in their jurisdictions? Or perhaps Mr Gilmore thinks that Peer Steinbruck is some naive school-teacher-turns-politico and that the German Socialist has no desire to correct for often absurd tax arbitrage on which Germany is losing billions in tax revenues and which Ireland facilitates (see links here : http://trueeconomics.blogspot.ie/2012/10/13102012-irish-corporate-tax-haven-in.html). This tax arbitrage not only imposes direct cost on Germany (via German MNCs accounting practices via Ireland operations), but also massive indirect costs as non-German MNCs trade into German economy bypassing German tax system.

In reality, all tax havens are small open economies, so Mr Gilmore's 'Ireland is small, so it needs special tax regime' argument is hardly a defense.

30/10/2012: Not all austerity is equal


August 2012 paper (link: http://papers.ssrn.com/sol3/papers.cfm?abstract_id=2153486 ) "The Output Effect of Fiscal Consolidations by Alberto F. Alesina , Carlo A. Favero and Francesco Giavazzi published by CEPR (Discussion Paper No. DP9105) looked at "whether fiscal corrections cause large output losses." Italics are mine:

The authors "find that it matters crucially how the fiscal correction occurs. Adjustments based upon spending cuts are much less costly in terms of output losses than tax-based ones. Spending-based adjustments have been associated with mild and short-lived recessions, in many cases with no recession at all. Tax-based adjustments have been associated with prolonged and deep recessions.

The difference cannot be explained by different monetary policies during the two types of adjustments. Studying the effects of multi-year fiscal plans rather than individual shifts in fiscal variables we make progress on question of anticipated versus unanticipated policy shifts: we find that the correlation between unanticipated and anticipated shifts in taxes and spending is heterogenous across countries, suggesting that the degree of persistence of fiscal corrections varies."

"Estimating the effects of fiscal plans, rather than individual fiscal shocks, we obtain much more precise estimates of tax and spending multipliers". And "the key result is that while expenditure-based adjustments are not recessionary, tax-based ones create deep and long lasting recessions." The reason for this that "the aggregate demand component which reflects more closely the difference in the response of output to ECB and [tax-based] adjustments is private investment. The confidence of investors proceeds with the economy and therefore recovers much sooner after a spending-based adjustment than after a tax-based one. ...These results are consistent with the descriptive statistics presented in Alesina and Ardagna (2012) who show that the fiscal stabilizations which have the mildest effect on output are those that are accompanied by a set of structural reforms which signal a "decisive" policy change. They [like the present study] do not find any difference in the monetary pol- icy stance between spending-based and tax-based adjustments, but mostly differences in the policy packages regarding supply side reforms and liberalizations."

Monday, October 29, 2012

29/10/2012: German banks exposure to GIIPS


Here's a pic courtesy of Morgan Stanley Research of the German system exposure to GIIPS - pre-crisis, and now:


That is a massive deleveraging (if you look at now, through September), but it is also a massive exposure. Few years ago I said that German banks didn't have a property bubble at home. The had one abroad (in GIIPS) instead. Now, with their banks close to 2005 levels of exposure, it is pretty clear where the Euro area policy train is heading before the station 'Legacy Debts' is reached.