Showing posts with label VUCA. Show all posts

Sunday, February 25, 2018

25/2/18: Syria: a Web of VUCA


In his column this week, Tyler Cowen, of Bloomberg View, sums up the VUCA nature of the ongoing conflict in Syria. In fact, his article is more fundamental than that. He paints a coherent picture of how Syria conflict serves as a fertile ground for growth of Black Swan-type tail risks (risks of large scale impact events with low or zero historical predictability).

In simple terms, in Syria, the U.S. and Russia (and their auxiliary proxies) combine three key VUCA factors:

  • Ambiguity: represented by the inability to distinguish and delineate clearly the adversarial actors involved in each individual incident: Russian proxies are met with American proxies, amidst a veritable soup of various other actors;
  • Uncertainty: represented by lack of clear, stated in advance, and transparently enforced objectives by major actors, most commonly the U.S., but also Russia and Iran;
  • Complexity: captured by a complex web of interests, internal-to-Syria and global objectives, etc. 
As Cowen correctly warns, incidents like the alleged Russian proxies-led attack on the U.S. and Kurdish compound can create a potential for a large scale risk materialization or blow-out. Or, put into more academic language,  VUCA environment is self-sustaining: ambiguity, uncertainty and complexity interact to produce a cyclical reinforcement of Volatility (risk). The vicious cycle repeats, amplifying the extent to which VUCA impact (size of the potential forthcoming systemic shock), likelihood (probability of a systemic forthcoming shock), proximity (timing of the systemic shock) and velocity (speed with which the forthcoming shock arrives) rise.


Read Cowen's article in full here: https://www.bloomberg.com/view/articles/2018-02-23/us-s-killing-of-russians-in-syria-is-harbinger-of-more-violence and read these excellent descriptors of how complexity of Syrian conflict is evolving: https://taskandpurpose.com/complexity-syrias-war-catching-us/ and here: http://www.periscopic.com/news/removing-confusion-from-complexity.


Tuesday, January 16, 2018

15/1/18: Of Fraud and Whales: Bitcoin Price Manipulation


Recently, I wrote about the potential risks that concentration of Bitcoin in the hands of few holders ('whales') presents and the promising avenue for trading and investment fraud that this phenomena holds (see post here: http://trueeconomics.blogspot.com/2017/12/211217-of-taxes-and-whales-bitcoins-new.html).

Now, some serious evidence that these risks have played out in the past to superficially inflate the price of bitcoins: a popular version here https://techcrunch.com/2018/01/15/researchers-finds-that-one-person-likely-drove-bitcoin-from-150-to-1000/, and technical paper on which this is based here (ungated version) http://weis2017.econinfosec.org/wp-content/uploads/sites/3/2017/05/WEIS_2017_paper_21.pdf.

Key conclusion: "The suspicious trading activity of a single actor caused the massive spike in the USD-BTC exchange rate to rise from around $150 to over $1 000 in late 2013. The fall was even more dramatic and rapid, and it has taken more than three years for Bitcoin to match the rise prompted by fraudulent transactions."

Oops... so much for 'security' of Bitcoin...


Sunday, December 10, 2017

10/12/17: Rationally-Irrational AI, yet?..


In a recent post (http://trueeconomics.blogspot.com/2017/10/221017-robot-builders-future-its-all.html) I mused about the deep-reaching implications of the Google's AlphaZero or AlphaGo in its earliest incarnation capabilities to develop independent (of humans) systems of logic. And now we have another breakthrough in the Google's AI saga.

According to the report in the Guardian (https://www.theguardian.com/technology/2017/dec/07/alphazero-google-deepmind-ai-beats-champion-program-teaching-itself-to-play-four-hours),:

"AlphaZero, the game-playing AI created by Google sibling DeepMind, has beaten the world’s best chess-playing computer program, having taught itself how to play in under four hours. The repurposed AI, which has repeatedly beaten the world’s best Go players as AlphaGo, has been generalised so that it can now learn other games. It took just four hours to learn the rules to chess before beating the world champion chess program, Stockfish 8, in a 100-game match up."

Another quote worth considering:
"After winning 25 games of chess versus Stockfish 8 starting as white, with first-mover advantage, a further three starting with black and drawing a further 72 games, AlphaZero also learned shogi in two hours before beating the leading program Elmo in a 100-game matchup. AlphaZero won 90 games, lost eight and drew 2."

Technically, this is impressive. But the real question worth asking at this stage is whether the AI logic is capable of intuitive sensing, as opposed to relying on self-generated libraries of moves permutations. The latter is a form of linear thinking, as opposed to highly non-linear 'intuitive' logic which would be consistent with discrete 'jumping' from one logical moves tree to another based not on history of past moves, but on strategy that these moves reveal to the opponent. I don't think we have an answer to that, yet.

In my view, that is important, because as I argued some years ago in a research paper,  such 'leaps of faith' in logical systems are indicative of the basic traits of humanity, as being distinct from other forms of conscious life. In other words, can machines be rationally irrational, like humans?..


Friday, November 24, 2017

Saturday, November 18, 2017

18/11/17: North Korean Uncertainty and Market Impacts


S&P new post about the risks poised by North Korea is a neat summary of key actions and players involved (see the full note: https://marketintelligence.spglobal.com/blog/global-credit-risk-spikes-as-key-apac-countries-respond-to-the-north-korean-threat).

And it is very interesting to those of us, who study the links between geopolitical risks and financial markets.

Two pieces of evidence are presented in the S&P note worth pondering: first, the rising frequency of the North Korea threat signals:


The above shows that starting with 2016, acceleration in the North Korea threat signals has been posing a departure from the previous trend. Structurally, this suggests that we are entering a new regime in terms of potential market spillovers from North Korean risks to global financial markets.

Next, some evidence on changes in specific shares valuations timed close to the North Korean threat signals:

The evidence above suggests that, in line with our research findings in other instances, the uncertainty about North Korean threat evolution is feeding into the valuations of defence stocks. And that this effect is still ambiguous. Which is in line with our findings on the links between actual conflicts and defence stocks valuations revealed in my paper with Mulhair, Andrew, "Performance Analysis of U.S. Defense Stocks in Relation to Federal Budgets and Military Conflicts in the Post-Cold War Era" (April 2017). Available at SSRN: https://ssrn.com/abstract=2975368. Furthermore, the nature of North Korean policy-induced uncertainty is consistent with our findings relating to terrorism spillovers to financial markets as revealed in my paper with Corbet, Shaen and Meegan, Andrew, "Long-Term Stock Market Volatility and the Influence of Terrorist Attacks in Europe" (August 2017). Available at SSRN: https://ssrn.com/abstract=3033951. Note, the latter paper is now forthcoming in the Quarterly Review of Economics and Finance.

While explicit testing of spillovers from North Korean uncertainty to global financial markets is yet to be firmly established in empirical literature, it is worth noting that the indirect evidence (based on data similar to S&P blog post) suggests that North Korean threat is likely to have a significant VUCA-consistent effect on the markets.

Friday, October 6, 2017

5/10/17: Leverage Risk, Credit Quality & Debt Tax Shield


In our Risk & Resilience class @ MIIS, we cover the impact of various aspects of the VUCA environment on, amongst other things, the Weighted Average Cost of Capital. One key element of this analysis - the one we usually start with - is the leverage risk. In practical terms, we know that the U.S. (bonds --> intermediated bank debt) and Europe (intermediated debt --> bonds) are both addicted to corporate leverage, with lower cost of capital attributable to debt. We also know that this is down not to the recoverability risks or credit risks, but to the asymmetric treatment of debt and equity in tax systems. Specifically, leverage risk is driven predominantly by tax shields (tax deductibility) of debt.

In simple terms, tax system encourages, actively, accumulation of leverage risks on companies capital accounts. Not only that, tax preferences for debt imply distorted U-shaped relationship between credit ratings (credit risk profile of the company) and the cost of capital, whereby top-rated A+, A and A- have higher cost of capital (due to greater exposure to equity) than more risky BBB and BBB- corporates (who have higher share of tax0deductible debt in total capital structure).

Which brings us to one benefit of reducing tax shield value of debt (either by lowering corporate tax rate, which automatically lowers the value of tax shield) or by dropping tax deduction on debt (or both). Here is a chart showing that when tax deductibility of debt is eliminated, companies with lowest risk profile (A+ rated) enjoy lowest cost of capital. As it should be, were risk playing more significant role in determining the cost of company funding, instead of a tax shield.

Simples. com

Tuesday, October 3, 2017

3/10/17: Ambiguity Fun: Perceptions of Rationality?


Here is a very insightful and worth studying set of plots showing the perceived range of probabilities under subjective measure scenarios. Source: https://github.com/zonination/perceptions


The charts above speak volumes about both, our (human) behavioural biases in assessing probabilities of events and the nature of subjective distributions.

First on the former. As our students (in all of my courses, from Introductory Statistics, to Business Economics, to advanced courses of Behavioural Finance and Economics, Investment Analysis and Risk & Resilience) would have learned (to a varying degree of insight and complexity), the world of Rational expectations relies (amongst other assumptions) on the assumption that we, as decision-makers, are capable of perfectly assessing true probabilities of uncertain outcomes. And as we all have learned in these classes, we are not capable of doing this, in part due to informational asymmetries, in part due to behavioural biases and so on. 

The charts above clearly show this. There is a general trend in people assigning increasingly lower probabilities to less likely events, and increasingly larger probabilities to more likely ones. So far, good news for rationality. The range (spread) of assignments also becomes narrower as we move to the tails (lower and higher probabilities assigned), so the degree of confidence in assessment increases. Which is also good news for rationality. 

But at that, evidence of rationality falls. 

Firstly, note the S-shaped nature of distributions from higher assigned probabilities to lower. Clearly, our perceptions of probability are non-linear, with decline in the rate of likelihoods assignments being steeper in the middle of perceptions of probabilities than in the extremes. This is inconsistent with rationality, which implies linear trend. 

Secondly, there is a notable kick-back in the Assigned Probability distribution for Highly Unlikely and Chances Are Slight types of perceptions. This can be due to ambiguity in wording of these perceptions (order can be viewed differently, with Highly Unlikely being precedent to Almost No Chance ordering and Chances Are Slight being precedent to Highly Unlikely. Still, there is a lot of oscillations in other ordering pairs (e.g. Unlikely —> Probably Not —> Little Chance; and We Believe —> Probably. This also consistent with ambiguity - which is a violation of rationality.

Thirdly, not a single distribution of assigned probabilities by perception follows a bell-shaped ‘normal’ curve. Not for a single category of perceptions. All distributions are skewed, almost all have extreme value ‘bubbles’, majority have multiple local modes etc. This is yet another piece of evidence against rational expectations.

There are severe outliers in all perceptions categories. Some (e.g. in the case of ‘Probably Not’ category appear to be largely due to errors that can be induced by ambiguous ranking of the category or due to judgement errors. Others, e.g. in the case of “We Doubt” category appear to be systemic and influential. Dispersion of assignments seems to be following the ambiguity pattern, with higher ambiguity (tails) categories inducing greater dispersion. But, interestingly, there also appears to be stronger ambiguity in the lower range of perceptions (from “We Doubt” to “Highly Unlikely”) than in the upper range. This can be ‘natural’ or ‘rational’ if we think that less likely event signifier is more ambiguous. But the same holds for more likely events too (see range from “We Believe” to “Likely” and “Highly Likely”).

There are many more points worth discussing in the context of this exercise. But on the net, the data suggests that the rational expectations view of our ability to assess true probabilities of uncertain outcomes is faulty not only at the level of the tail events that are patently identifiable as ‘unlikely’, but also in the range of tail events that should be ‘nearly certain’. In other words, ambiguity is tangible in our decision making. 


Note: it is also worth noting that the above evidence suggests that we tend to treat inversely certainty (tails) and uncertainty (centre of perceptions and assignment choices) to what can be expected under rational expectations:
In rational setting, perceptions that carry indeterminate outruns should have greater dispersion of values for assigned probabilities: if something is is "almost evenly" distributed, it should be harder for us to form a consistent judgement as to how probable such an outrun can be. Especially compared to something that is either "highly unlikely" (aka, quite certain not to occur) and something that is "highly likely" (aka, quite certain to occur). The data above suggests the opposite.

Saturday, July 29, 2017

28/7/17: Risk, Uncertainty and Markets


I have warned about the asymmetric relationship between markets volatility and leverage inherent in lower volatility targeting strategies, such as risk-parity, CTAs, etc for some years now, including in 2015 posting for GoldCore (here: http://www.goldcore.com/us/gold-blog/goldcore-quarterly-review-by-dr-constantin-gurdgiev/). And recently, JPMorgan research came out with a more dire warning:

This is apt and timely, especially because volatility (implied - VIX, realized - actual bi-directional or semi-var based) and uncertainty (implied metrics and tail events frequencies) have been traveling in the opposite direction  for some time.

Which means (1) increasing (trend) uncertainty is coinciding with decreasing implied risks perceptions in the markets.

Meanwhile, markets indices are co-trending with uncertainty:
Which means (2) increasing markets valuations are underpricing uncertainty, while focusing on decreasing risk perceptions.

In other words, both barrels of the proverbial gun are now loaded, when it comes to anyone exposed to leverage.

Thursday, June 8, 2017

7/6/17: European Policy Uncertainty: Still Above Pre-Crisis Averages


As noted in the previous post, covering the topic of continued mis-pricing by equity markets of policy uncertainties, much of the decline in the Global Economic Policy Uncertainty Index has been accounted for by a drop in European countries’ EPUIs. Here are some details:

In May 2017, EPU indices for France, Germany, Spain and the UK have dropped significantly, primarily on the news relating to French elections and the moderation in Brexit discussions (displaced, temporarily, by the domestic election). Further moderation was probably due to elevated level of news traffic relating to President Trump’s NATO visit. Italy’s index rose marginally.

Overall, European Index was down at 161.6 at the end of May, showing a significant drop from April 252.9 reading and down on cycle high of 393.0 recorded in November 2016. The index is now well below longer-term cycle trend line (chart below). 

However, latest drop is confirming overall extreme degree of uncertainty volatility over the last 18 months, and thus remains insufficient to reverse the upward trend in the ‘fourth’ regime period (chart below).


Despite post-election moderation, France continues to lead EPUI to the upside, while Germany and Italy remain two drivers of policy uncertainty moderation. This is confirmed by the period averages chart below:


Overall, levels of European policy uncertainty remain well-above pre-2009 averages, even following the latest index moderation.

Wednesday, June 7, 2017

7/6/17: Equity Markets Continue to Mis-price Policy Risks


There has been some moderation in the overall levels of Economic Policy Uncertainty, globally, over the course of May. The decline was primarily driven by European Uncertainty index falling toward longer-term average (see later post) and brings overall Global EPU Index in line with longer term trend (upward sloping):


This meant that short-term correlation between VIX and Global EPUI remained in positive territory for the second month in a row, breaking negative correlations trend established from October 2015 on.

The trends in underlying volatility of both VIS and Global EPUI remained largely the same:


The key to the above data is that equity markets risk perceptions remain divorced from political risks and uncertainties reflected in the Global EPUI. This is even more apparent when we consider actual equity indices as done below:

Both, on longer-run trend comparative and on shorter term level analysis bases, both S&P 500 and NASDAQ Composite react in the exactly opposite direction to Global Economic Policy Uncertainty measure: rising uncertainty in the longer run is correlated with rising equities valuations.

Friday, April 28, 2017

Tuesday, February 28, 2017

28/2/17: Sentix Euro Breakup Contagion Risk Index Explodes


Sentix Euro Break-up Contagion Index - a market measure of the contagion risk from one or more countries leaving the euro area within the next 12 months period - has hit its post-2012 record recently, reaching 47.6 marker, up on 25 trough in 2Q 2016:


Key drivers: Greece, Italy and France.

Details here: https://www.sentix.de/index.php/sentix-Euro-Break-up-Index-News/euro-break-up-index-die-gefaehrlichen-drei.html.

Friday, February 24, 2017

23/2/17: Welcome to the VUCA World


Much has been said recently about the collapse of ‘risk gauges’ in the financial markets, especially on foot of the historically low readings for the markets’ ‘fear index’, VIX. In terms of medium-term averages, current VIX readings are closely matching the readings for the period of ‘peak’ ‘Great Moderation’ of 1Q 2005 - 4Q 2006, while on-trend, VIX is currently running below 2005-2006 troughs. In other words, risk has effectively disappeared from the investors’ (or rather traders and active managers) radars (see chart below).

At the same time, traditional perceptions of risk in the financial markets have been replaced by a sky-rocketing uncertainty surrounding the real economy, and especially, economic policies. The Economic Policy Uncertainty Indices have been hitting all-time highs globally (see chart below), and across a range of key economies (see this for my recent analysis for Europe: http://trueeconomics.blogspot.com/2017/01/15117-2016-was-year-of-records-breaking.html, this for Russia and the U.S.: http://trueeconomics.blogspot.com/2017/01/17117-russian-economic-policy.html). In current data, Economic Policy Uncertainty Index (EPUI) has been showing extreme volatility coupled with extreme valuations. Index values are rising above historical norms both in terms of medium-term averages and in terms of longer term trends.


 Another interesting feature is the direct relationship between the EPUI and VIX indices. Based on rolling correlations analysis (see chart below), the traditionally positive correlation between the two indices has broken down around the start of 2Q 2016 and since then all three measures of correlation - the 6-months, the 12-months and the 24-months rolling correlations - have trended to the downside, turning negative with the start of 2H 2016. Since November 2016, we have a four months period when all three correlations are in the negative territory, the first time this happened since June 2007 and only the second time this happened in history of both series (since January 1997). Worse, the previous episode of all three correlations being negative lasted only two months (June and July 2007), while the current episode is already 4 months long.


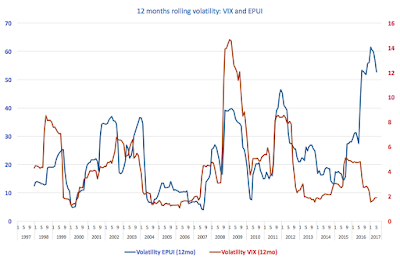
Final point worth making is that while volatility of VIX has collapsed both on trend and in level terms since the start of H1 2016 (see chart below), volatility in EPUI has shot up to historical highs.


Taken together, the three empirical observations identified above suggest that the current markets and economies are no longer consistent with increased traditional risk environment (environment of measurable and manageable risks), but instead represent VUCA (volatile, uncertain, complex and ambiguous) environment. The VUCA environment, by its nature, is characterised by low predictability of risks, with uncertainty and ambiguity driving down efficacy of traditional models for risk assessments and making less valid traditional tools for risk management. Things are getting increasingly more complex and uncertain, unpredictable and unmanageable.