Much has been said recently about the collapse of ‘risk gauges’ in the financial markets, especially on foot of the historically low readings for the markets’ ‘fear index’, VIX. In terms of medium-term averages, current VIX readings are closely matching the readings for the period of ‘peak’ ‘Great Moderation’ of 1Q 2005 - 4Q 2006, while on-trend, VIX is currently running below 2005-2006 troughs. In other words, risk has effectively disappeared from the investors’ (or rather traders and active managers) radars (see chart below).
At the same time, traditional perceptions of risk in the financial markets have been replaced by a sky-rocketing uncertainty surrounding the real economy, and especially, economic policies. The Economic Policy Uncertainty Indices have been hitting all-time highs globally (see chart below), and across a range of key economies (see this for my recent analysis for Europe:
http://trueeconomics.blogspot.com/2017/01/15117-2016-was-year-of-records-breaking.html, this for Russia and the U.S.:
http://trueeconomics.blogspot.com/2017/01/17117-russian-economic-policy.html). In current data, Economic Policy Uncertainty Index (EPUI) has been showing extreme volatility coupled with extreme valuations. Index values are rising above historical norms both in terms of medium-term averages and in terms of longer term trends.

Another interesting feature is the direct relationship between the EPUI and VIX indices. Based on rolling correlations analysis (see chart below), the traditionally positive correlation between the two indices has broken down around the start of 2Q 2016 and since then all three measures of correlation - the 6-months, the 12-months and the 24-months rolling correlations - have trended to the downside, turning negative with the start of 2H 2016. Since November 2016, we have a four months period when all three correlations are in the negative territory, the first time this happened since June 2007 and only the second time this happened in history of both series (since January 1997). Worse, the previous episode of all three correlations being negative lasted only two months (June and July 2007), while the current episode is already 4 months long.

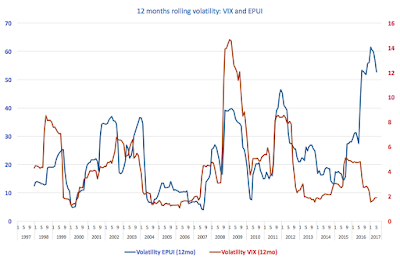
Final point worth making is that while volatility of VIX has collapsed both on trend and in level terms since the start of H1 2016 (see chart below), volatility in EPUI has shot up to historical highs.
Taken together, the three empirical observations identified above suggest that the current markets and economies are no longer consistent with increased traditional risk environment (environment of measurable and manageable risks), but instead represent VUCA (volatile, uncertain, complex and ambiguous) environment. The VUCA environment, by its nature, is characterised by low predictability of risks, with uncertainty and ambiguity driving down efficacy of traditional models for risk assessments and making less valid traditional tools for risk management. Things are getting increasingly more complex and uncertain, unpredictable and unmanageable.


