Showing posts with label US unemployment. Show all posts

Thursday, June 18, 2020

18/6/20: America's Scariest Charts Updated


Weekly data for initial unemployment claims for the week ending June 13, 2020 is out, so here are the updated 'America's Scariest Charts':

Index of employment, benchmarked to the pre-recession peak employment:


Estimated total non-farm payrolls:


And initial unemployment claims, half-year running sum:


Today's initial unemployment claims came in at 1,561,267 for the week ending June 6, 2020 (final estimate), slightly up on previous preliminary estimate. For the week ending June 13, 2020, non-seasonally adjusted initial unemployment claims came in at a preliminary estimate of 1,433,027.

A summary table to put these numbers into historical comparative:


Some recent context on the latest official employment numbers from earlier this month is provided here: https://trueeconomics.blogspot.com/2020/06/11620-americas-scariest-charts-updated.html.

Friday, June 12, 2020

11/6/20: America's Scariest Charts Updated


The latest data on initial unemployment claims for the week ending June 6, 2020 is out today (release here: https://oui.doleta.gov/press/2020/061120.pdf). Initial unemployment claims are up another 1,537,120 in one week, though the rate of new additions is down slightly on the revised 1,620,010 new claims in the week ending May 30, 2020.

Here is the summary of the claims and jobs losses during the current recession as compared to all previous post-WW2 recessions:


Cumulative estimated jobs losses so far in this recession amount to 21,088,120, though this number is likely to change as we get more updates on actual employment figures. Cumulative number of new unemployment claims filed in this recession stands at 40,358,315. This number includes those who were denied benefits in prior filings, but subsequently re-filed their claims. Nonetheless, the number is an important indicator of just how woefully horrific the COVID19 pandemic has been on U.S. labour force.

Updating data for June for Non-Farm Payrolls, and incorporating official number for May 2020, reported last week:


Estimated payroll numbers are now down to the levels las seen in 3Q 2000, effectively implying that COVID19 has ashed more jobs than were created in almost the entire 21 years of this century.

Here is another way to visualize the above data:


Here is what this week's initial claims print means for the index of jobs market performance during the current recession, compared to the already widely-debunked optimistic jobs report of last week for May:

In effect, this week largely destroyed most of the 2.509 million jobs created myth paraded by President Trump last week. In reality, of course, we know that that jobs creation print was to a large extent the outrun of re-registrations and benefits expirations, plus the figment of the BLS data collection methods. For the best explanation of these factors, read: https://www.thestreet.com/mishtalk/economics/surprise-the-bls-admits-another-phony-jobs-report and my take on this is: https://trueeconomics.blogspot.com/2020/06/5620-incredible-jobs-report-meets.html.

Friday, June 5, 2020

5/6/20: "Incredible" Jobs Report Meets Reality


Some updates on the jobs report this morning for the U.S.

Political reaction:

Reality bites:

New initial unemployment claims last week: 1,603,000. Putting this into perspective:


Which brings latest non-farm payrolls figures back to 1Q 2000 levels:


So, yeah, right, "tremendous" or put differently, we have 20 years worth of jobs destroyed. Non-farm payrolls increase of 2,509,000 is a good thing at the tail end of May, but the average weekly new unemployment claims increases from March 14 through May 30 currently stand at 3,527,650. This means the "tremendous" gains are just 71% of the weekly average losses.

Beware of morons brigades pushing the successories posters.

Thursday, May 28, 2020

28/5/20: America's Scariest Charts Updated


It is Thursday, so time to update U.S. initial unemployment claims counts and labor markets charts for the data through the end of last week:

A summary table first:

Per latest, initial unemployment claims increased in the week through May 23rd by 1,914,958, marking a major slowdown on the previous weeks' increase, but still running new unemployment claims additions at a rate in excess of 1 million per week, for the 10th consecutive week.

This means that from the start of March 2020 through the week ending May 23rd, total number of initial unemployment claims filed in the U.S. stands at 37,198,539. For comparison, cumulative jobs losses in all recessions since 1945 and through the recession of 2009-2010 amount to 31,664,000.

Adjusting for timings of new unemployment claims and for the most current data on actual non-farm employment, the chart below provides an estimate for current non-farm employment in the U.S.:


Current estimated non-farm employment is at 121,021,000, down from 152,442,000 in February 2020. Current employment, therefore is estimated at around the levels last seen in October 1997.

The chart below plots the history of the initial unemployment claims, using 26 weeks (half-year) cumulative:


In the entire history of the data series for initial unemployment claims, prior to COVID19, there is only one week in which total claims exceeded 1 million mark, the second week of January 1982, when the new claims hit 1,073,500. During the Great Recession, the worst week for initial unemployment claims saw claims rising 956,791. Over the last 10 weeks, the average weekly initial claims filings stood at 3,719,854, which is roughly equivalent to five worst weeks of the Great Recession combined (weeks of 27/12/2008 - 24/01/2009).

Here is a chart showing U.S. employment index across past recessions and post-recession recoveries:


Thursday, May 21, 2020

21/5/20: Weekly Unemployment Claims: Updated


In the previous post, I have updated one of the charts relating to the U.S. labor market, namely the chart on employment https://trueeconomics.blogspot.com/2020/05/21520-horror-show-of-covid19.html. The data used is a mixture of monthly employment numbers and within-month weekly unemployment claims.

For consistency, here is the chart plotting weekly unemployment claims based on half-year cumulative numbers:


21/5/20: The Horror Show of COVID19 Unemployment


New initial claims data is out for last week, and so time to update one of my scary charts:


Here is a summary table:


At 2,174,329 new claims filed in the week ending May 16th, the lowest number in weekly new claims since the start of the COVID19 pandemic, it's quite tempting to say that things are improving in the labor markets. Alas, last week's print was greater than the entire recession period combined prints of four past recessions.

Cumulative first claims filed in the last 9 weeks now stand at 35,276,270, which amounts to 23.2 percent of the entire non-farm labor force in the U.S. at December 2019. 

Friday, May 15, 2020

15/5/20: America's Scariest Charts Updated


Updating my America's Scariest Charts for the latest data on weekly unemployment claims:


New unemployment claims continue to rise (see table below), with data for the week ending May 9th coming in this week printing 2.6 million new claims.

While non-farm payrolls are reported on a monthly basis, we can now integrate the numbers of new unemployment claims (subject to future revisions) for the first week of may, showing the expected impact on the payrolls:


Table below summarizes past recessions experience and current COVID19 'Pandecession':


As shown above, total numbers of jobs losses so far in the pandemic exceed combined jobs losses experienced in all past recessions from 1945 through 2019, based on unemployment claims data.

Finally, here is a chart plotting employment index from the start of the new recession through the end of the recovery cycle:


Friday, May 8, 2020

8/5/20: The Path of a Tornado: U.S. Labour Force Numbers for April


So, BLS just printed their April 2020 numbers of official non-farm payrolls: https://www.bls.gov/news.release/empsit.t01.htm. And things are, expectedly, ugly.

Civilian 'non-institutional' population is up 1,203,000 y/y, while employment is down 23,384,000. Official unemployment i up from 3.3% in April 2019 to 14.4% in April 2020. Number not in the labour force are up 7,470,000 and numbers in unemployment are up 17,117,000 y/y. Which means that those out of employment are now up 24,587,000 year on year. Labour force participation rate is down from 62.7 in April 2019 to 60.0 in April 2020. In April 2019, 60.58 percent of the non-institutional American population was in employment. In April 2020 this figure was 51.30 percent. Which means that, excluding jails and military, almost 50 Americans out of 100 were not working even part-time.

Here's a summary of y/y comparatives by education status:


As the result of the massive wave of jobs destruction primarily concentrated in the lower wages categories of services workers, U.S. average labour earnings managed to actually increase (see a post on this from our friends at the Global Macro Monitor: https://global-macro-monitor.com/2020/05/08/bad-look-of-high-stock-prices-high-unemployment/). In  fact, combined effects of exits from the labour force and unemployment increases for those with less than college degree amount to 74 percent (three quarters) of all jobs destruction compared to April 2019.


With this, based on the data through the week of May 2, 2020, total employment levels in the U.S. are now down to the levels of October-November 1999.

Meanwhile, things are going swimmingly for the financial markets recoveries:


Only foreclosures and evictions delays, unemployment checks and rent rollups are holding back a wave of mass discontent these days.

Sunday, May 3, 2020

3/5/20: Updated: The Scariest Chart in Economics


Updating one of the two 'Scariest Charts' in economics with the latest data - preliminary, through April 25, 2020:


This goes hand-in-hand with the earlier chart here: https://trueeconomics.blogspot.com/2020/05/3520-updated-shocking-wave-of-jobs.html

The speed and the depth of jobs destruction in the U.S. during the last two months has been beyond precedent. 

3/5/20: Updated: Shocking Wave of Jobs Destruction


Updating my previous post on the subject of jobs losses in the U.S. (https://trueeconomics.blogspot.com/2020/04/230420-shocking-wave-of-jobs.html):


We are now one week away from the unemployment claims filed in March-May 2020 exceeding the grand total of all jobs destroyed during all U.S. recessions between 1945 and 2019. That is, before actually exceeding the number of all jobs destroyed over all recessions over 75 years combined.

Current estimated non-farm payrolls are approximately back to 1997 levels, throwing payroll numbers some 23 years back within the span of just 2 months:


Thursday, April 23, 2020

23/04/20: Shocking Wave of Jobs Destruction in the U.S. Update


Updating my earlier post https://trueeconomics.blogspot.com/2020/04/18420-shocking-wave-of-jobs-destruction.html with latest data through April 18, 2020:


Five weeks worth of jobs destructions / furloughs since the onset of COVID19 pandemic is now greater than all jobs destroyed in all U.S. recessions from 1953 through 2009.

23/4/20: U.S. Labor Force Participation Rate Heading into COVID19 Disaster


Adding to the two scariest charts in economic history (see https://trueeconomics.blogspot.com/2020/04/1942020-two-scariest-charts-in-economic.html), a third chart, showing changes in the U.S. labor force participation rates during and following recessions:

The above clearly shows that 2008-2009 recession has been unique in the history of the U.S. economy not only in terms of the unprecedented duration of unemployment (link above), but also in terms of the scale of exits from the labor force. In fact, this was the first recession on record that resulted in post-recession recovery not reaching pre-recession high in terms of labor force participation rates.

Sunday, April 19, 2020

19/4/2020: Two Scariest Charts in Economic History


I have been posting quite a bit on U.S. unemployment and jobs destruction numbers coming from the COVID-19 pandemic. So here are two charts to watch into the future, and I will be updating these throughout the crisis here.

The first chart plots evolution of non-farm payrolls index for each official recession. I used as the index base average payroll numbers for 6 months prior to the first month of the recession. I then compute and plot the index from month 1 of the recession through the last month prior to the next recession.


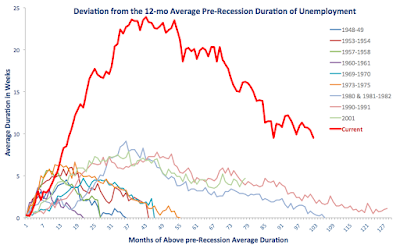
The second chart is the average duration of unemployment claims or average weeks unemployed. Again, series start from the first month of officially-declared recession and run until the subsequent recession.

Both charts illustrate the contradictory nature of the post-2008-2009 recession recovery. Whilst the recovery has been the longest in duration (chart 1 above), it has not been the most dramatic in terms of employment creation relative to prior pre-recession peak (line "2008-2009" solid segment runs longer than any other line, but does not gain heights of at least 6 prior recoveries.  Per chart 2 above, recovery from 2008-2009 recession has been associated with unprecedented length of duration of unemployment. The series here stop at the end of February 2020, so they do not account for the recent jobs losses, simply because there has not been, yet, official announcement of a recession.

You can read on March-April jobs losses here: https://trueeconomics.blogspot.com/2020/04/16420-four-weeks-of-true-unemployment.html and in the context of prior recessions here: https://trueeconomics.blogspot.com/2020/04/18420-shocking-wave-of-jobs-destruction.html.

Stay tuned, as I will be updating these two charts as data arrives.

18/4/20: Shocking Wave of Jobs Destruction in the U.S.


The last four weeks witnessed an unprecedented level of jobs shut down in the U.S. (and elsewhere in the world). My earlier post here https://trueeconomics.blogspot.com/2020/04/16420-four-weeks-of-true-unemployment.html provided some comparatives. But here is a summary of jobs losses in every U.S. recessions from 1945 through 2019, and comparative figures for jobs losses in March to mid-April 2020:


Put simply, last four weeks of U.S. jobs shut downs are roughly equivalent to the total jobs losses in all U.S. recessions 1945-2002, or, looking in the opposite direction, to all jobs losses in every recession from 1960 through 2009.

As an important aside, U.S> recoveries have been slower and slower in recent decades in terms of jobs creation. 2007-2009 recession took 76 month to restore jobs numbers to pre-recession peak, while 2001 recession took 47 months. In fact, the last four recessions rank as the worst, second worst, fourth worst and fifth worst in terms of jobs recoveries.

This is not to say that the post COVID-19 shutdown recovery is going to be even longer - after all, the last four weeks saw shut down of jobs, not necessarily destruction of jobs, so some of the shut down jobs will be restored as soon as economic activity recovers. Nonetheless, the above numbers really are shocking.

Thursday, April 16, 2020

16/4/20: Four Weeks of True Unemployment Numbers: #Covid19


The U.S. has added 5.245 million more unemployment claims in the week ending April 11, 2020, with additional 9,000 claims added to the April 4, 2020 week total. In summary,

  • Week ending March 21: official unemployment figures rose 3,307,000
  • Week ending March 28: new claims 6,867,000
  • Week ending April 4: new claims 6,615,000
  • Week ending April 11: new claims 5,245,000

Four weeks total is now 22,034,000. As noted here: https://trueeconomics.blogspot.com/2020/04/1342020-four-weeks-of-unemployment.html last four weeks of increases in unemployment in the U.S. have fully erased all cumulative jobs gained during the 2009-2019 'recovery' period.

This is by a mile not a fully accurate picture of true extent of jobs losses. As noted by the researchers in the https://bfi.uchicago.edu/insight/blog/key-economic-facts-about-covid-19/#unemployment-rate: many unemployed do not seek unemployment benefits, opting to drop out of the labor force instead. Why?

  1. Eligibility for unemployment assistance is quite restrictive in the U.S.
  2. States' unemployment support systems are both cumbersome and severely overloaded in the present environment.
  3. Many unemployed fear Federal retribution against their migrant spouses (including legal migrants) and many are themselves on green cards, making them a potential target for removals.
  4. Many unemployed become severely discouraged by the lack of potential jobs to continue job-seeking.
University of Chicago researchers used data from Nielsen survey to estimate the impact of early stage Covid pandemic on labor force participation rates. These numbers imply a drop in labor force participation from the officially-reported 64.2% to 57%. 

The research conducted through April 8th suggested that some 20 million Americans have lost their jobs due to COVID19. Adding to these 3 days to get us through April 11 would have pushed the total number of unemployed to around 3,140,000-3,969,000 more unemployed to the 22,034,000 total reported above. Splitting the difference, we can estimate new claims filed, pending and not filed due to reasons (1)-(4) above at closer to 25,500,000. 

My estimates are roughly in line with those prepared by Alexander Bick of ASU, who estimated (https://azbigmedia.com/business/unemployment-rate-jumps-from-4-5-to-20-2-asu-analysis-shows/) that through the second week of April:

  • The employment rate decreased from 72.7% to 60.7%, implying 24 million jobs lost
  • The unemployment rate increased from 4.5% to 20.2%
  • Hours worked per working age adult declined 25% from the second week of March.

Monday, April 13, 2020

13/4/20: Four Weeks of Unemployment Spikes: U.S. Jobs Losses in #Covid19


COVID-19 social toll: according to Deutsche Bank Research, since the end of the 2008-2009 Great Recession through mid-March 2020, the U.S. total new jobs creation amounted to ca 22 million jobs. Since then, the economy has lost over 16.8 million jobs over the first three weeks of the pandemic, and according to the DB forecast, the U.S. is now on-track to lose 25 million jobs over the four weeks, once last week numbers come in.


  • Week ending March 21: official unemployment figures rose 3.3 million
  • Week ending March 28: official unemployment claims rise 6.9 million
  • Week ending April 4: additional 6.6 million new unemployment claims
  • Week ending April 11: ???
Note: claims filed do not fully reflect actual unemployment levels in the economy. In fact, they underestimate, severely, the true extent of unemployment.

Now, remember, the Millennials entered their careers in the periods of the Global Financial Crisis, the Great Recession and the Eurozone debt crisis. They are now going through career maturation stage (faster growth in income stage) amidst this pandemic. Or as I asked on Twitter a few minutes ago: who is going to buy Boomers' properties inherited by X-ers if the Millennials are skinned?..

Monday, January 2, 2017

2/1/16: Remember that America's Scariest Chart?


As promised in the previous post, here is a look at yet another wrinkle in the U.S. jobs creation saga. The following used to be referred to as the America's Scariest Chart some years back, until all analysts stopped tracking it. Well, all, save for myself - and for a good reason.

Since the election of Donald Trump, the U.S. media has been full of praise for President Obama's record on economic recovery, setting the stage for an argument that Trump Administration is about to inherit a very strong economy, the one that, in mainstream media's minds, Trump is likely to mess up.

So lets do a simple exercise. Take current level of employment (non-farm payrolls) and compare it to the pre-crisis average levels of employment. Represented as an index, this comparative can be performed for every recession since the end of WW2. Chart below illustrates the results:


As the chart above clearly shows:

  1. Today's employment figures represent the worst recovery from a recession on record (for any terminal point of previous recoveries, current recovery is associated with lower employment levels).
  2. Even stretching time of this recovery to present day - yielding the second longest period of a recovery since 1945, after the 1990 episode - current recovery is still the worst performing one.
  3. Looking at the slope of the 2008 line, increases in employment relative to pre-crisis situation are weaker in the current post-crisis recovery than in every other recovery, except the 2001.
Now, this is not to put the blame for the weak recovery on the shoulders of President Obama. Presidential policies have little short term impact on unemployment and it takes cooperative Congress to structure and enact longer-term policies. But this does dispute the media-promoted view of the U.S. labour markets are being in rude health. President-elect is not about to inherit a spotless jobs market from his predecessor. America's Scariest Chart still confirms as much.

2/1/17: U.S. Unemployment Duration is Still Record-Busting


Throughout recent years, the recovery meme, played across the mainstream media in the U.S. has provided endless support to President Obama’s approval ratings. During POTUS 2016 election, the said meme was used by Hillary Clinton to challenge the ‘things aren’t so great in America’ views of Bernie Sanders and, subsequently, the echoes of the same from Donald Trump. Since the election, the recovery story has been billed as the ‘strong economy’ legacy that President Obama will be leaving for his predecessor to mess with - the basis for setting up the incoming Trump Administration for any potential fall, should economic fortunes of the recovery were to falter.

The central point of the U.S. recovery story - absent any appreciable growth in productivity, capital investment, and sectoral value added - was the only bright spot on the U.S. economic horizon: the labour markets. In fact, the U.S. headline unemployment figures have shown very strong gains, and jobs creation has been robust, with more recent data showing improvements (at long last) in households’ incomes. All of these indicators can and have been robustly challenged in terms of the extent to which they show true nature of improvements. However, they have been taken, predominantly, as read. Improvements are improvements, and gains are gains.

And as the readers of my blog and media articles would have known, the story is never complete, if one looks only at headline figures. Reality is always more complex.

So to show you this complexity at work, let’s look at one official indicator of the health of the labour markets in the U.S. - duration of unemployment. If the U.S. economy is really awash with jobs, and if the true unemployment rate is really sitting at 4.9 percent, the duration of unemployment should not only be declining on average, but it should be closer to ‘normal’ non-recessionary reading. Right?

Take a look at the following chart based on data from the St Louis Federal Reserve database, Fred:


Yes, duration of unemployment peaked in January 2011 at 40.7 weeks and since then fallen to 26.3 weeks (as of November 2016), but 26.3 weeks for average unemployment benefits duration is still above any previous recession since 1948 on.

Now, as er return to normalcy. During 1990-1991 and 2001 recessions, recovery failed to completely reduce average duration of unemployment back to pre-recessionary norms. In simple terms, after the end of recession, in 1990-1991 and 2001 downturns, on average, unemployed people remained in unemployment longer than before recessions. These were the first two recession on record that resulted in this change in structural unemployment duration.

Now, consider 2008 recession. Chart below illustrates what happened to the ‘new normal’ duration of unemployment spells. Specifically, chart below plots the difference between average duration of unemployment during recession and recovery and the average duration of unemployment in 12 months prior to the onset of each recession. Returning to normal here would mean getting duration gap closer to zero.


Again, current (since 2008) recovery is clearly the worst for all post-recessionary episodes on record. Currently, duration of unemployment is 9.5 weeks, on average, longer than it was during the last 12 months of pre-2008 recession. Which is bad enough to be worse than the peak deviation for any recession in modern history.

What is happening here? The fabled U.S. jobs creation recovery is really a combination of several factors. One of these is genuine increases in jobs being created, which drives unemployment down. Another is demographic: U.S. labour force is expanding, and as it does, employment creation get swallowed by new entrants into labour force, while many existent unemployed are either exiting the labour force, or remaining on unemployment benefits longer. Of course, putting younger workers to work is a good thing. But squeezing older unemployed out of workforce is not.

There are serious problems with highly elevated (to-date) duration of U.S. unemployment that few politicians are willing to talk about. For one, longer duration of unemployment implies lower probability of transition into employment. Secondly, it also implies higher probability of future unemployment in future recessions. Thirdly, it implies more severe losses in skills, human capital, health, social well-being, etc. In other words, costs of unemployment rise faster for longer duration of unemployment.

Which makes you pause and think: is the legacy of the Obama administration on jobs is that impressive? Really? Well, stay tuned for more...

Sunday, June 7, 2015

7/6/15: Updating America's Scariest Charts... The Ones You Forgot About


Remember the Old America's Scariest Chart (http://trueeconomics.blogspot.ie/2014/06/662014-king-of-scariest-charts-is-dead.html) and my own New America's Scariest Chart (http://trueeconomics.blogspot.ie/2014/11/16112014-americas-scariest-chart.html). Well, a year ago, the formal one officially 'died'... as in disappeared from the mainstream media.

Question is: did it? Really?

So here is updating the Old America's Scariest Chart (and improving on the original) to current data:

Summary of the lessons from the above: America's jobs recovery in the current cycle is the worst on record for post-WW2 period in terms of recovering the jobs lost. It is second worst on record in terms of post-recovery jobs growth (the worst case being 1953 recession, which simply run into 1957 recession, but taking the two recessions jointly actually delivers better performance than the current recovery period).

And updating the New America's Scariest Chart:


Summary of the lessons from the above: yep, this cycle is also the worst in history for average duration of unemployment.

Happy recovery, U.S. of A. and a happier one, yet, to Europe.

Friday, March 6, 2015

6/3/15: US NPF: Another Feel-Good Print with Bitter Aftertaste


My take on the US Non-Farm Payroll numbers in few tweets with some RTs:

Good news:


Why German cars? Because:
And bad: the unemployment rate falling to 5.5% means Fed hike moves closer and this, perversely, means Government debt cost for the US is going to rise (I know, I know, it is perverse, but...):
 But the 'bad' gets worse:

The above mans that US now has historically high level of people who are not in the labour force - some 98.9 million all ... meanwhile...


 ...aaaand.... jobs increases are not in higher value-added sectors:
 

 So to sum this all up:


 Done.