Showing posts with label America's Scariest Chart. Show all posts

Friday, June 26, 2020

25/6/20: America's Scariest Charts Updated


Trump cheers today's unemployment figures... and...


Week of June 13th non-seasonally adjusted new unemployment claims were revised up to 1,463,363, from 1,433,027 published a week ago.

First estimate for the week of June 20th came in at 1,457,373.

Total initial unemployment claims filed so far during the COVID19 pandemic now sit at a massive, gargantuan 43,303,196, while estimated jobs losses (we only have official data for these through May, so using June unemployment claims to factor an estimate) are at 24,033,000. Putting this into perspective, combined losses of jobs during all recessions prior to the current one from 1945 through 2019 amount to 31,664,000.

A visual to map things out:


Charted differently:

Let's put this week's number into perspective: last week marked 14th worst week from January 1, 1967 through today. Here is tally of COVID19 initial claims ranks in history:


This is pretty epic, right? We are cheering 14th worst week in history. Note: all 14 worst weeks in history took place during this pandemic.

Of course, not all of the last week's initial unemployment claims are new claims. Initial claims can arise from people who have been kicked off prior unemployment rolls, who were denied unemployment filed earlier and so on. But the numbers above are dire. Disastrously dire. No matter how we spin the table.

Thursday, June 18, 2020

18/6/20: America's Scariest Charts Updated


Weekly data for initial unemployment claims for the week ending June 13, 2020 is out, so here are the updated 'America's Scariest Charts':

Index of employment, benchmarked to the pre-recession peak employment:


Estimated total non-farm payrolls:


And initial unemployment claims, half-year running sum:


Today's initial unemployment claims came in at 1,561,267 for the week ending June 6, 2020 (final estimate), slightly up on previous preliminary estimate. For the week ending June 13, 2020, non-seasonally adjusted initial unemployment claims came in at a preliminary estimate of 1,433,027.

A summary table to put these numbers into historical comparative:


Some recent context on the latest official employment numbers from earlier this month is provided here: https://trueeconomics.blogspot.com/2020/06/11620-americas-scariest-charts-updated.html.

Friday, June 12, 2020

11/6/20: America's Scariest Charts Updated


The latest data on initial unemployment claims for the week ending June 6, 2020 is out today (release here: https://oui.doleta.gov/press/2020/061120.pdf). Initial unemployment claims are up another 1,537,120 in one week, though the rate of new additions is down slightly on the revised 1,620,010 new claims in the week ending May 30, 2020.

Here is the summary of the claims and jobs losses during the current recession as compared to all previous post-WW2 recessions:


Cumulative estimated jobs losses so far in this recession amount to 21,088,120, though this number is likely to change as we get more updates on actual employment figures. Cumulative number of new unemployment claims filed in this recession stands at 40,358,315. This number includes those who were denied benefits in prior filings, but subsequently re-filed their claims. Nonetheless, the number is an important indicator of just how woefully horrific the COVID19 pandemic has been on U.S. labour force.

Updating data for June for Non-Farm Payrolls, and incorporating official number for May 2020, reported last week:


Estimated payroll numbers are now down to the levels las seen in 3Q 2000, effectively implying that COVID19 has ashed more jobs than were created in almost the entire 21 years of this century.

Here is another way to visualize the above data:


Here is what this week's initial claims print means for the index of jobs market performance during the current recession, compared to the already widely-debunked optimistic jobs report of last week for May:

In effect, this week largely destroyed most of the 2.509 million jobs created myth paraded by President Trump last week. In reality, of course, we know that that jobs creation print was to a large extent the outrun of re-registrations and benefits expirations, plus the figment of the BLS data collection methods. For the best explanation of these factors, read: https://www.thestreet.com/mishtalk/economics/surprise-the-bls-admits-another-phony-jobs-report and my take on this is: https://trueeconomics.blogspot.com/2020/06/5620-incredible-jobs-report-meets.html.

Friday, June 5, 2020

5/6/20: "Incredible" Jobs Report Meets Reality


Some updates on the jobs report this morning for the U.S.

Political reaction:

Reality bites:

New initial unemployment claims last week: 1,603,000. Putting this into perspective:


Which brings latest non-farm payrolls figures back to 1Q 2000 levels:


So, yeah, right, "tremendous" or put differently, we have 20 years worth of jobs destroyed. Non-farm payrolls increase of 2,509,000 is a good thing at the tail end of May, but the average weekly new unemployment claims increases from March 14 through May 30 currently stand at 3,527,650. This means the "tremendous" gains are just 71% of the weekly average losses.

Beware of morons brigades pushing the successories posters.

Sunday, May 3, 2020

3/5/20: Updated: The Scariest Chart in Economics


Updating one of the two 'Scariest Charts' in economics with the latest data - preliminary, through April 25, 2020:


This goes hand-in-hand with the earlier chart here: https://trueeconomics.blogspot.com/2020/05/3520-updated-shocking-wave-of-jobs.html

The speed and the depth of jobs destruction in the U.S. during the last two months has been beyond precedent. 

Thursday, April 23, 2020

23/4/20: U.S. Labor Force Participation Rate Heading into COVID19 Disaster


Adding to the two scariest charts in economic history (see https://trueeconomics.blogspot.com/2020/04/1942020-two-scariest-charts-in-economic.html), a third chart, showing changes in the U.S. labor force participation rates during and following recessions:

The above clearly shows that 2008-2009 recession has been unique in the history of the U.S. economy not only in terms of the unprecedented duration of unemployment (link above), but also in terms of the scale of exits from the labor force. In fact, this was the first recession on record that resulted in post-recession recovery not reaching pre-recession high in terms of labor force participation rates.

Sunday, April 19, 2020

19/4/2020: Two Scariest Charts in Economic History


I have been posting quite a bit on U.S. unemployment and jobs destruction numbers coming from the COVID-19 pandemic. So here are two charts to watch into the future, and I will be updating these throughout the crisis here.

The first chart plots evolution of non-farm payrolls index for each official recession. I used as the index base average payroll numbers for 6 months prior to the first month of the recession. I then compute and plot the index from month 1 of the recession through the last month prior to the next recession.


The second chart is the average duration of unemployment claims or average weeks unemployed. Again, series start from the first month of officially-declared recession and run until the subsequent recession.

Both charts illustrate the contradictory nature of the post-2008-2009 recession recovery. Whilst the recovery has been the longest in duration (chart 1 above), it has not been the most dramatic in terms of employment creation relative to prior pre-recession peak (line "2008-2009" solid segment runs longer than any other line, but does not gain heights of at least 6 prior recoveries.  Per chart 2 above, recovery from 2008-2009 recession has been associated with unprecedented length of duration of unemployment. The series here stop at the end of February 2020, so they do not account for the recent jobs losses, simply because there has not been, yet, official announcement of a recession.

You can read on March-April jobs losses here: https://trueeconomics.blogspot.com/2020/04/16420-four-weeks-of-true-unemployment.html and in the context of prior recessions here: https://trueeconomics.blogspot.com/2020/04/18420-shocking-wave-of-jobs-destruction.html.

Stay tuned, as I will be updating these two charts as data arrives.

Monday, January 2, 2017

2/1/17: U.S. Unemployment Duration is Still Record-Busting


Throughout recent years, the recovery meme, played across the mainstream media in the U.S. has provided endless support to President Obama’s approval ratings. During POTUS 2016 election, the said meme was used by Hillary Clinton to challenge the ‘things aren’t so great in America’ views of Bernie Sanders and, subsequently, the echoes of the same from Donald Trump. Since the election, the recovery story has been billed as the ‘strong economy’ legacy that President Obama will be leaving for his predecessor to mess with - the basis for setting up the incoming Trump Administration for any potential fall, should economic fortunes of the recovery were to falter.

The central point of the U.S. recovery story - absent any appreciable growth in productivity, capital investment, and sectoral value added - was the only bright spot on the U.S. economic horizon: the labour markets. In fact, the U.S. headline unemployment figures have shown very strong gains, and jobs creation has been robust, with more recent data showing improvements (at long last) in households’ incomes. All of these indicators can and have been robustly challenged in terms of the extent to which they show true nature of improvements. However, they have been taken, predominantly, as read. Improvements are improvements, and gains are gains.

And as the readers of my blog and media articles would have known, the story is never complete, if one looks only at headline figures. Reality is always more complex.

So to show you this complexity at work, let’s look at one official indicator of the health of the labour markets in the U.S. - duration of unemployment. If the U.S. economy is really awash with jobs, and if the true unemployment rate is really sitting at 4.9 percent, the duration of unemployment should not only be declining on average, but it should be closer to ‘normal’ non-recessionary reading. Right?

Take a look at the following chart based on data from the St Louis Federal Reserve database, Fred:


Yes, duration of unemployment peaked in January 2011 at 40.7 weeks and since then fallen to 26.3 weeks (as of November 2016), but 26.3 weeks for average unemployment benefits duration is still above any previous recession since 1948 on.

Now, as er return to normalcy. During 1990-1991 and 2001 recessions, recovery failed to completely reduce average duration of unemployment back to pre-recessionary norms. In simple terms, after the end of recession, in 1990-1991 and 2001 downturns, on average, unemployed people remained in unemployment longer than before recessions. These were the first two recession on record that resulted in this change in structural unemployment duration.

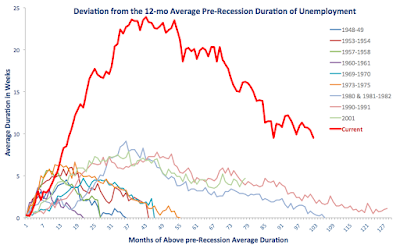
Now, consider 2008 recession. Chart below illustrates what happened to the ‘new normal’ duration of unemployment spells. Specifically, chart below plots the difference between average duration of unemployment during recession and recovery and the average duration of unemployment in 12 months prior to the onset of each recession. Returning to normal here would mean getting duration gap closer to zero.


Again, current (since 2008) recovery is clearly the worst for all post-recessionary episodes on record. Currently, duration of unemployment is 9.5 weeks, on average, longer than it was during the last 12 months of pre-2008 recession. Which is bad enough to be worse than the peak deviation for any recession in modern history.

What is happening here? The fabled U.S. jobs creation recovery is really a combination of several factors. One of these is genuine increases in jobs being created, which drives unemployment down. Another is demographic: U.S. labour force is expanding, and as it does, employment creation get swallowed by new entrants into labour force, while many existent unemployed are either exiting the labour force, or remaining on unemployment benefits longer. Of course, putting younger workers to work is a good thing. But squeezing older unemployed out of workforce is not.

There are serious problems with highly elevated (to-date) duration of U.S. unemployment that few politicians are willing to talk about. For one, longer duration of unemployment implies lower probability of transition into employment. Secondly, it also implies higher probability of future unemployment in future recessions. Thirdly, it implies more severe losses in skills, human capital, health, social well-being, etc. In other words, costs of unemployment rise faster for longer duration of unemployment.

Which makes you pause and think: is the legacy of the Obama administration on jobs is that impressive? Really? Well, stay tuned for more...

Saturday, September 5, 2015

5/9/15: Updating America's Scariest Chart


As you know I rarely post on the U.S. economy. But recently I was updating a presentation involving the state of financial flows for retail investors and savers around the world and had to check up on my old chart that I labeled America's Scariest Chart Redux (see previous update here).

Keep in mind the dominant media meme: the U.S. economy has been growing at a robust rate and the Great Recession has been officially over now for 74 months.

So where does the current unemployment duration (in terms of average duration in weeks) stand?


Err... average duration of unemployment in the U.S. is currently at 28.4 weeks.  Over 12 months period before the onset of the Great Recession, duration averaged 16.8 weeks. Which means that even today, a full 87 months after the start of the Great Recession, average duration of unemployment is 11.6 weeks longer than it was before the crisis. Current deviation from pre-crisis levels in average duration of unemployment is consistent with this measure of labour markets performance in months 17-18 of the crisis.

Worse, we are now (still) in a situation where people on unemployment benefits are staying in unemployment longer, on average, than in any other recession on record.

Now, let's revisit the 'official' former Scariest Chart - the index of employment also plotted by each recessionary period. This chart used to be published regularly, but since end of March 2014, U.S. employment index has finally reached pre-crisis levels of employment and everyone forgot the said chart. Too bad. Here it is, updated to the latest data:


And guess what? The chart above clearly shows that the current period of 'recovery' is still the worst in terms of employment performance than any previous recovery on record.

Just thought you would like an update...