Tuesday, June 30, 2020

30/6/20: COVID19 Impact on SMEs and Employment


Some really good mapping in terms of financial exposures/risk and COVID19 vulnerabilities within the U.S. small and medium enterprises sectors, via McKinsey & Co:

Source: https://www.mckinsey.com/featured-insights/americas/which-small-businesses-are-most-vulnerable-to-covid-19-and-when. Interactive graphs: https://covid-tracker.mckinsey.com/small-business-vulnerability.

Additional: vulnerabilities across jobs https://covid-tracker.mckinsey.com/vulnerable-jobs/industry-occupation.

30/6/20: Long-Term Behavioral Implications of COVID19 Pandemic


My article on the behavioural economics and finance implications of COVID19 pandemic is now available on @TheCurrency website: https://www.thecurrency.news/articles/19675/debt-distress-and-behavioural-finance-the-post-pandemic-world-be-marked-by-deep-and-long-lasting-scars.


Hint: dealing with COVID19 impact will be an uphill battle for many and for the society and economy at large.

This is a long read piece, covering general behavioural fallout from the pandemic, and Ireland-specific data.

29/6/20: The Scale and Distributional Effects of Monetary Activism During Pandemic


A neat summary of global monetary policy supports deployed during the COVID19 pandemic via McKinsey & Co:


In effect, globally, monetary authorities are underwriting government and private corporate debt for larger companies. This, naturally, will lead to reduced investment and competition from smaller firms, including more innovative ones, raising the relative cost of debt to these companies. Both, directly and indirectly, the monetary policies favour equity investment in top-tier, larger companies, effectively increasing not only the cost of debt, but the cost of capital in the medium term for smaller and medium-sized companies.

Monday, June 29, 2020

29/6/20: Arithmetic and Retail Sales: Ireland's Case


Monthly v annual, downside v upside... when it comes to rates of change, COVID19 is a good reminder of how hard, intuitively, arithmetic can be...

Take Irish retail sales. Gloriously, monthly changes in retail sales are booming, up 29.5% m/m in volume and 28.4% in value. A 'V-shaped' thingy. Un-gloriously, year on year the sales are 26.6% in volume and 29.1% in value. But here's the ugly thingy: suppose a year ago you were retailing 1 unit (in volume or value). Annual rate of change in these was around 2.55% over 2016-2019 for value and 4.4% in volume. Which means you were 'rationally' expecting to be selling 1.0255 units in value and 1.044 units in volume around this time 2020. You are selling, instead 0.705 units in value and 0.734 units in volume. You have, prudently, planned your investment and spending allocations, based on similar expectations. Your reality is that you are down 31.3 percent on where you were supposed to be in value and 29.7 percent in volume. Notice the 'wedge' between volume and value. Deeper deterioration in value than in volume means not only that your revenue fell off, but that you are working harder to deliver on what revenue you do derive. In basic terms, you now need to be selling roughly 5 percentage points more of volume to derive the same euro value.


In simple analogy terms, you are trying to swim back to shore in a gale-force head wind, with a 12 feet swell, and against a roaring riptide. But otherwise, it's a 'V-shaped' looking thingy...

29/6/20: Eurocoin Growth Indicator June 2020


Using the latest Eurocoin leading growth indicator for the Euro area, we can position the current COVID19 pandemic-related recession in historical context.

Currently, we have two data points to deal with:

  1. Q1 2020 GDP change reported by Eurostat (first estimate) came in at -3.6 percent with HICP (12-mo average) declining from 1.2 percent in January-February to 1.1 percent in March.
  2. Q2 2020 Eurocoin has fallen from 0.13 in March 2020 to -0.37 in June 2020 and June reading is worse than -0.32 recorded in May. This suggests continued deterioration in GDP growth conditions, with an estimate of -2.1 percent decline in GDP over 2Q 2020. HICP confirms these: HiCP dropped from 1.1 percent in March 2020 to 0.9 percent in May. 
Here are the charts:


We are far, far away from the growth-inflation 'sweet spot':


Sunday, June 28, 2020

28/6/20: COVID19 Update: Top 50 Countries


Here are summary tables of stats for COVID19 pandemic for top 50 countries by cumulative number of cases, plus EU27:

First a 'heat map' legend.


28/6/20: COVID19 Update: US vs EU27


Updating charts for the pandemic development in the U.S. and the EU. Take your pick...


You can see acceleration dynamics in the U.S. cases in the chart above, and in rates below.


The U.S. is now a case-study on how not to do public health response. Now, daily cases and deaths:


There are some big revisions, especially in death counts, in the data. Both, U.S. and EU27 reporting remains shoddy and lagged. Even 7-day moving average (mid-point of 'prevalent' duration of contagious stage for COVID19) is pretty volatile. One additional caveat is that deaths do not fully reflect health impact of COVID19, since those who recover from the disease often suffer catastrophic long-term damage to their lungs.

28/6/20: COVID19 Update: World Cases and Deaths


Updating data for global COVID19 pandemic


There are no good news.

  • Global case numbers hit an all-time high on June 27th, and run above 180,000 per day in the last three days. 
  • Global deaths are trending up, rising above 6700 on June 27th - the highest reading since June 17th and 11th highest number on record. 


Saturday, June 27, 2020

26/6/20: Longer-Term Impact of COVID19 on Growth

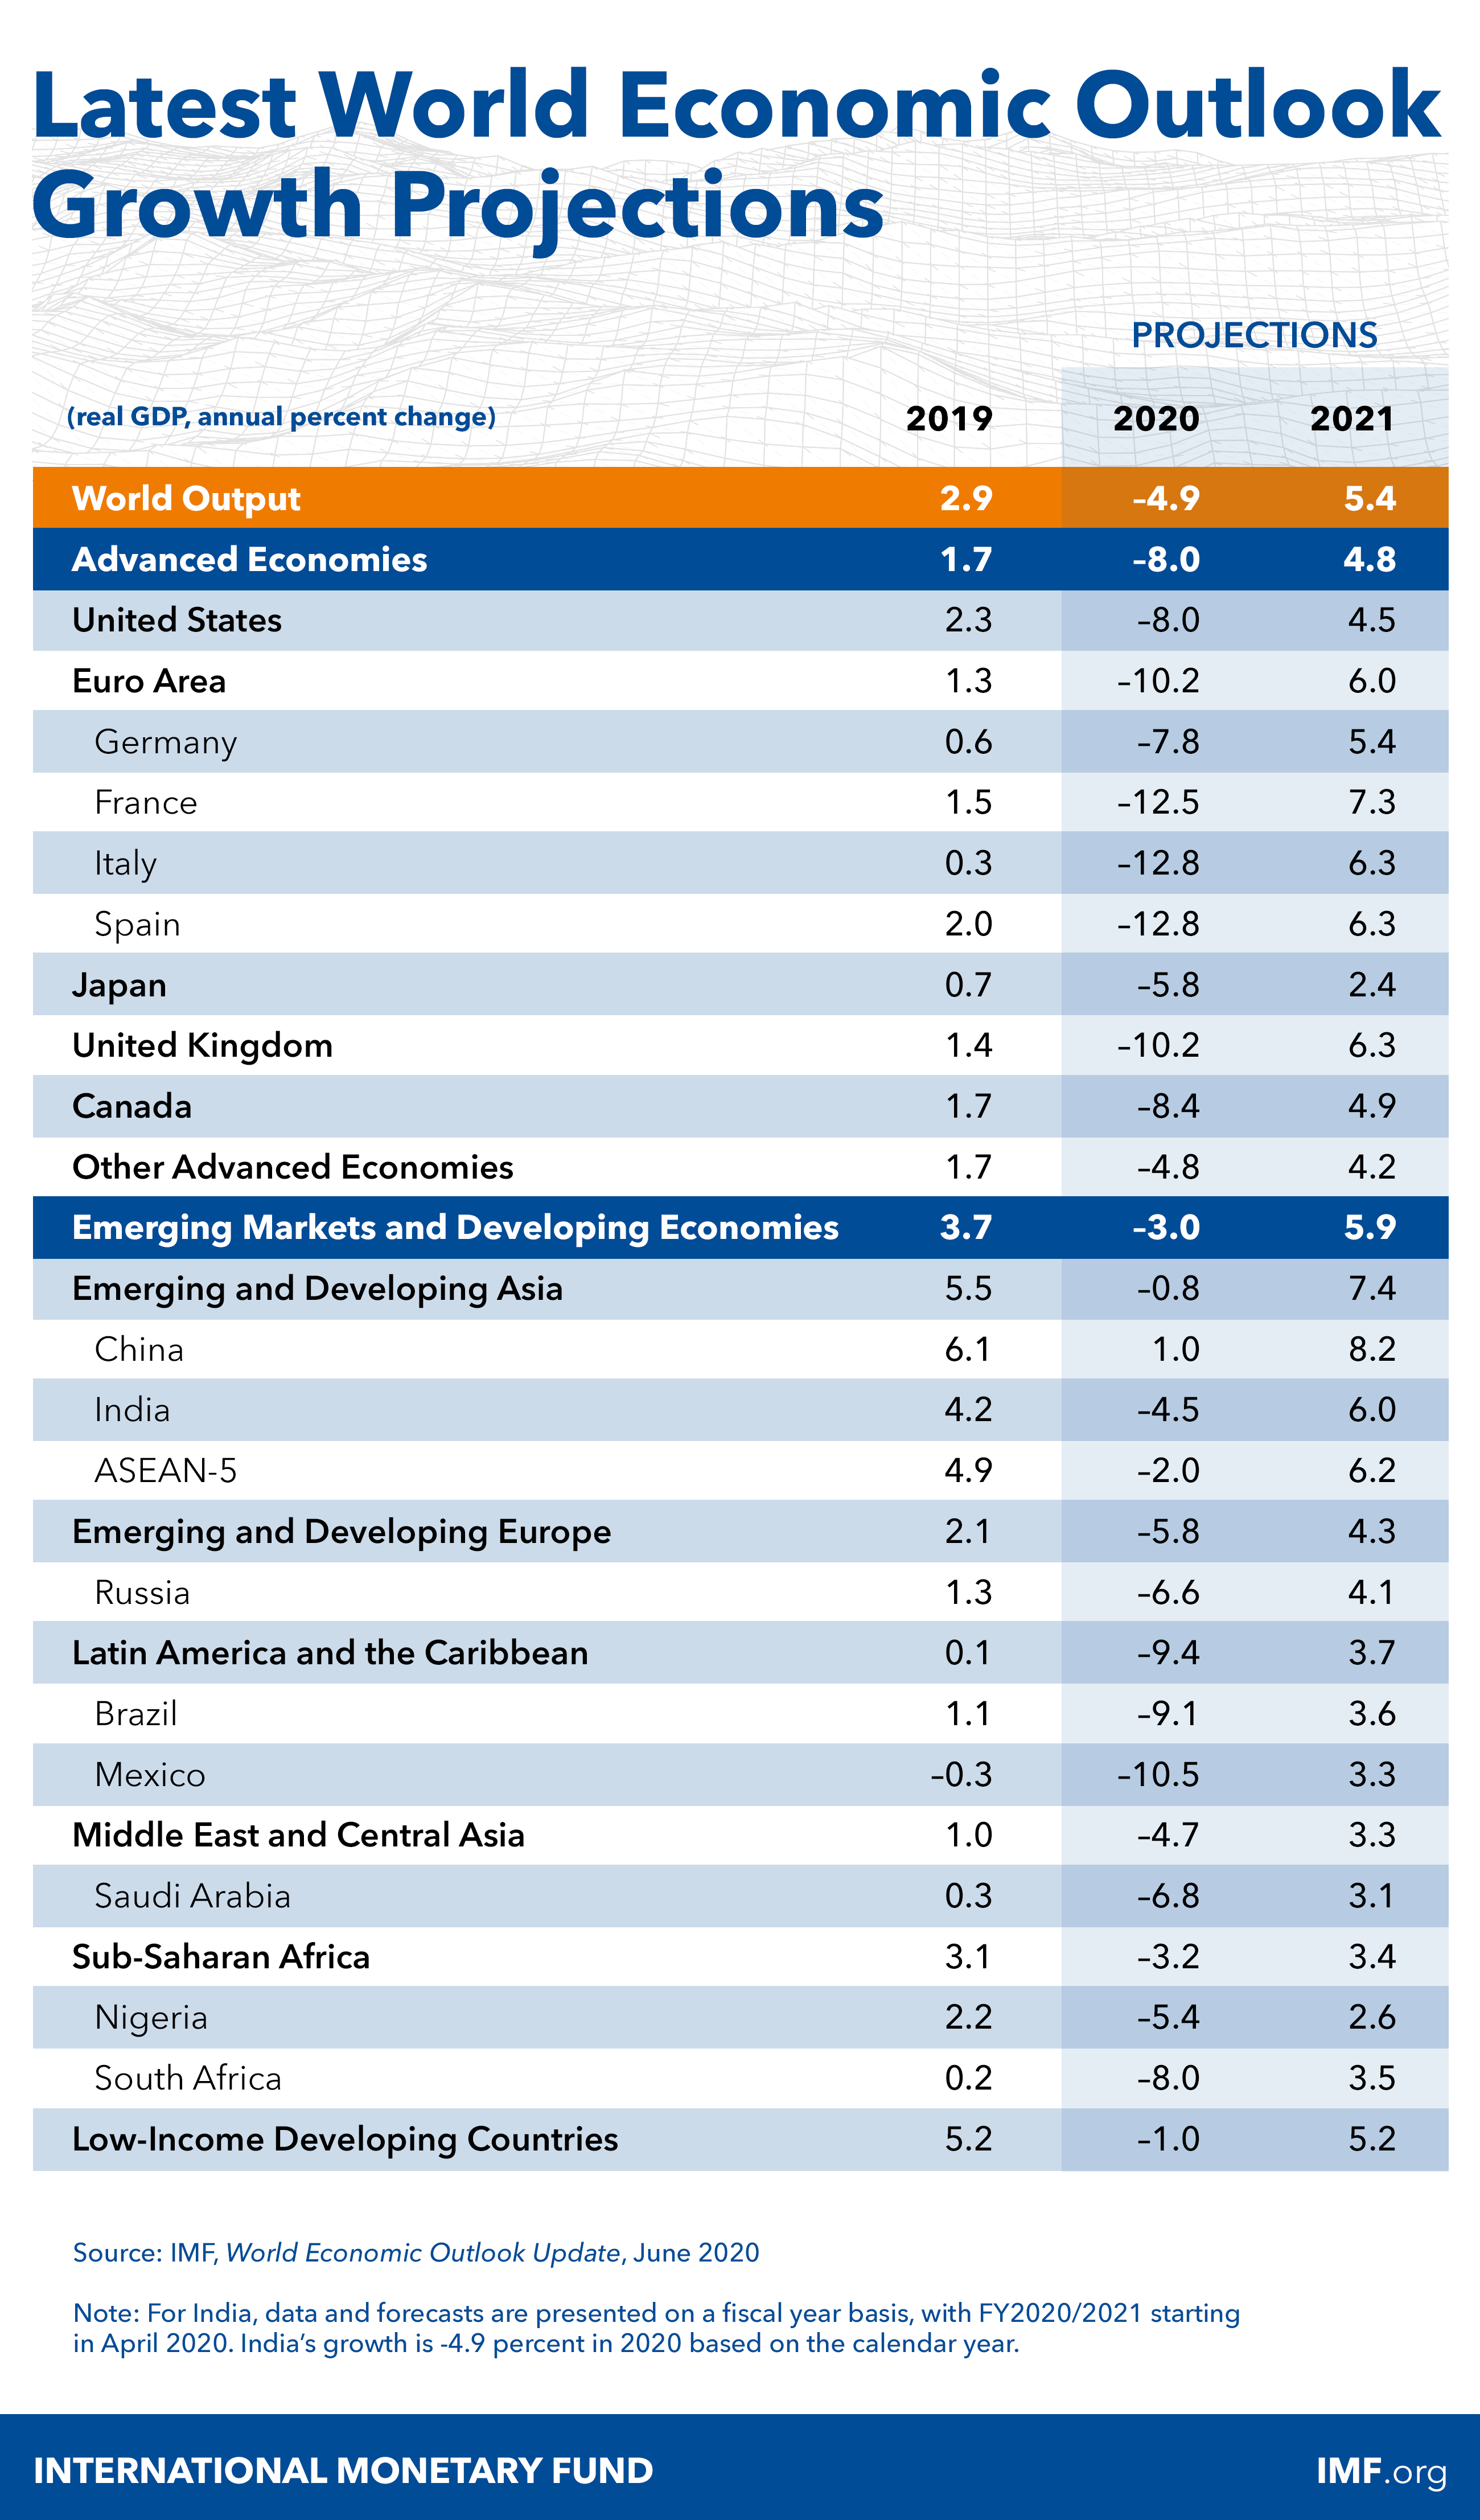
IMF published updated forecasts this week, and here the summary:

World Economic Outlook, June 2020, Growth Projections table

IMF has stopped doing 5 year forecasts this April, due to uncertainty induced by the COVID19 pandemic. 

Looking at the longer run effects of the pandemic, based on October 2019 (pre-Covid19 trends), and earlier growth trend before the Global Financial Crisis (GFC) puts COVID19 pandemic into historical perspective:


The differences between the above trend lines are telling. 

Globally, GFC resulted in a permanent loss of real income that amounts to a cumulative decline of ca 17 percent over 17 years (2008-2024). COVID19 is forecast to result in additional permanent loss of 3.2 percent within 5 years 2020-2024.

Eurozone has been hit even harder. GFC resulted in a permanent loss of real income to the tune of 12.8 percent while COVID19 is currently set to yield a permanent additional loss of income to the tune of 7.1 percent over less than 1/3rd of the post-GFC trend line duration. 

The numbers above are rather 'indicative', in so far as any and all forecasts past 2020 are perilous at the very best. But you get the picture: we are witnessing two consecutive events that result in permanent deviation of economic activity away from the prior trends. And both events are sharp. Even with a 'V-shaped' recovery, we are in trouble (because a V-shaped recovery taking us into mid-2020 means recovering end-of-2019 levels of economic activity, while losing 1.5-2 years of growth momentum (recall, economy was slowing down in H2 2019 on its own, without COVID19). 

As we say... [ok, well, may we do not say it often, but...] this picture is f*ugly... 


Friday, June 26, 2020

26/6/20: Trade Restrictions: European Companies


BOFIT newsletter out today highlights the scale of restrictive trade measures applicable to the EU exporters across a number of significant markets:


Of eleven countries included, three managed to lower trade and investment barriers applying to the EU companies over 2017-2019 period, two countries had unchanged barriers, and six showed increasing barriers to trade and investment. In a way, this reflects a shift away from trade and investment globalization focus on the last three decades toward more regionalized and even protectionist policies.

COVID19 pandemic is likely to accelerate this trend.

25/6/20: America's Scariest Charts Updated


Trump cheers today's unemployment figures... and...


Week of June 13th non-seasonally adjusted new unemployment claims were revised up to 1,463,363, from 1,433,027 published a week ago.

First estimate for the week of June 20th came in at 1,457,373.

Total initial unemployment claims filed so far during the COVID19 pandemic now sit at a massive, gargantuan 43,303,196, while estimated jobs losses (we only have official data for these through May, so using June unemployment claims to factor an estimate) are at 24,033,000. Putting this into perspective, combined losses of jobs during all recessions prior to the current one from 1945 through 2019 amount to 31,664,000.

A visual to map things out:


Charted differently:

Let's put this week's number into perspective: last week marked 14th worst week from January 1, 1967 through today. Here is tally of COVID19 initial claims ranks in history:


This is pretty epic, right? We are cheering 14th worst week in history. Note: all 14 worst weeks in history took place during this pandemic.

Of course, not all of the last week's initial unemployment claims are new claims. Initial claims can arise from people who have been kicked off prior unemployment rolls, who were denied unemployment filed earlier and so on. But the numbers above are dire. Disastrously dire. No matter how we spin the table.

25/6/20: COVID19 Update: Global Pandemic Rates


Summary of global, G7, and BRIICS case and deaths counts and rates: