Monday, January 2, 2012

2/1/2012: Sunday Times January 1 - 2012 Economy Forecast

This is an unedited version of my Sunday Times article for January 1, 2012.


Happy New Year and the best wishes to all of you fond of reading up on economics this morning.

Having just closed the book on the fourth year of the crisis, one can only hope that 2012 will be the year of the return of the global and Irish economic fortunes.

I wish I could tell you that this will be so with some sort of certainty. That ‘exports-led growth’ will open the way for reduced unemployment and that ‘real reforms’ will take place to the benefit of those of us living here and restore the confidence of the proverbial international investors. Alas, the only reality we can glimpse from the road we travelled since 2008 is that this year will be marked by the same fiscal uncertainty, growth volatility and markets psychosis that were the hallmarks of the years past.

So in line with the New Year’s Day tradition for forecasts, lets take a look at the crystal ball and ask two questions.

Question number one: Where are we today on the road of the global economic and financial crises resolution?

At the macroeconomy level, the US has completed some two-thirds of the required private sector deleveraging. This means that by the very end of 2012 we might see some signs of life in the US consumer demand and household investment, assuming the credit system globally does not experience another seizure. Until this takes place, corporate balance sheets will remain focused on hoarding cash and capex is unlikely to re-start. The US economy is likely to bounce around the growth rates just above zero, with moderate risk of a recession in the first half of 2012.

The three black swans for the global economy are: the risk of the deficit blowout and the lack of Congressional consensus on dealing with the US debt mountain that can destabilize the Treasury market; China’s economy teetering on the brink of an asset crisis and growth slowdown; and the euro area hurtling toward a disorderly collapse. Should any one of these materialising, there will be an unprecedented shift in global investment portfolia with gold and a handful of international blue chip corporates becoming the only stores of value. Unlikely as it might seem, such a scenario will cause a new Great Depression worldwide.

Barring the catastrophe identified above, global demand will most likely remain subdued in 2012, with previous pockets of growth – e.g. the emerging markets, the beneficiaries of exceptionally low cost of carry-trade finance from QE funds in the US in 2009-2010 – becoming mired in a significant growth slowdown.

Europe is likely to be on the receiving end of the poor global growth newsflows.

Germany was the driver of European growth in 2011 and its exports performance (up 13.4% in 2010 and 8.5% in 2011) looks set for a severe test in 2012. In months ahead, the ECB will drive down key interest rates to 0.5-0.25 percent from the current 1.0 percent to accommodate the default-bound euro area sovereigns. However, in the climate of deleveraging banking sector, this move will fail to stimulate private demand. Government spending in Germany is also set to fall in 2012, by 0.4-0.5 percent. As the result, we can expect German GDP to contract in Q4 2011 and Q1 2012. Annual rate of growth is likely to fall from 2.9% in 2011 to 0.2-0.4% in 2012.

France is now forecast to enter a shallow recession between Q4 2011 and Q1 2012 with annual growth falling from 1.6% in 2011 to zero percent in 2012. The downside risk for the second largest euro area economy is that fiscal adjustments planned to-date can be derailed by lower growth. In this case, France can remain in a shallow recession through 2012.

Overall, euro area growth looks set for some negative downgrades in months ahead. We can expect GDP to remain flat in 2012, having shown expansion of 1.5 percent in 2011. Personal consumption will be static, investment will shrink by 1.2 percent and Government spending will contract 0.3 percent. Exports growth will fall 10-fold, from 2011 annual rate of 6.3 percent.


This provides the backdrop to the second question of the day: What will 2012 bring to Ireland?

We are all familiar with the fact that Irish economy is highly volatile and subject to a number of push and pull factors ranging from global demand for Irish exports, to foreign conditions for debt crisis resolution in the common currency area.

Assuming no major disruptions to the current global environment, we can look at two possible scenarios.

Scenario 1 involves benign assumptions of continued growth in agricultural output, modest resilience in exports, moderating contraction in construction sector, and only slightly deeper reduction in public spending compared to 2011. Crucially, this scenario assumes virtually no nominal change in the services sector activity, a moderate rise in net taxes and a slight decrease in profits by the multinational enterprises expatriated abroad. All in, Scenario 1 yields estimated rate of growth in real GDP of 0.8% and GNP growth of 0.7%.

Less benign Scenario 2 with shallower growth in agricultural and exporting sectors activity, as well as services sectors contraction, yields growth forecast of -0.6% for real GDP and -0.9% for GNP. In this adverse scenario, Irish economy is likely to end 2012 with real GNP 13% below the peak 2007 levels.

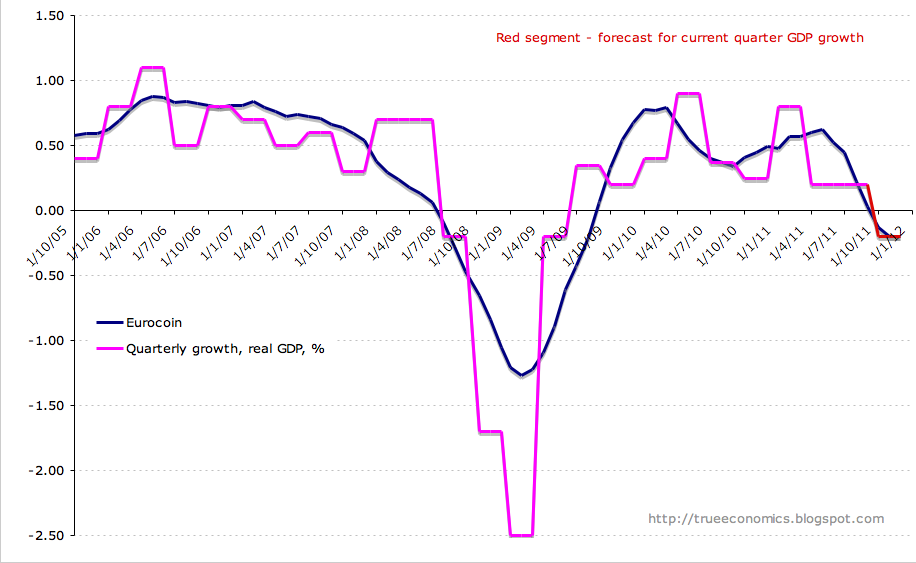
These small differences in forecasts are, however, compounded year on year, as illustrated by the historical divergences between previous Department of Finance forecasts and realised rates of growth in the chart.


The range of risks we face is a daunting one, but there is also a narrow range of potential outcomes that present an upside for the battered economy.

In terms of the sovereign risk, recent discontent with the Budget 2012 has translated into dramatically reduced approval ratings for both Fine Gael and Labor. These are likely to persist on the back of higher taxes and a potential increases in unemployment in the retail sector and other services, post-January sales. By mid-2012, lower growth and overly optimistic projections on tax revenues and expenditure reductions will mean that the Coalition will face a stark choice of either further reducing capital expenditure, or levying some sort of a new revenue raising measure. Discontent of the backbenchers will only increase as time moves closer to the Budget 2013, possibly forcing the Government to adopt some structural reforms on the expenditure side and rethink its policy on future tax increases.

The latest projections by the Economist Intelligence Unit put peak Government debt/GDP ratio at 120-125% in 2013. At this stage, there will be a belated restructuring deal struck with EU that will see debt/GDP ratio falling to below 100%. The pressure for such a deal will be building up throughout 2012 and we might see some positive moves during the year.

Banks will be nursing continued losses, with mortgages showing a more visible trend toward deterioration, while business insolvencies will continue driving significant losses behind the façade. Again, pressure of these losses will become more apparent in late 2012, just around the time banks capital buffers begin to dwindle once again.

With economy bouncing up and down along the generally stagnant growth trend, the Government will continue its search for excuses for avoiding deep reforms. Thus, 2012 will be the year of silent risks build up in Irish economy, culminating in a major blow-out in late 2012 or early 2013. Welcome to the Groundhog Year Number Five.


Box-out:

Most recent data for Ireland’s external accounts shows that in Q3 2011 our balance of payments stood at a surplus of €838 million, comprising a current account surplus of €850 million and a capital account deficit of €12 million. For the nine months of 2011, the current account has registered a deficit of €669 million, an improvement of just €125 million on the deficit in the same period of 2010. Over the same time, balance of payments deficit fell from €771 million in the nine months through September 2010 to €675 million for the first nine months of 2011. Which raises the following question: given that we continue running current account and balance of payments deficits, what external surpluses does the Government foresee for the near future that can possibly make a dent in our public debt overhang? Since the onset of the current exports boom in the beginning of 2010, Ireland’s average quarterly current account surplus has been a meagre €13 million. At this rate, it will take Ireland Inc some 190 years to pay down just €10 billion of debts, even if these debts were costing us nothing to finance.

2/1/2012: Latest Composite Leading Indicators for Q4 2011

Latest leading economic indicators for Q4 2011 for OECD are not showing any real signs of economic recovery for the euro area. Here are some of the details (please note, data is through October, so forward signal is for November-December 2011).

For Australia, Q4 2011 indicator is now down at 100.55 against Q3 2011 reading of 100.80. 3mo MA is 100.71 against previous 3mo MA of 100.89. For comparative purposes, 2007 average reading was 101.96, 2009 average of 96.07 and 2010 average 101.13. 2011 average to-date is 100.99.

Canada's CLI is at 99.66, ahead of Q3 2011 reading of 99.42. 3mo MA is at 99.62 and previous 3mo MA was 100.72. 2011 average to-date is 100.90, well behind 102.13 average for 2010 and 101.26 average in 2007.

France current reading is at 98.13 slightly behind Q3 2011 at 98.60. 3mo MA is at 98.69, behind previous 3mo MA of 100.96. 2011-to-date average is at 101.16, behind 2010 average of 103.38 and 2007 average of 101.37.

Germany's current reading is at 98.28, down from 99.10 in Q3 2011 with current 3mo MA at 99.26, down from the previous 3mo MA of 102.93 - one of the highest rates of slowdown at 3.57%. 2011-to-date average is at 102.77, down from 2010 average of 104.08 and 2007 average of 103.96.

Ireland (for our local interest) is at 96.99 against Q3 2011 of 96.19 - one of the handful of countries (such as Greece) that shows some improvement. 3mo MA is at 100.40 against previous 3mo MA of 101.00. 2011-to-date reading is at 100.94 against 2010 average of 99.74 and 2007 average of 105.28.

Italy is currently reading at 96.55, down from 97.47 in Q3 2011. Current 3mo MA is at 97.50 down from 100.46 for previous 3mo MA - a decline of 2.95%. 2011-to-date average is 100.58 against 2010 average of 103.93 and 2007 average of 101.69.

Japan current reading is at 101.33 against previous reading of 101.55. 3mo MA at 101.62 down from 102.69 for previous 3mo MA. 2011-to-date average is 102.65 against 2010 average of 100.78 and 2007 average of 102.29.

Spain latest reading is 100.16 against previous reading of 100.65. 3mo MA is at 100.52 against previous 3mo MA of 101.18 and 2011-to-date average is at 101.38 against 2010 average of 102.86 and 2007 average of 102.52.

UK current reading is at 98.64 against previous reading of 99.01, with current 3mo MA of 99.14 against previous 3mo MA of 101.13 (-1.96%). 2011-to-date average is at 101.02 against 2010 average of 103.14 and 2007 average of 102.13.

US current reading is at 100.95 down from the previous reading of 101.25. 3mo MA is at 101.24, down from previous 3mo MA of 102.37 (-1.11%). 2011-to-date average is at 102.20 and 2010 average was 100.39, while 2007 average was 103.20.

In terms of EA17, current reading for the euro area stands at 98.53, down from previous reading of 99.13. 3mo MA currently stands at 99.20 against previous 3mo MA of 101.67 (down 2.43%). 2011-to-date average is at 101.75 against 2010 average of 103.34 and 2007 average of 102.81.

Big Euro Area 4 economies index is now at 98.12, down from the previous reading of 98.77. 3mo MA is at 98.88, down from 101.66 for the previous 3mo MA (-2.74%) and 2011-to-date average is at 101.66, down from 103.77 average for 2010 and 102.44 average for 2007.

Charts to illustrate:


Sunday, January 1, 2012

1/1/2012: That debt overhang problem: replay

I am delighted to note that John Mauldin is also stressing the issue of total real economic debt overhang that I have been vocal about for some time now. Here's his 2012 predictions post: http://www.businessinsider.com/mauldin-collateral-damage-2011-12
that also contains this delightful chart:


And, spot the one country that stands out? Yep, that's Ireland - second to Japan in terms of total combined debt/GDP ratio, and well ahead of Japan when GNP is referenced in the above.

I have highlighted the issue of debt overhang and the long term real growth drag exerted by it in a number of articles now, including articles in the Sunday Times, the Globe and Mail, Ireland's Village magazine and on this blog. At last, analysts are starting to pay attention to the issue.

1/1/2012: Groundhog Year 2012 - part 2

And on with another summary of 2011. One side of the euro area economy had a boom year in 2011, unlike the rest of us. The boom, of course, was of a very dubious nature, but it is set to continue through 2012. That side was the ECB balance sheet.

Check out the following charts to spot the 'up year' for ECB's 'assets':


But what about ECB's capacity to carry these? Well, of course, ECB doesn't really function like a regular bank, but were it, with capital and reserves finishing 2012 at €81.481bn against total assets of €2,733.2 billion, ECB's leverage currently stands at 3,354%, which is well above 2000-2004 average of 1,372% and 2005-2008 average of 2,180% and 2009 level of 2,609% and 2010 level of leverage of 2,565%.

And, of course, more financial wizardry to come in 2012, folks. So brace yourselves for another 'up-and-up they go' year at ECB.

1/1/2012: Groundhog Year 2012 - part 1

In the tradition of looking back at the year passed, let's take a quick view of one of my favorite indicators for risk assets fundamentals: the VIX index.

CBOE Volatility Index finished the year well off the inter-year highs, but nonetheless in an unpleasant territory. VIX closed December 2011 at an elevated 23.40, ahead of December 2010 close of 17.75, 2009 close of 21.68 and only behind the December 2008 levels of 40.00. December 2007 close was 22.50 and December 2006 was 11.56.

More unpleasant arithmetic emerges when we consider inter-annual performance. Historical maximum for daily close (from January 1990 through present) is 80.86, while maximum for 2010-present was 48.00 set on August 8, 2011.

The historical average for VIX is 20.57, while the average for January 2008-present is 27.74, for January 2010-present is 23.38 and for 2011 as a whole - 24.20, implying that wile 2011 was not the worst performing year on the record, it was certainly worse than 2010. Table below summarizes annual data comparatives.

Average intra-day volatility actually marks 2011 as the worst year on record. Average intra-day spread for VIX stands at 9.28 in 2011 against 8.97 in 2010-present and 9.08 in 2008-present. And both 3mo and 1mo dynamic standard deviations posted poor performance for VIX in 2011, making it the worst year on the record other than 2009. VIX dynamic 1mo semi-variance closed the year on 7.80 and annual average of 4.26 against 2010 average of 3.96 and 2009 average of 5.78.

Charts below highlight the fact that 2011 was a poor year for fundamentals-based analytics:


All above suggest that volatility is the starting point for 2012. Welcome back to the New 'Groundhog Day' Year.

Friday, December 30, 2011

30/12/2011: Eurocoin December 2011: recession + inflation

Eurocoin - euro area's leading indicator of growth environment - posted another disappointing month in December. December reading came in at -0.20, same as November with 'stabilization' accounted for by improvement in surveys-based indicators for industrial and services firms, offset by material deterioration in actual demand indicators. Core Q4 2011 forecast for euro area growth now moved to -0.2, dangerously close to establishing a full-blown statistical contraction in the economy. More significantly, current growth and inflation conditions pairing pushed ECB policymaking into a proverbial straight jacket corner: rates consistent with inflation remain in the region of 3-times higher than current rate, while rates consistent with growth conditions are about right for the current 1.0% rate.

Charts below illustrate.


3mo MA for Eurocoin is now at -0.18, against 6mo MA of +0.03. YOY Eurocoin is down 141% and the indicator remains at the lowest level since August 2009. Annualized growth rate is forecast is running at -0.798% and 6mo MA annualized growth rate is running at +0.117% (also the worst performance since August 2009).


30/12/2011: Taleb's quote

AN excellent quote from Nassim Taleb via @econbrothers :

"If we attempt to systematically extinguish all forest fires, we will eventually experience a big one".

Which, of course, goes to describe concisely and precisely the fallacy of rescuing all banks that Europe has pursued as a principled policy. The old Schumpeterian creative destruction is a required condition for functioning of the private economy, with the latter being the required condition for functioning of the public economy as well. Bankruptcy - as a tool for clearing the hazardously dead forest of private enterprises - must apply to the banks too.

By underwriting the entire private banking system, the EU has created the Mother of All Hazards - a dry forest with numerous pockets of quasi-extinguished fires burning. Now, all we need is wind...

Wednesday, December 28, 2011

28/12/2011: ECB: New evidence on public-private pay gap: part 2

As an addendum to the previous post on public-private pay gap study, here are the core results for differences in the pay gap based on various income percentiles:


In the table above, levels of income are referenced to percentiles, so wage differentials are estimated for public-private sector gap per each income percentile. In general, for most countries other than Spain, Ireland and Portugal, "the public sector gap is higher at the lower quantiles and declines along the wage distribution. This is further evidence that the dispersion of the wages in the public sector is much smaller than in the private sector. In this context, public sector employees with low wages earn a higher wage premium relative to higher income employees [again, ex- Spain, Ireland and Portugal]."

In the case of Ireland, the premium lowest for top-earners, second lowest for bottom-earners. The premium rises slightly for 25th percentile and 75th percentile and peaks at 50th percentile. So Irish public sector premium is highest for mid-range earners, lowest for top-range earners, and second lowest for low earners.


28/12/2011: Brain-drain & IRL's knowledge economy

When Government policy-supported brain-drain is compounded by heavily subsidised 3rd level education system, Ireland risks turning into a third world-styled resources supplier to our more dynamic trading partners:

http://www.irishtimes.com/newspaper/ireland/2011/1228/1224309553505.html

HT to @dalkeyhead

That's the 'Knowledge Economy' in the absence of real jobs creation: taxpayers pay for knowledge, private holders of knowledge emigrate to earn private returns, taxpayers pay for more 'Knowledge Economy' boffins and pamphlets... but do not worry - 20 years from now, the IDA will have plenty of new ex-Irish execs in UK, US, Australia, Canada, etc to beg for FDI.

28/12/2011: ECB: New evidence on public-private pay gap: part 1


ECB Working Paper 1406 (December 2011) titled "The Public Sector Pay Gap in a Selection of Euro Area Countries" looks at the relationship between public and private sector wages over recent decades in the light of "the increase in public sector employment in many countries, with relevant implications for the overall macroeconomic performance and for public finances". The study considered ten euro area countries: Austria, Belgium, France, Germany, Greece, Ireland, Italy, Portugal, Slovenia and Spain.

Per authors: "According to national account aggregate data, the wage earned by a representative public sector employee is higher than the one earned by a representative private sector employee in all the countries of this study, except Belgium, France and Germany. In particular, in the period 1995-2009 the ratio of public to private compensation per employee is found to be consistently below one in the case of France, slightly below one in the cases of Germany and Belgium, around 1.1 for Austria, around 1.2-1.3 for Italy, Spain, Greece, Ireland and Slovenia, and above 1.5 for Portugal."

"Available data on union membership – referring to the period 1997-2009 depending on the country - show that union density (measured by the ratio between reported membership and employed dependent labour force) is typically much higher in the public than in the private sector (in the European countries approximately twice as much). Among the countries included in this study, union density rates are relatively high in Belgium (around 50%), followed by Austria, Ireland, Italy and Portugal (in the 30- 40% range) and Germany (27%); it is relatively low in France (about 8%) and Spain (16%)."


The summary of the premium evolution is provided here:
In the chart above, Ireland has the second highest gap after Portugal.

The paper provides a reminder of a number of studies that have examined the public-private sector wage gap in Ireland:
  • Boyle at. al. (2004) report wage premia for public sector workers, greater for low-paid workers and smaller for public sector workers at the top of the earnings distribution using microdata from the European Community Household Panel Survey. 
  • Foley and O’Callaghan (2009), using micro data from the 2007 National Employment Survey, also find a sizable public sector wage premium, highest at the lower ends of the earnings distribution. The authors use a variety of estimation techniques and control for work place and employee characteristics such as age, education, gender, occupation, etc. However, the authors urge caution in reaching a definitive conclusions on the average public sector premium. 
  • Kelly et. al. (2009), using data from the 2003 and 2006 National Employment Surveys, analise the public- private sector wage gap in Ireland. Their results indicate that the public sector pay premium increased considerably from 14 to 26 per cent between 2003 and 2006. Moreover, they also reported that there was significant variation across public service sub-sectors.


The ECB research provides controls for a number of variables that can theoretically explain diferences in pay between public and private sector, such as education as skills proxy and gender,  earnings groupings by percentiles,  and firm size. All are found to retain statistically signifcant public sector earnings premium in the case of Ireland. 

The study also looks at one specific category - Education. "On average workers in “Education” earn much higher wages with respect to workers with similar characteristics in the private sector relative to workers in the other sub-sectors, while workers in the “Health” sector are less at advantage, and as in the case of Germany even at disadvantage with respect to their private sector counterparts. This finding is confirmed on the basis of a formal statistical test..."


And the premium holds when controlling for workers' own education:

So overall, the study finds that: "A large body of literature has analysed the issue using micro-data on single countries. Most of these studies find a differential in favour of public sector workers, even after taking into account some observable individual characteristics. As in the previous studies, our results, referring to the period 2004-2007, point to a conditional pay differential in favour of the public sector that is generally higher for women, for workers at the bottom of the wage distribution, in the Education and the Public administration sectors rather than in the Health sector. We also find notable differences across countries, with Greece, Ireland, Italy, Portugal and Spain exhibiting higher public sector premia than other countries. The differential generally decreases when considering monthly wages as opposed to hourly wages and if we restrict our comparison to large private firms."

There goes one of those "We are not Greece" comparatives that the Irish Government is so keen on. When it comes to pay premium in the public sector, we are in the Club Med (PIIGS) group after all.


Monday, December 26, 2011

26/12/2011: LTRO will not solve Euro banks' problem


As the annus horribilis concludes for the terminally ill, but refused (by the ECB & EU & the respective Governments) death, Euro area banks, the key note of that Mahlerian (the 5th symphony-styled) Trauermarsch is the LTRO allocation of cheap 3 year €489 billion worth of ECB credit (at 1%) to the European banks. And, thus, the theme for 2012, the second movement in the opus magnum of the Euro destruction, is the looming recapitalization deadline for the said zombies – the end of June.
Alas, the hope that seems to sweep the markets to boost, albeit moderately, Euro area banks valuations – the hope that having the mother of all carry trades can help these banks recover their margins just in time to use ‘organic’ recapitalization path through mid 2012 – is seemingly out of reach.
Firstly, I put ‘organic’ in the inverted commas, since the margins rebuilding on the back of ECB-created artificial liquidity boost is about as organic as performing a puppet show with a corpse is ‘live-like’.
Secondly, the carry trade I am talking about - for those readers of this blog who are unfamiliar with finance – is the artificial exercise of taking cheap loans in one country/currency and carrying funds into purchase of assets in another country/currency. Of course, with nothing but loss making (or near-loss making) assets in the markets of the Euro zone, any banks who borrowed funds in the LTRO will be either buying Government paper (yielding on average, say, 3.0 percent margin on borrowings gives Euro area banks pre-tax uplift of just €7.3 billion in 6 months time (and no, there are no capital gains realizable, since buying today and selling into mid-2012 will leave this paper, at best, capital gains neutral). Thus, to make even a dent in the capital demand, the banks will be needing assets yielding more than double the junkier Euro area sovereign yields, which means carry trade, and all associated currency and asset risks.
Of course, Euro area banks can try to magnify their returns via ECB-offered leveraged carry trades. But unless ECB offers more LTRO-styled longer term operations, doing so at 3mo or even 11mo liquidity supply windows would be simply mad. 
So, having borrowed through LTRO, Euro area banks will purchase Government bonds which then can be used as a collateral for further ECB borrowing. So let us assume that the banks will be buying liquid debt, e.g. Spanish or Italian. The margin earned by banks is ca 2.6-3.5% per annum after they cover the cost of LTRO borrowing. Note, this carry trade will turn loss-making for the bank if the sovereign bonds yields fall below 1% cost of ECB LTRO funds. In my view, this is highly unlikely.
So the whole operation can provide some €14.6 billion annually to the banks in terms of profits earned. And this is pretty much the unleveraged maximum. Nice one, but through June 2012 hardly enough to support banks recaps. Even if EBA deadline is shifted to December 2012, profits from LTRO are nowhere near the required funds to cover recapitalizations. Recall that under 9% Core Tier 1 scenario, euro area banks require something to the tune of €119 billion in fresh capital.
The downside from this conclusion is that the Euro area banks will require, post LTRO either a warrant to die (the preferred option, assuming the death warrant involves orderly shutdown of the insolvent banks) or a public bailout of immense proportion. Given the EU hit some serious trouble coming up with €200 billion for loans to IMF, good luck with that latter option.

Friday, December 23, 2011

23/12/2011: EU - 2013 = Year of Citizens, Rest of Time = Years of Brussels?

So 2013 theme for EU is "The European Year of Citizens". I know, it was proposed some months ago, but...


The challenges for the "Year of Citizens" will be to:
  • Raise citizens' awareness of their right to reside freely within the European Union and of how they can benefit from EU rights and policies [Though, of course, if they happen to be Russian-speaking near-majority in some Baltic States, they are not quite 'citizens' and if they happen to be from certain EEC member states, they can reside, but have no right to work in other member states, plus if they live in Ireland, they have a duty to repay banks bondholders in other member states, and if they live in Greece, they have no right to have a referendum on their own economic policies, and... oh, well... the list goes on];
  • Stimulate citizens' active participation in EU policy-making [because, as we know it, European 'citizens' are starting to get tired of the farcical nature of governance in the EU, especially when it comes to that pesky democratic deficit (chart below is from Spiegel Online):

  • Build debate about the impact and potential of the right to free movement, especially on strengthening cohesion and people's mutual understanding of one another [no comment here, since we are currently living through the period when many member states are starting to put in place measures to reduce that 'free movement']
But overall, did anyone ask the EU Commission and the European Parliament the following question: If 2013 is the year of European citizens, then, pardon me for using foreign turn of phrase here, what the hell were all the previous and will the subsequent years be about? Years of Brussels?