Tuesday, January 5, 2016

5/1/16: Debt Pile: Advanced Economies Lead


After some 8 years of crisis and post-crisis deleveraging, one would have expected a significant progress to be achieved in terms of reducing the overall debt piles carried by the world’s most indebted economies.

Alas, the case cannot be made for such improvements. Here is a chart based on the latest BIS data (through 1Q 2015) plotting the distribution of total real economic debt (Government, private non-financial corporates and households) across the main economies:


As the chart above indicates, there are at least 23 economies with debt/GDP ratio in excess of 200 percent, seven economies with debt to GDP ratio close to or above 300 percent and 3 economies with debt to GDP ratio in excess of 300 percent. But the true champs of the debt world are Japan and Ireland, where based on BIS data, debt to GDP ratio is in excess of 375 percent. 

It is worth noting that Germany is the only advanced economy in the chart that has debt/GDP ratio below 200 percent. Of all original Euro area 12 economies, Germany, Austria and Finland are the only three economies with debt/GDP ratio below 250 percent. Six out of top 10 most indebted economies in the chart are Euro area members.


Do note that the above omits local authorities and state bodies debts, so the true extent of debt pile up around the world is significantly larger than that presented in this figure.

5/1/16: What Aggregate R&D Spends Tell Us? Actually... little


In a recent comment on R&D Expenditure across the OECD countries, WEF has referenced Irish data on R&D spending as % of GDP at 1.58% which refers to 2012 full year results.


Which is surprising, given that we now have 2014 data available per Eurostat (http://ec.europa.eu/eurostat/documents/2995521/7092226/9-30112015-AP-EN.pdf/29eeaa3d-29c8-496d-9302-77056be6d586) which puts our R&D spending at 1.55% of GDP in 2014.


Irish GDP in 2014 in current prices terms was 16.07% above Irish GNP. The same gap in 2004 was 17.26%. Which means that adjusting for this gap, Irish R&D expenditure as a share of GNP was 1.38% of GNP in 2004, rising to 1.80% in 2014.

Thus, in 2004, Ireland ranked as 12th country in the EU in terms of R&D expenditure ‘intensity’ by GDP metric, and 11th by GNP metric, both metrics were at exactly the same ranking places in 2014.

Here is a chart showing longer evolution of the R&D expenditure series from OECD:


Overall, Irish R&D expenditures remain below the desired levels in absolute terms, both relative to the GDP and the GNP bases.

Eurostar provides a handy breakdown of R&D spending by origin across Private sector, Government sector, Higher education and non-Profit.


Few things stand out for Ireland:

  • As a share of R&D spending, business enterprise sector appears to be carrying its weight in Ireland. 
  • Government expenditure on R&D is extremely weak in Ireland, though one has to wonder what on earth can Irish Government research, given the quality of our state institutions.
  • Higher education sector R&D spending in Ireland is ranked 20th in the EU - a ranking that is heavily influenced by a massive share of business enterprise spending of total R&D expenditure. 
  • Apparently, there is no private non-profit spending whatsoever in Ireland.

Key to the above is, however, the nature of business enterprise spending. Per Government own statistics, in 2012, roughly 300 firms accounted for almost 70% of total R&D expenditure in Ireland. Just 107foreign firms spent more than EUR2 million on R&D per annum in Ireland and these account for 88% of the total R&D spent by MNCs in Ireland, or well over 70% of the total business enterprise R&D spend.

Here’s Finfacts take on the hype: http://www.finfacts.ie/irishfinancenews/article_1028789.shtml.

In other words, stripping out MNCs with their R&D activity booked through Ireland mostly reflective of tax optimisation rather than actual research, one wonders just how much exactly does R&D contribute to our GDP or GNP and just how much of the failures of Irish R&D spending are down to quantum of spend as opposed to quality of spend? Problem is: we do not know. All Government research on the matter, including research by the likes of the OECD (based on Irish Government-supplied data), is probably heavily biased by the insiders dominating analysis.

Take the following two charts from OECD latest report on Science and R&D (http://www.oecd-ilibrary.org/science-and-technology/main-science-and-technology-indicators_2304277x)


So in the first chart, Ireland is above EU and OECD averages in terms of researchers employment intensity, but in second chart, Ireland is below EU and OECD averages in terms of R&D output intensity (by one metric).

Which begs a question - is this difference down to quality of researchers or down to type of research (e,g. non-patentable fields of sciences and humanities) or down to classification by, say MNCs, of some business & admin personnel as research personnel for tax purposes and to create a smokescreen of ‘organic’ as opposed to tax channeling activity in Ireland?

Who knows… But in 2011, per OECD data, 71.1% of total R&D expenditure by enterprises in Ireland accrued to foreign affiliates (the MNCs).  Subsequently, we stopped reporting such data. It is worth noting that this does not include companies that redomiciled into Ireland via tax inversions, adding which to the pile would probably shift this number closer to 90 percent.

In simple terms, aggregate spending figures tell us very little as to the nature of Irish R&D activities or their effectiveness. The real data is being hidden from our view by commercial secrecy that conveniently obscures just what exactly is happening in the economy and in our research sectors. May be, the knowledge economy of Ireland is a de facto a convenient deus ex machina for the severe skews in the economy arising from the MNCs presence here. Or may be, it is all just fine and a crop of Nobel Prizes and research accolades for the country are only a matter of few more quid pushed into R&D line of private and public expenditure.

Monday, January 4, 2016

4/1/16: Eurocoin signals flat 4Q 2015 growth in the Euro area


Euro area leading growth indicator Eurocoin, released by Banca d'Italia and CEPR, posted a reading of 0.45 in December, marking a rise from 0.37 in November and signalling some improvement in growth conditions. However, on 3mo average basis, 4Q 2015 reading came in at 0.393 against 3Q 2015 reading of 0.402. Given 3Q reading coincided with preliminary real GDP expansion of 0.3 percent, this suggests that actual growth did not tick up significantly from 3Q.


Overall, from both growth and inflation points of view, the ECB policies remain ineffective:


Overall, per Eurocoin release, the upside to the indicator in December was provided by  household consumption, labour market performance and the upturn in industrial production. In other words, we have domestic demand-driven growth, which is a net positive compared to the first half of 2015 when growth still relied predominantly on financial markets valuations and exports.

4/1/16: Global manufacturing weighted down by BRICs in December


According to Markit, “The global manufacturing sector ended 2015 on a disappointing note, with the rates of expansion in production and new orders both slowing in December. At 50.9, down from 51.2 in November, the J.P.Morgan Global Manufacturing PMI …fell to a three-month low. The average PMI reading over 2015 as a whole was below those registered in both of the prior two years.”

The new sub-sector data “covering consumer, intermediate and investment goods producers…signalled that the slowdown highlighted by the headline Global Manufacturing PMI during
December mainly reflected weaker expansion at investment goods producers and a further contraction in the intermediate goods sector. In contrast, growth accelerated slightly at consumer goods producers.”

Much of the deterioration is, apparently down to emerging markets weaknesses. “The end of 2015 saw the downturn in emerging market manufacturing continue, with PMI indices for China,
India, Brazil, Russia, Indonesia and Malaysia all in sub-50.0 contraction territory. Although the expansion in developed nations continued, growth slowed (on average) to an eight-month low.”

Note: I covered Manufacturing PMIs for BRIC economies in an earlier post here: http://trueeconomics.blogspot.ie/2016/01/4116-bric-manufacturing-pmis-december.html

You can see the ‘weighting’ effect in the chart here based on quarterly data:


And a summary table for Global Manufacturing PMI from Markit here:


Per Markit:

  • Growth rates fell to a 38-month low in the US
  • Growth eased to three-month low in the UK, 
  • Growth held steady in Japan, and 
  • Growth “accelerated to a 20-month high in the euro area.” 

Net outrun: global manufacturing has ended 2015 an inch closer to zero growth / stagnation point and certainly nowhere near the levels of growth consistent with amplification in global economic growth rates forward.

4/1/16: BRIC Manufacturing PMIs: December 2015 and 4Q 2015


BRIC Manufacturing PMIs posted another sector-wide weakening in growth conditions in December, ending 2015 on foot of an outright contraction across the sector in all BRIC economies for the first time since late 2013.

Russian manufacturing PMI posted a deterioration in sector performance in December, falling to 48.7 from 50.1 in November. This reverses two consecutive months of above 50 readings in October and November. On a quarterly basis, 4Q 2015 average reading was 49.7, which is better than 48.4 average for 3Q 2015, but still below 50.0 line. Overall December reading was the weakest since August 2015 and signals that the much anticipated stabilisation of the Russian economy did not take place in December. More detailed analysis of Russian PMIs is available here for monthly data and here for quarterly data. Overall, Russia was the third weakest PMI performer in Manufacturing sector terms within the BRIC group.

Brazil’s Manufacturing PMI remained deeply below 50.0 mark in December, although rising to 45.6 from 43.8 in November. December reading stands as the highest in 3 months, but still signals sharp rate of activity contraction. 4Q 2015 average is at 44.5, which is down on 46.7 average for 3Q 2015. Brazil has now posted Manufacturing PMI readings below 50.0 for 11 months in a row, the longest such record in the group of BRIC countries. In addition, Brazil remained the weakest performer in terms of Manufacturing PMIs in the BRIC group.

Per Markit: “Brazilian manufacturing companies reported worsening operating conditions at the end of 2015. December saw output and new orders dip at rates that, although slower, remained sharp…Amid evidence of cashflow problems, stocks of purchases and post-production inventories both decreased at rates that were the quickest in over six years. …severe downturn in the sector that was evident among the three monitored market groups: consumer, intermediate and investment goods. …December data pointed to a further decline in incoming new work, the eleventh in as many months. …Panellists indicated that a deeper economic retreat and falling purchasing power among consumers had led domestic demand to dwindle. Conversely, new orders from abroad rose. The weaker real had reportedly supported firms in securing new business from external clients. That said, the overall pace of expansion was only marginal.”

China Manufacturing PMI fell from 48.6 in November to 48.2 in October, marking 10th consecutive month of sub-50 readings and the weakest reading in 3 months. On a quarterly basis, 4Q 2015 reading was 48.4 which is somewhat better than 47.4 reading for 3Q 2015, although still signifying overall contraction in the sector. By all metrics, Chinese Manufacturing PMI came in second weakest in the BRIC grouping after Brazil.

Per Markit: “Operating conditions faced by Chinese goods producers continued to deteriorate in December. Production declined for the seventh time in the past eight months, driven in part by a further fall in total new work. Data suggested that client demand was weak both at home and abroad, with new export business falling for the first time in three months in December. As a result, manufacturers continued to trim their staff numbers and reduce their purchasing activity in line with lower production requirements. Meanwhile, deflationary pressures persisted, as highlighted by further marked declines in both input costs and selling prices.” Overall, this was the first time exports orders fell since September 2015.

India Manufacturing PMI posted a moderate drop from 50.3 in November to 49.1 in December, putting PMI reading below 50.0 line for the first time since June 2015. However, on a quarterly average basis, 4Q 2015 came in at 50.0, signalling zero growth in the sector over the last quarter of 2015, down from relatively robust growth posted in 3Q 2015 (with PMI averaging 52.1). PMI averaged 51.7 in 2Q 2015. The data confirms my previously expressed view that India is now skirting dangerously close to a manufacturing recession and that overall economic growth conditions in the economy have deteriorated significantly compared to 2014.

Per Markit: “Indian manufacturers saw business conditions deteriorate at the end of 2015. December’s incessant rainfall in Chennai impacted heavily on the sector, with falling new work leading companies to scale back output at the sharpest pace since February 2009. On the price front, inflation rates of both input costs and output charges were at seven month highs. …Consumer goods bucked the sub-sector trend and was the only category to see improving business conditions in December as production and new orders rose. Conversely, incoming new work and output fell in both the intermediate and investment goods market groups. Having risen for 25 straight months, total
manufacturing production in India fell during December. Furthermore, the rate of contraction was the sharpest in almost seven years.”

Summary table:

And a chart to illustrate


Hence, overall, as of December, 

  • Brazil manufacturing PMI continued to move along the general downward trend that started around 1Q 2013 and runs unabated since then, with Manufacturing recession setting in firmly from 2Q 2015 on. 
  • China, having displaced Russia for the second weakest position in the BRIC economies in terms of Manufacturing PMIs back in July 2015 remains the second weakest link in the BRIC group. Chinese manufacturing has been posting negative trend in PMIs since mid 2014, although in the last 3 months of 2015 this trend somewhat improved. 
  • Meanwhile, Russian Manufacturing is once again taking on water, having reverted down from a positive sub-trend that was present over May-November 2015.
  • Last, but not least, the bright star of India is now fading in terms of Manufacturing PMIs, with both trend (downward since December 2014 and more pronounced downward trend since July 2015) and absolute level of PMI reading signalling a risk of manufacturing sector recession in India. 

Overall, we now have all BRIC Manufacturing PMIs below 50 line for the first time since March 2009. This strongly shows overall continued downward pressures on growth in world’s largest emerging markets.

4/1/16: Russian PMI in 4Q 2015: Signalling Continued Weaknesses


Having Russian PMIs for December 2015 allows us to take a look at the economy quarterly performance signals. As noted in the previous post (http://trueeconomics.blogspot.ie/2016/01/4116-russia-services-manufacturing-pmis.html) with the decline in output reflected across both manufacturing production and services activity, Russian economy’s composite PMI averaged 49.1 in 4Q 2015 which is much worse than 50.4 average for 3Q 2015, suggesting that not only did the economy failed to attain stabilisation, but that growth might have turned more negative in 4Q 2015.

Let’s take a closer look at the quarterly averages by sector.

Russian Manufacturing PMI for 4Q 2015 stood at 49.7, which is a gain on 48.4 in 3Q 2015 and marks the strongest quarterly reading since 4Q 2014, but also marks the fourth consecutive quarter of sub-50 readings. The weaknesses in Manufacturing are especially troubling, as the sector is broadly targeted for imports substitution - a major policy shift by the Government since the start of 2015. Making matters worse, the sector should have benefited from strong ruble depreciation over the last 12 months, which - as it appears so far - did not lead to substantial increase in exporting activity. In part, this reflects weaknesses in global demand, but in part it reflects structural problems in Russian manufacturing that find goods supplied by the sector of generally non-competitive quality for global markets, even amidst improved price competitiveness.

Overall, we now have four consecutive quarters of sub-50 readings in Manufacturing sector - for the first time since 3Q 2008-1Q 2009 period.


Russian Services PMI for 4Q 2015 stood at 48.5, down sharply on 50.7 reading in 3Q 2015 and marking the weakest reading in the series since the start of 2Q 2015.Disappointingly, 4Q reading for Services sector broke two consecutive quarters of above 50 readings and done so sharply. Since the start of 1Q 2014, the sector has now posted sub-50 readings in 5 out of 8 quarters, and it managed to post statistically significant readings above 50 in only two quarters.


The above has meant that the composite activity index (distinct from Composite PMI) for Russian stood at 93.9 in 4Q 2015, which is an improvement on 90.3 in 3Q 2015, but marks fifth consecutive quarter of the overall production growth being negative (across combined services and manufacturing sectors). While 4Q composite indicator was the strongest in three quarters, it remains extremely weak (statistically significantly below zero growth marker of 100) and the third weakest of all quarters since the start of 3Q 2009.

On the net, therefore, while Russian economy posted some 4Q signals of growth consistent with less sharp contraction across combined Services and Manufacturing sectors, than in 2Q-3Q 2015, the deterioration in growth conditions in the economy in 4Q 2015 remained pronounced and this strongly suggests that we did not witness stabilisation of the Russian economy in 4Q 2015.


Stay tuned for analysis of BRIC PMIs next.

4/1/16: Russia Services & Manufacturing PMIs: December 2015


Russian PMIs are out for December 2015, so here is monthly data reading:

Russian Manufacturing PMIs posted a deterioration in sector performance in December, falling to 48.7 from 50.1 in November. This reverses two consecutive months of above 50 readings in October and November. It is worth noting that October-November readings were not statistically distinct from 50.0. On a quarterly basis, 4Q 2015 average reading was 49.7, which is better than 48.4 average for 3Q 2015, but still below 50.0 line. Overall December reading was the weakest since August 2015 and signals that the much anticipated stabilisation of the Russian economy did not take place in December.

Per Markit release: “Leading the deterioration in business conditions at Russian manufacturers was a fall in production. The rate of contraction quickened to the fastest since May 2009, with the majority of panellists linking this to a drop in new order intakes. As a result, a lower volume of post-production inventories was recorded. Meanwhile, Russian manufacturers continued to shed jobs during December. Falling employment has been reported in every survey period since July 2013, with the rate of contraction quickening to the sharpest in three months. The decline in staff numbers was matched by a solid deterioration in outstanding business volumes. Backlogs of work have been depleted in each of the past 34 survey periods. Elsewhere, incoming new orders slipped into decline in December, ending a three-month sequence of growth. However, the drop in new work was marginal and centred on intermediate goods producers. Data suggested that the main source of weakness was external, as export orders were down sharply.”

Chart to illustrate:


Russian Service PMI also reported a fall in output marking the third successive month of declines, driven by a slight decrease in new business levels. Job cuts continued in the sector as outstanding business deteriorated. The headline seasonally adjusted Russia Services Business Activity Index fell to 47.8 in December from already contractionary 49.8 in November. In 4Q 2015, average Services PMI reading was 48.5 against 50.7 in 3Q 2015, showing stronger deterioration in growth conditions in the sector in 4Q 2015. Current reading of 47.8 is the joint-weakest (with October 2015) for nine months.

Per Markit release: “New business levels at service providers slipped further into decline during December. However, the rate at which new work deteriorated was only marginal. Where a lower volume of new sales was recorded, panellists linked this to a combination of waning demand in the sector and payment difficulties being experienced by customers… With business activity at Russian service providers declining, pressures on operating capacity fell further in December. The rate at which work-inhand depleted eased to the slowest in three months yet remained solid overall. Anecdotal evidence suggested that lower backlogs of work were attributed to a drop in new business. Falling staff numbers have been reported in every month since March 2014, with the latest drop at a faster pace than in November. There was some evidence that lower employment reflected squeezed cash availability at service providers.”

Chart to illustrate:


Finally, Russia’s Composite index slipped into contraction during December, falling to 47.8, from 50.5 in November, with the decline in output reflected across both manufacturing production and services activity. Overall, Russian economy’s composite PMI averaged 49.1 in 4Q 2015 which is much worse than 50.4 average for 3Q 2015.


The data strongly suggests that not only did the economy failed to attain stabilisation, but that growth might have turned more negative in 4Q 2015.

I will be posting on quarterly figures for PMIs next, so stay tuned for more.

Saturday, January 2, 2016

2/1/16: Россия, Украина и ЕС: полтора года переговоров впустую


My comment for BBC Russian Service on the stalemate in EU-Russian-Ukrainian talks concerning the EU-Ukraine trade agreement:  http://www.bbc.com/russian/business/2015/12/151229_trade_russia_ukrain_eu.

In summary: the failure of the talks is mutual.


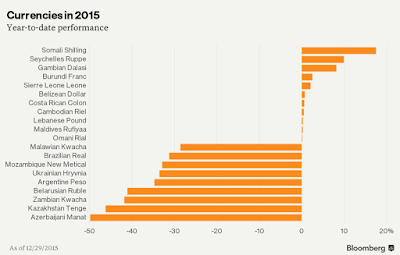
2/1/16: Bloomberg Guide to Markets: 2015 Summed Up


In case you want a neat (although narrow) summary of 2015 in the markets, here's one via Bloomberg:

For Equities:

For Currencies:

For Government Bonds:

And more here: http://www.bloomberg.com/news/articles/2015-12-31/here-are-the-best-and-worst-performing-assets-of-2015.

2/1/16: Don't miss that Urals spread


Over recent months, I have been highlighting the importance of considering, when it comes to Russian economy and Ruble analysis, not just quoted spot prices for Brent grade oil but also the Brent-Urals spread.

At last, some media (in Russia) is catching up: Падение спроса на российскую нефть и сильный доллар не дают рублю укрепиться - http://invst.ly/ocwh.


2/1/16: The Future of Global Finance: Moscow 2015


Back at the start of December, I spoke at an international finance conference in Moscow covering developing trends in global finance.  You can find the conference archive (in English) here: http://cmconference.ru/en/about including videos of presentations. My interview relating to the conference is available here: https://www.youtube.com/watch?v=g7Og2yIDaGY. Some coverage of the conference in the press here: http://www.vestifinance.ru/articles/65070.


2-я Международная финансовая конференция «Валютные рынки. Мировые практики» проходила в Москве 18-19 ноября. Она была организована ГК Teletrade, совместно с Dow Jones, Google и Московской школой управления «Сколково». Архив конференции, включая видео презентаций (Русская версия): http://cmconference.ru/ru/about.


2/1/16: QE for the People 2016


Back in March 2015, I have signed a group petition in support of the QE for the People idea of using monetary policy to directly inject funding into the economy via households' budgets. Since then the idea continued to gain traction and in December 2015 the campaign issued an in-depth analysis of the idea, and a renewed call for public and professional engagement.