Saturday, September 15, 2012

15/9/2012: Derivatives v Banks Lending and Economic Growth


A recent by Becchetti, Leonardo and Ciampoli, Nicola, What is New in the Finance-Growth Nexus: OTC Derivatives, Bank Assets and Growth (July 20, 2012). CEIS Working Paper No. 243 (Available at SSRN: http://ssrn.com/abstract=2114072) covers the issue of "finance-growth nexus before and around the global financial crisis using for the first time OTC derivative data in growth estimates."

According to the authors, data shows "that bank assets contribute… negatively [to economic growth], while OTC derivative positively or insignificantly with a much smaller effect in magnitude. At the same time the impact of the crisis is captured by a very strong negative effect of year dummies around the event."

The study lists various positive and negative channels for feedback from the derivatives to growth and establishes the net effect of these channels.

"Our main finding is therefore the identification of three empirical channels: a first positive and weak link between OTC trading and economic growth, a second negative and significant link between aggregate bank credit and economic growth (larger in magnitude than the first) and the negative impact of the global financial crises in the last years of our sample period. The first channel is likely to capture wealth and efficiency effects embedded in derivatives hedging properties. An overall evaluation of the role of derivatives on growth deserves however further attention. If the negative impact of bank credit, and definitely more so, the overall negative effect of the financial crisis have to be related to the negative properties of derivatives (increase of interconnectedness and systemic risk) the net impact of the latter may turn out to be negative at least in the current regulatory framework."

15/9/2012: In life things are a bit like in art


The best illustration of the current Presidential Campaign in the US is this painting by Mark Tansey:

Depicting Sherlock Holmes and Professor Moriarty in a deadly struggle at the edge of the precipice. One articulate and sophisticated villain v one cool dude who delivers over the fiscal cliff. Ah, one would hope we can distinguish which one is which: is Holmes = Romney or Obama? Never mind, the truth is - it's the cliff that dominates the whole set up.

15/9/2012: Brazil soaks bank bondholders


H/T to Ed - here's Brazil shutting down one medium-sized insolvent bank (link) and triggering the largets corporate bonds default in Latin America since 2002.

According to the report, ATMs still are functioning in Brazil. 

And a lovely quote from the Irish Government advising HSBC (alas via their Brazil division):

“It is quite healthy to have this kind of reminder every once in awhile that doesn’t pose a systemic threat,” said Pedro Bastos, chief executive officer of HSBC Global Asset Management in Brazil, in a phone interview from Sao Paulo. “It’s an important reminder that risk and return need to be in line with the investor’s profile.”

And lest we think Brazil's CB is not 'reckless' enough (in Irish counterparts parlance), Brazilian authorities are investigating fraud allegations - something that Irish authorities are not too keen on doing.

Obviously, there will be likely costs associated with the decision, namely, funding costs for the country medium sized banks might rise (they will most certainly rise in the short term, but it is the medium term that anyone should be concerned with as Central Banks can provide the bridge for the shorter term funding).

15/9/2012: Irish Services Activity July 2012


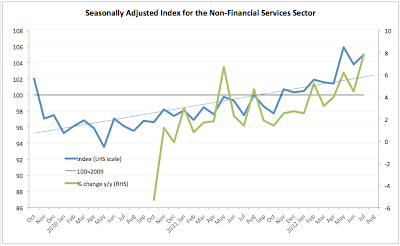
Recent release of the monthly Services sectors activity index for Ireland highlights the stabilizing nature of the current activity in the economy, since the end of Q1 2012. Here are some details:

Overall seasonally-adjusted monthly services activity rose 1.2% in July 2012 m/m and was up 7.8% y/y. Index 3mo MA through July is at 104.9 ahead of the 3mo MA through  March 2012 (101.6) and well ahead of 98.9 reading in 3mo to July 2011. Year on year increase of 7.8% is the strongest since November 2010. (Note: index is being compiled only since October 2010, so trend comparatives are against weak position. Index is set at 100=2009).

Here's the chart summarizing index levels and y/y growth rates:


By-sector activity:
  • Wholesale and Retail Trade (+3.4% m/m and +8.0% y/y), 
  • Business Services (+2.5% m/m and 3.1% y/y), 
  • Accommodation and Food Service Activities (+1.2% m/m and no change y/y) and 
  • Information and Communication (+0.1% m/m and +16.3 y/y) 
  • Transportation and Storage (-3.5% m/m and 8.0% y/y), and 
  • Other Services (-2.2% m/m and +0.9% y/y).

Chart to illustrate:


3mo MA through July 2012 are also encouraging:
  • Wholesale & Retail Trade at 109.7, up on 107.8 3 months ago and on 103.4 a year ago
  • Information & Communications at 112.9 well ahead of 109.4 in 3mo through April and on 99.6 recorded in 3 months through July 2011
  • Business Services at 103.3, strongly up on 98.4 in 3 months through April, but unchanged y/y
  • Transportation & Storage at 109.0, up on 104.0 in 3mo through April 2012 and on 98.2 a year ago
  • Accommodation and Food remain the lagging sector despite Government efforts to stimulate it at 89.0 in 3mo average through July 2012 slightly up on 87.1 in 3mo through April 2012 and down on 90.3 in 3mo through July 2011.
  • Other Services are also relatively flat, but with a slight upside at 74.3 in 3mo through July 2012 compared against previous 3mo average of 72.4 and 3mo through July 2011 average of 72.8.
Overall, some good news here and a continuation on the trend highlighted a month ago.

Friday, September 14, 2012

14/9/2012: 36 years of state-incentivised inflation?


Some historical (up to August 2012) charts on Irish CPI. Orange bars mark state-dominated categories of goods and services. Interpret these as you wish. Summary table at the end is pretty much self-explanatory:


14/9/2012: Irish CPI for August - detailed charts


With some delay, here's the analysis of latest Consumer Price Inflation data for Ireland for August 2012:

Summary table of monthly and annual changes
Note: I will blog on overall inflation trend separately in the next post.

Here are changes by sector, including notable changes by sub-sector.

Monthly inflation:


Big spikes are in:

  • Clothing and Footware +6.6%
  • Mortgage Interest -3.2% (although CSO does not separate the differences between the ARM and trackers, which have been moving in the opposite directions)
  • Transport +1.6% (Petrol up 3.5%, Diesel up 4.0%
  • Transport Services +0.5% driven by Air Transport (+1.0%)
Year on year comparatives are more revealing:


The above clearly shows that most of the inflation on annual basis remains concentrated in the state controlled sectors (either via regulatory price hikes or direct state taxation and charges effects or via semi-states hiking prices on their own). Note that even in the 'Other Services' category, the inflation is driven by household charge being added in April 2012.

The Government strategy is clear, albeit, unlike the previous Government, the current one stays away from openly declaring this: milk Irish consumers for every penny they got via higher charges and state-captured prices. In effect, much of the price increases not caused by direct state taxation are still a form of taxation as the Government collects higher VAT and other taxes on those goods and services, provision of which it controls via semi-state bodies.