Friday, July 21, 2017

21/7/17: Ireland: a Poster Child for Austerity through Taxes


Ever since the beginning of the Crisis in 2008, Irish policymakers insisted staking the claims to the heroic burden sharing of the post-Crisis fiscal adjustments across the entire society, the claims closely mirrored by the supporting white papers, official state-linked think tanks and organizations, and even the IMF.

Time and again, independent analysts, myself included, probed the State numbers and found them to be of questionable nature. And time and again, Irish political and policy elites continued to insist on the credit due to them for steering the wreck of the Irish economy out of the storm's path. Until, finally, by the end of 2016, Ireland officially was brought to enjoy falling official debt burdens and drastically declining deficits. The Hoy Grail of fiscal sustainability, delivered by FF/GP and subsequently (and especially) the FG/LP coalitions was in sight.

Well, here's a new instalment of holes that the official narrative conceals. CSO's latest data for full fiscal year 2016 on headline fiscal performance metrics was published earlier this month. It makes for an enlightening reading.

Take a simple chart:

Here, two figures are plotted against each other:

  • General Government Expenditure, less Capital Transfers (the bit that predominantly is skewed by 2011 banks resolution measures); and
  • Taxes and Social Contributions on the revenue side.
The two numbers allow us to compare the oranges and oranges: policy-driven (as opposed to one-off) revenues and policy-driven (as opposed to banking sector's supports) expenditures. Fiscal discipline is the distance between the two.

And what do we see in this chart? 
  1. Gap between tax revenues and non-capital transfers spending shrunk EUR899 mln in 2012 compared to 2011 and proceeded to fall EUR2.698 billion in 2013, EUR 4.22 billion in 2014, EUR 4.416 billion in 2015 and EUR1.815 billion in 2016. So far - good for 'austerity' working, right?
  2. Problem is: all of the reductions came courtesy of higher tax take: up EUR 1.567 billion in 2012 compared to 2011, EUR2.107 billion in 2013, EUR4.525 billion in 2014, EUR4.724 billion in 2015 and EUR2.713 billion in 2016.
  3. All said, over 2011-2016, cumulative reductions in ex-capital transfers tax deficit were EUR14.05 billion, but tax increases were EUR15.66 billion, which means that the entire story of Irish 'austerity' was down to one source: tax take increases. The Irish State did not cut its own spending. Instead, it raised taxes and never looked back.
  4. In fact, ex-capital transfers spending rose not fall, even as labor markets gains cut back on official unemployment. In 2011, ex-capital transfers Irish State spending was EUR71.403 billion. This marked the lowest point for expenditure in the data set that covers 2011-2016. Since then, 2015 expenditure was EUR72.113 billion and 2016 expenditure was EUR 73.011 billion.
  5. So there was no aggregate spending austerity. None at all.
  6. But there was small level of austerity in one category of spending: social benefits. These stood at EUR28.827 billion in 2011, rising to the cyclical peak of EUR29.454 billion in 2012, then falling to EUR28.526 billion in 2013 and to the cyclical low of EUR28.076 in 2014. Just as the labor markets returned to health, 2015 social benefits spending rose to EUR28.421 and 2016 ended up posting expenditure of EUR28.494. So the entire swing from peak spending during the peak crisis to the latest is only EUR418 million. Granted, small amounts mean a lot for those on extremely constrained incomes, so the point I am making is not that those on social benefits did not suffer due to benefits cuts - they did - but that their pain was largely immaterial to the claims of fiscal discipline.
So what do we have, folks? More than 100% of the entire fiscal health adjustment in 2011-2016 has been delivered by the rise in tax take by the State - the coercive power whereby money is taken off the people without providing much a benefit in return. That, in the nutshell, is Irish austerity: charging households, many struggling with debt, loss of income, poorer health and so on, to pay for... what exactly did we pay for?.. I'll let you decide that.

Thursday, July 20, 2017

20/7/17: U.S. Institutions: the Less Liberal, the More Trusted


In my recent working paper (see http://trueeconomics.blogspot.com/2017/06/27617-millennials-support-for-liberal.html) I presented some evidence of a glacial demographically-aligned shift in the Western (and U.S.) public views of liberal democratic values. Now, another small brick of evidence to add to the roster:
The latest public opinion poll in the U.S. suggests that out of four 'net positively-viewed' institutions of the society, American's prefer coercive and non-democratic (in terms of internal governance - hierarchical and command-based) institutions most: the U.S. Military and the FBI. as well as the U.S. Federal Reserve. Note: the four are U.S. military, the FBI and the Supreme Court and the Fed are all institutions that are not open to influence from external debates and are driven by command-enforcement systems of decision making and/or implementation. Whilst they serve democratic system of the U.S. institutions, they are  subject to severely restricted extent of liberal checks and balances.

Beyond this, considering net-disfavoured institutions, executive powers (less liberty-based) of the White House are less intensively disliked compared to more liberty-based Congress.

20/7/17: Euro Area's Great non-Deleveraging


A neat data summary for the European 'real economic debt' dynamics since 2006:

In the nutshell, the Euro area recovery:

  1. Government debt to GDP ratio is up from the average of 66% in 2006-2007 to 89% in 2016;
  2. Corporate debt to GDP ratio is up from the average of 72% in 2006-2007 to 78% in 2016; and
  3. Household debt to GDP ratio is down (or rather, statistically flat) from the average of 58.5% in 2006-2007 to 58% in 2016.
The Great Austerity did not produce a Great Deleveraging. Even the Great Wave of Bankruptcies that swept across much of the Euro area in 2009-2014 did not produce a Great Deleveraging. The European Banking Union, and the Genuine Monetary Union and the Great QE push by the ECB - all together did not produce a Great Deleveraging. 

Total real economic debt stood at 195%-198% of GDP in 2006-2007 - at the peak of previous asset bubble and economic 'expansion' dynamism, and it stands at 225% of GDP in 2016, after what has been described as 'robust' economic recovery. 

Tuesday, July 18, 2017

17/07/17: Debt Relief v Payments Relief: A Lesson Ireland Should Have Learned


An interesting study looked into two sets of debt relief measures:

  1. Immediate payment reductions to target short-run liquidity constraints and 
  2. Delayed debt write-downs to target long-run debt constraints.
It is worth noting that the first measure was roughly similar to the majority of 'sustainable debt resolution' measures introduced in Ireland (e.g. temporary relief on payments, split mortgages, etc) that temporarily delay repayments at the full rate. Even worse, in Irish case, policy instruments that delay repayments are generally associated with roll up of unpaid debt and in some cases, with interest on the unpaid debt, thus increasing life-cycle level of indebtedness. 

The second set of measures used in the NBER study are broadly consistent with debt forgiveness measures, where actual debt reduction took place at both the principal and interest levels.

So what did NBER study find?

"We find that the debt write-downs significantly improved both financial and labor market outcomes despite not taking effect for three to five years. In sharp contrast, there were no positive effects of the more immediate payment reductions. These results run counter to the widespread view that financial distress is largely the result of short-run constraints."

In other words, it appears that empirical evidence supports debt relief, as opposed to temporary payments reductions. Irish banks and authorities, in continuing to insist on preferences for temporary relief measures are simply driven by pure self interest - protecting banks' balancesheets - not by a desire to deliver a common good, such as speedier recovery of the heavily indebted households. 

Specifically, for debt relief: "For the highest-debt borrowers, the median debt write-down in the treatment group increased the probability of finishing a repayment program by 1.62 percentage points (11.89 percent) and decreased the probability of filing for bankruptcy by 1.33 percentage points (9.36 percent). The probability of having collections debt also decreased by 1.25 percentage points (3.19 percent) for these high-debt borrowers, while the probability of being employed increased by 1.66 percentage points (2.12 percent). The estimated effects of the debt write-downs for credit scores, earnings, and 401k contributions are smaller and not statistically significant. Taken together, however, our results indicate that there are significant benefits of debt relief targeting long-run debt overhang in our setting".

For repayment relief: "we find no positive effects of the minimum payment reductions targeting short-run liquidity constraints. There was no discernible effect of the payment reductions on completing the repayment program... The median payment reduction in the treatment group also increased the probability of filing for bankruptcy in this sample by a statistically insignificant 0.70 percentage points (6.76 percent) and increased the probability of having collections debt by a statistically significant 1.40 percentage points (3.56 percent). There are also no detectable positive effects of the payment reductions on credit scores, employment, earnings, or 401k contributions. In sum, there is no evidence that borrowers in our sample benefited from the minimum payment reductions, and even some evidence that borrowers seem to have been hurt by these reductions."

Why did payment relief not work? "The payments reductions increased the length of the repayment program in the treatment group by an average of four months and, as a result, increased the number of months where a treated borrower could be hit by an adverse shock that causes default (e.g., job loss)."

Now, imagine the Irish authorities arguing that no such shocks can impact over-indebted households over 10-20 years the repayment relief schemes, such as split mortgages or temporarily reduced repayments, are designed to operate. 

17/7/17: New Study Confirms Parts of Secular Stagnation Thesis


For some years I have been writing about the phenomena of the twin secular stagnations (see here: http://trueeconomics.blogspot.com/2015/07/7615-secular-stagnation-double-threat.html). And just as long as I have been writing about it, there have been analysts disputing the view that the U.S. (and global) economy is in the midst of a structural growth slowdown.

A recent NBER paper (see here http://www.nber.org/papers/w23543) clearly confirms several sub-theses of the twin secular stagnations hypothesis, namely that the current slowdown is

  1. Non-cyclical (extend to prior to the Global Financial Crisis);
  2. Attributable to "the slow growth of total factor productivity" 
  3. And also attributable to "the decline in labor force participation".

Wednesday, June 28, 2017

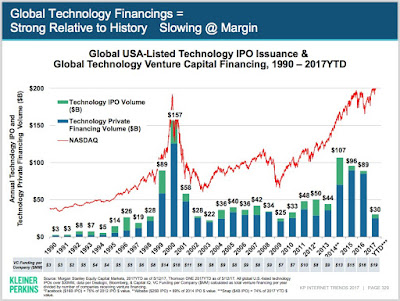
28/6/17: Tech Financing and NASDAQ: Divorce Proceedings Afoot?

Based on the recent data from Kleiner Perkins,  there has been a substantial inflection point in the relationship between NASDAQ index valuations and tech IPOs around 2015 that continued into 2016-2017 period.

Over the period 2009-2014, the positive correlation between NASDAQ and global technology IPOs and PE/VC funding was largely a matter of regularity. Starting with 2015, this relationship turned negative. Which means one pesky thing when it comes to the real economy: the great engine of enterprise innovation (smaller, earlier stage companies gaining sunlight) as opposed to behemoths patenting (larger legacy corporations blocking off the sunlight with marginal R&D) is not exactly in a rude health.

28/6/17: Seattle's Minimum Wage Lessons for California


Two states and Washington DC are raising their minimum wages comes July 1, with Washington DC’s minimum wage rising to $12.50 per hour, the highest state-wide minimum wage level in the U.S. This development comes after 19 states raised their minim wages since January 1, 2017. In addition, New York and Oregon are now using geographically-determined minimum wage, with urban residents and workers receiving higher minimum wages than rural workers.

Still, one of the most ambitious minimum wage laws currently on the books is that of California. For now, California’s minimum wage (for employers with 26 or more workers) is set us $10.50 per hour (a rise of $0.5 per hour on 2016), which puts California in the fourth place in the U.S. in terms of State-mandated minimum wages. It will increase automatically to $11.00 comes January 1, 2018. Thereafter, the minimum wage is set to rise by $1.00 per annum into 2022, reaching $15.00. From 2023 on, minimum wage will be indexed to inflation. Smaller employers (with 25 or fewer employees) will have an extra year to reach $15.00 nominal minimum wage marker, from current (2017) minimum wage level of $10.00 per hour. All in, in theory, current minimum wage employee working full time will earn $21,840 per annum, and this will rise (again in theory) by $1,040 per annum in 2018. So, again, in theory, nominal earnings for a full-time minimum wage employee will reach $31,200 in 2022.


In cities like San Francisco and Los Angeles, local minim wages are even higher. San Francisco is planning to raise its minim wage to $15.00 per hour in 2018, while Los Angeles is targeting the same level in 2020. This means that in 2018, San Francisco minimum wage workers will be $8,320 per annum better off than the State minimum wage earners, and Los Angeles minim wage earnings will be $4,160 above the State level in 2020.

UC Berkeley research centre for labor economics, http://laborcenter.berkeley.edu/15-minimum-wage-in-california/, does some numbers crunching on the distributional impact of California minimum wages. Except, really, it doesn’t. Why?

Because the problem with minimum wage impact estimates is that it ignores a range of other factors, such as, for example the impacts of minimum wage hikes on substations away from labor into capital (including technological capital), and the impacts of jobs offshoring, etc. While economists can control for these factors imperfectly, it is impossible to know with certainty how specific moves in minimum wages will effect incentives for companies to increase capital intensity of their operations, change skills mix for employees, alter future growth and product development plans, etc.

What we do have, however, is historical evidence to go by. And that evidence is a moving target. In particular, it is a moving target because as minimum wages continue to increase, at some point (we call these inflation points), past historical relationships between wages and hours worked, wages and technological investments, wages and R&D, and so on, change as well.

Take the most recent example of Seattle.

In 2016, Seattle raised its $11.00 per hour minimum wage to $13 per hour, the highest in the U.S. Subsequent protests demanded an increase to $15.00 per hour in 2017. However, research by economists at the University of Washington shows that the wage hike could have
1) Triggered steep declines in employment for low-wage workers, and
2) Resulted in a drop in paid hours of work for workers who kept their jobs.

Overall, these negative impacts have more than cancelled out the benefits of higher wages, so that, on average, low-wage workers now earn $125 per month less than before the minimum wage was hiked in January 2016. In simple terms, instead of rising by $4,160 per annum, minimum wage earners’ wages fell $1,500 per annum, creating the adverse movement in earnings of $5,160. Given current minimum wage earnings, in theory, delivering $27,040 per annum in full time wages, this is hardly an insignificant number. For details of the study, see https://evans.uw.edu/sites/default/files/NBER%20Working%20Paper.pdf.

The really worrying matter is that the empirical estimates presented in the University of Washington studies do not cover longer-term potential impacts from capital deepening and technological displacement of minimum wage jobs, because, put simply, we don’t have enough time elapsing from the latest minimum wage hike. Another worrying matter is that, like the majority of studies before it, the Washington study does not directly control for the effects of Seattle’s booming local economy on minimum wage impacts: as Seattle faces general unemployment rate of 3.2 percent, the adverse impacts of the latest hike in the minimum wages can be underestimated due to the tightness in labor markets.

Now, consider the recent past: in her Presidential bid, Hillary Clinton was advocating a federal minimum wage hike to $12.00 per hour from $7.25 per hour. That was hardly enough for a large number of social activists who pushed for even higher hikes. This tendency amongst activists - to pave the road to hell with good intentions, while using someone else’s money and work prospects - is quite problematic. Econometric analysis of minimum wage effects is highly ambiguous and the expected impacts of minimum wage hikes are highly uncertain ex ante. This ambiguity and uncertainty adversely impacts not only employers, including smaller businesses, but also employees. Including those on minimum wages. It also impacts prospective minimum wage employees who, as Seattle evidence suggests, might face lower prospects of gaining a job. More worrying, the parts of the minimum wage literature that show modest positive impacts from minimum wage hikes are based on the data for minimum wage increases from lower levels to moderate levels, not from high levels to extremely high, as is the case with Seattle, San Francisco, Los Angeles and other cities.

That point seems to be well-reflected in the latest study from the University of Washington. In fact, June 2017 paper results stand clearly contrasted by 2016 study that showed that April 2015 hike in Seattle’s minimum wage from $9.47 per hour to $11.00 per hour was basically neutral in terms of its impact on wages. Losses to those workers who ended up without a job post-minimum wage hike were offset by gains for those worker who kept their employment. In effect, April 2015 hike was a transfer of money from jobs-losing workers to jobs keepers.

In a separate study, from the UC Berkeley labor economics center http://irle.berkeley.edu/seattles-minimum-wage-experience-2015-16/, the researchers found that Seattle’s minimum wage hikes were actually effective in boosting incomes of minimum wage workers, albeit only in one sector: the food industry, and the results are established on a cumulative basis for 2009-2016 period. In addition, University of Washington study used higher quality, more detailed and directly comparable data on minimum wage earners than the UC Berkeley study. However, on the opposite side of the argument, the former study excluded multi-location enterprises, e.g. fast food companies, who are often large scale employers of minimum wage workers. The UC Berkeley study is quite bizarre, to be honest, in so far as it focuses on one sector, while the study from the UofW clearly suggests that wider data is available.

In other words, the UC Berkeley study does not quite contradict or negate the University of Washington study, although it highlights the complexity of analysing minimum wage impacts.


PS: This lifts the veil of strangeness from the UC Berkeley study: http://www.zerohedge.com/news/2017-06-28/fake-research-seattle-mayor-knew-critical-min-wage-study-was-coming-so-he-called-ber. It turns out UC Berkeley study was a commissioned hit, financed by the office of the Mayor of Seattle to pre-empt forthcoming UofW study. Worse, the Berkeley team were provided by the Mayor of Seattle with the pre-released draft of the UofW paper. This is at best unethical for both the Mayor's office and for the UC Berkeley team.

Tuesday, June 27, 2017

27/6/17: Millennials’ Support for Liberal Democracy is Failing


New paper is now available at SSRN: "Millennials’ Support for Liberal Democracy is Failing. An Investor Perspective" (June 27, 2017): https://papers.ssrn.com/sol3/papers.cfm?abstract_id=2993535.


Recent evidence shows a worrying trend of declining popular support for the traditional liberal democracy across a range of Western societies. This decline is more pronounced for the younger cohorts of voters. The prevalent theories in political science link this phenomena to a rise in volatility of political and electoral outcomes either induced by the challenges from outside (e.g. Russia and China) or as the result of the aftermath of the recent crises. These views miss a major point: the key drivers for the younger generations’ skepticism toward the liberal democratic values are domestic intergenerational political and socio-economic imbalances that engender the environment of deep (Knightian-like) uncertainty. This distinction – between volatility/risk framework and the deep uncertainty is non-trivial for two reasons: (1) policy and institutional responses to volatility/risk are inconsistent with those necessary to address rising deep uncertainty and may even exacerbate the negative fallout from the ongoing pressures on liberal democratic institutions; and (2) investors cannot rely on traditional risk management approaches to mitigate the effects of deep uncertainty. The risk/volatility framework view of the current political trends can result in amplification of the potential systemic shocks to the markets and to investors through both of these factors simultaneously. Despite touching on a much broader set of issues, this note concludes with a focus on investment strategy that can mitigate the rise of deep political uncertainty for investors.


Thursday, June 22, 2017

22/6/17: Efficient Markets for H-bomb Fuel - 1954


For all the detractors of the EMH - the Efficient Markets Hypothesis - and for all its fans, as well as for any fan of economic history, this paper is a must-read: http://www.terry.uga.edu/media/events/documents/Newhard_paper-9-6-13.pdf.

Back in 1954, an economist, Armen A. Alchian, working at RAND conducted the world’s first event study. His study used stock market data, publicly available at the time, to infer which fissile fuel material was used in manufacturing highly secret H-bomb. That study was immediately withdrawn from public view. The paper linked above replicates Alchian's results.


22/6/17: Unwinding Monetary Excesses: FocusEconomics


Focus Economics are running my comment (amongst other analysts') on the Fed and ECB paths for unwinding QE: http://www.focus-economics.com/blog/how-will-fed-reduce-balance-sheet-how-will-ecb-end-qe.


21/6/17: Azerbaijan Bank and Irish Saga of $900 million


A Bloomberg article on the trials and tribulations of yet another 'listing' on the Irish Stock Exchange, this one from Azerbaijan: https://www.bloomberg.com/news/articles/2017-06-18/azerbaijan-bank-took-900-million-irish-detour-on-way-to-default. Includes a comment from myself.