Saturday, August 18, 2012

18/8/2012: Tax Progressivity in Sweden 1968-2009


Very interesting research on tax progressivity using Swedish data:

Bengtsson, Niklas, Holmlund, Bertil and Waldenström, Daniel paper "Lifetime Versus Annual Tax Progressivity: Sweden, 1968-2009" (June 29, 2012, CESifo Working Paper Series No. 3856: http://ssrn.com/abstract=2098702) looked at the evolution of tax progressivity in Sweden from both annual and lifetime perspectives.

Per authors, "a fundamental problem with conventional assessments of tax burdens is that they typically rely on annual cross-sectional outcomes. Incomes vary over the life cycle, with young people often being low-income earners regardless of whether they will be high-paid surgeons or low- paid clerks in the future. Old-age pensioners typically do not pay payroll taxes, even though they may well earn more than younger individuals in the labor force. Capital gains are typically observable and taxed when they are realized rather than when they accrue, and such one- shot realizations may not accurately depict the lifetime income status or lifetime tax burden. Accounting for lifetime variations in both income and the ability to pay taxes is important for making a balanced assessment of the trade-off between the equity and efficiency of the tax system."

The paper looks at the implications of studying tax progressivity in an annual versus a lifetime perspective by exploiting a "rich data source with register information on the taxes paid and benefits received by a large and nationally representative sample of individuals".

The authors use a panel covering a 42-year period "to compute measures of “life- time tax progressivity”, relating information about actual lifetime tax payments and actual lifetime incomes for various parts of the distribution of lifetime incomes… The richness and size of our data – a sample size of approximately 200,000 individuals per year – allow us to compare narrow in- come segments at the top of the income distribution, such as percentiles and tenths of percentiles. Such focus is of particular relevance when pinpointing the differing impacts of labor and capital taxation."

Another major contribution of the study is "providing a comprehensive assessment of how the redistributive properties of the Swedish tax system have evolved in recent decades. The Swedish tax system has undergone major changes over the past 40 years. The overall tax burden has increased, and government tax revenues have gradually become more dependent on social security contributions and value-added taxes. Some specific reforms are particularly noteworthy. In 1971, the traditional system with joint taxation of married couples was replaced by a system in which each spouse pays taxes on his or her own income. The tax reform of 1991, called the “tax reform of the century” for its groundbreaking impact, involved substantial cuts in marginal income taxes along with the introduction of a dual income tax system in which earned income and capital income are taxed at different rates. More recent reforms include the abolition of the wealth tax as well as the introduction of a system with earned income tax credits."

Core results are:

First, the study finds that "lifetime tax progressivity is lower than tax progressivity in almost any single year. This finding is primarily due to the considerable within-life redistribution, where, e.g., the amounts received as student or old- age support almost offset the taxes as income earner."

Second, the authors "show that the discrepancy between annual and lifetime tax progressivity reflects the transitory nature of low-income status rather than the transitory nature of high income. Many of the individuals earning low or zero market income thus do not permanently belong to the bottom of the income distribution; they can be workers who are temporarily outside the labor market, unemployed, in educational programs or on sick leave. These individuals appear to be greatly “favored” by the tax-cum-benefit system when using annual data as opposed to lifetime estimates. By contrast, transitory high-income shocks, such as those caused by large realized capital gains, fall mainly on those who have already high permanent incomes. At the top of the income distribution, annual progressivity estimates therefore correlate highly with lifetime tax burdens."

Third, the authors "document the evolution of Swedish tax progressivity and find that it has followed an inverted U-shape over the past four decades, increasing sharply in the 1970s and dropping in the 1990s and 2000s. …When only actual taxes are considered, the primary source of the variation in progressivity appears to be changes in the tax system, in particular the tax reforms of 1971 and 1991, rather than trends in the distribution of market incomes. The dramatic rise in unemployment – and thus associated transfers – during the economic crisis of the 1990s increased the degree of tax-and-transfer progressively."

Moreover, "comparing Sweden’s experience with progressivity with that of Great Britain and the U.S., taxes in Sweden appear less progressive, primarily due to the high levels of income and payroll taxes paid by low-income earners."

Lastly, the study "decomposition of tax bases, in which we include not only different income taxes but also pay- roll, wealth and consumption taxes, reveals drastic restructuring over the study period. In particular, payroll taxes have become increasingly important, whereas capital taxation (including taxes on capital income, real estate, and wealth) has diminished substantially."

A neat summary in charts:


18/8/2012: What the IDA forecasts don't tell us?

I waited for several days before posting about the latest mystery of Irish statistics. 

This presentation from IDA contains the following chart:


Now, IDA is correct in highlighting the Current Account as a key to our recovery 'policies'. For a number of reasons:

  1. In virtually all debt overhang recessions in the past, return to positive surpluses on current account were required as a necessary, albeit not always sufficient, condition to restore economy to a stable path
  2. In Ireland, we have witnessed some significant improvements in the Current Account so far during the Great Recession
Alas, the above chart is a mystery to me. Let me explain.

Firstly, it cites CSO as the source of the chart. I have contacted CSO about their 'forecasts' for 2012-2017 period for the Current Account and their reply was: 
"Having consulted with my colleagues they assure me that they do not produce forecasts, let alone five year forecasts. Furthermore, my colleague suggested that the figures might be derived from a paper published by the Dept. of Finance (page 9): http://budget.gov.ie/budgets/2012/Documents/Economic%20and%20Fiscal%20Outlook.pdf It should be stressed, however, that these figures are the department's and not the CSO's."

Now, here are two forecasts for Ireland's Current Account known to me, sourced from the updated IMF database (July 2012 update to WEO database) and the above link from the Department of Finance:


Clearly, no source, bar IMF projects anything beyond 2015. Also, clearly, even the IMF projections appear (one can't really properly read IDA chart) to be as 'upbeat' as IDA's chart in 2013-2017 projections range. 

But wait, recall that IMF is providing a forecast, based on their central tendency scenario. They also provide useful assumptions and data that went into their scenarios assessments which allow us to compute historical confidence intervals for their own forecast. And, ahem, it turns out the IMF 'central' tendency forecast - illustrated above - firmly falls outside the reasonable 90% single tail confidence interval (adjusting for sample size, but caveating this). In other words, it is improbable, were historical Irish performance on current account balance to be out guide. The same applies to the stress-testing metric on current accounts used by the IMF - the primary current account balances (current account ex-interest payments).

So the IMF forecasts above assume massive change in Irish current account performance relative to history, the change that - may be IDA can expand on this - is supposed to come in the environment of adverse global trading conditions, pharma cliff hitting Irish exports, and re-orientation of trade flows worldwide away from North-South shipments of higher value added goods and services toward South-South flows.

But wait, things are actually worse than that. DofF forecasts deviate from the average for the above sources ex-DofF by a cumulative 1.7% of GDP and from those by the IMF by a cumulative of 2.5% of GDP for the period 2011-2015, which means that DofF forecasts are even less probabilistically likely to materialise than those for the IMF.

Even were the IMF to materialise, Ireland's current account surplus in 2012-2017 will be 2.78% of GDP on average - an impressive swing from a recent historical performance, yet contrasted by the economy with ca 120% debt/GDP metric on Government side alone! Anyone out there really thinking this is going to be a silver bullet for our economy?

So things are a bit less rosy than the IDA seems willing to admit to the prospective Foreign Direct Investors and the media. 

Thursday, August 16, 2012

16/8/2012: €1.05 trillion bad loans + €2-2.5 trillion deleveraging problems


I twitted about the PWC stats on non-performing loans based on German newspaper report earlier today, and here's WSJ article on same. Frightening numbers.

16/8/2012: Italy's 'this time, it's different' moment


This time it's different for Italy now... according to an excellent article by Charles Wyplosz here. Read the whole thing, Wyplosz is excellent on the basics of the Italian situation.

Update: new link to the article.

16/8/2012: Financial Repression - Round 2


Financial repression continues to gain speed in Ireland: link here.

Basic idea: having raided actual pensions funds, the Irish Government is to issue special annuities (priced accordingly to reflect State's 'grudging acceptance' for now of the pensions tax break) for insurance and pensions providers.

The good part of the idea is, as Fitch points in the note, added funding stream for the Government.

The bad parts are, as Fitch does not bother to note:

  • Deleveraging economy means that funds will be taken out of the already diminished private investment stream, should the annuities be successful in raising such funds;
  • Risks of claims exposure to Ireland for Ireland-based providers will now be amplified by more assets tied to Ireland (de-diversification);
  • The new funding is debt, priced more expensively than what we can avail of from the Troika programme and subsequently from the ESM (at least access to and the cheapness of the ESM funds was the Government-own rationale for convincing the voters to back the Fiscal Compact earlier this year - something that the rating agencies have confirmed, as I recall);
  • The new funding is still debt, which means that the new 'source' is not going to help restoring Irish public finances to sustainability path;
  • Payments on these annuities will be subject to the same seepage out to imports (consumption of recipient households) as any other income and thus will have lower impact on our GDP, and an even worse impact on our GNP, than were the annuities structured using foreign governments' bonds;
  • Share of the Irish state liabilities held by domestic investors will rise, which automatically implies riskier profile for both: Exchequer future funding and pensions;
  • The latter (pensions funding risk profile deterioration) will also induce higher expected value of future unfunded liabilities (basically, as risk of pensions funding rises, probability of claims on state in the future to fund public pensions rises as well), and so on.
But, hey, why would the Irish State bother with any of these concerns when they've found another quick fix to €3-5 billion of our cash?

And on a more macro level, financial repression is back on the EU agenda too. The latest spike in French rhetoric about the need for 'own-funding' of the EU operations (link here) is just that, have no doubt. The idea is to give EU some central taxation powers so, as claim goes, it reduces the 'burden' on national governments. So far so good? Not exactly. Neither the French, nor any other Government in Europe at this stage is planning to 'rebate' (or reduce) internal tax burdens to compensate for EU new tax burden. In other words, the Governments ill simply pocket the 'savings'. Which, to put it simply, means the new 'powers' will simply be new taxes for the already heavily over-taxed and recession-weakened economies of Europe.

All in the name of deleveraging the State at the expense of the real economy. And that is exactly what the financial repression is all about.

Updated: And just in case we need more 'creative' thinking, here's an example of financial suppression: It turns out Nama (Irish State Bad Bank - don't argue that SPV thingy, please) should use public purse to suppress normal price discovery processes in Irish property markets. Right... you really can't make this up. Irish elites are now so desperate for relevance, they are fishing that Confidence Genie anytime anyone is feigning some attention to what they have to say.

Wednesday, August 15, 2012

15/8/2012: Total Insolvency in Greece Meets Total Denial in Europe


And so as predicted here back in February, Greece is now in a complete meltdown when it comes to fiscal targets (report here). The only thing that is keeping this Euro charade still rolling is seemingly endless willingness of the European 'leaders' to deny the reality of Greek complete and total insolvency.

Monday, August 13, 2012

13/8/2012: Telling tales about our 'Productivity'?


IDA recently used the following chart in the context of Irish competitiveness comparatives to the rest of EEC:

According to the above, Irish labour productivity per person employed is at 136.9% of the EU27 average, which makes us the second most productive economy in the Euro Area and the third most productive in the EEC. Of course, the thing that jumps out in the chart is the massive over-performance in output terms by two other 'special' countries: Luxembourg and Norway. This should ring lots of alarm bells when it comes to trusting the above data to base actual comparative assessments on.

It turns out that adjusting our productivity performance for GDP/GNP gap so as to remove the portion of our output that has absolutely no anchoring in Ireland (net after-tax factor payments to foreign investors) implies Irish productivity index at around 102-106% of the EU27 average, placing us below-to-just-above Germany and ahead of Greece.

I wouldn't argue that that is indeed where we are positioned, but rather that the chart used by IDA is simply reflective of vastly over-inflated real productivity of our workforce, just as it is for Norway (petro-dollars economy) and Lux (an economy with massively undercounted non-resident workforce and an industrial scale 'dry cleaning laundry' for European, EEC & Eastern European corporates).

13/8/2012: National Competitiveness: Not Exactly Good Numbers for Ireland


An interesting paper, THE DETERMINANTS OF NATIONAL COMPETITIVENESS by Mercedes Delgado, Christian Ketels, Michael E. Porter and Scott Stern (NBER Working Paper 18249) looked at three broad and interrelated drivers of foundational competitiveness:

  • social infrastructure and political institutions (SIPI),
  • monetary and fiscal policy (MFP), and 
  • the microeconomic environment. 

The study defined foundational competitiveness as "the expected level of output per working-age individual that is supported by the overall quality of a country as a place to do business".  The paper focused on output per potential worker, which is "a broader measure of national productivity than output per current worker". This "reflects the dual role of workforce participation and output per worker in determining a nation’s standard of living".


Using data "covering more than 130 countries over the 2001-2008 period", the authors found "a positive and separate influence of each driver on output per potential worker". Specifically, "we find significant evidence for the positive and separate influence of SIPI, MFP, and the microeconomic conditions on national competitiveness":

  • Consistent with prior studies, institutions (SIPI) positively influence national output per potential worker;
  • However, microeconomic conditions have a strong positive impact as well, even after controlling for current institutional conditions;
  • Microeconomic conditions have a positive influence on competitiveness even after controlling for historical institutional conditions and incorporating country fixed effects (which offer a broader measure of a country’s unobserved legacy);
  • Current institutions and macroeconomic policies "seem largely endogenous to historical legacies";
  • "Overall, the findings strongly suggest that contemporaneous public and private choices, especially those that relate to microeconomic competitiveness, are an important driver of country output per potential worker and, ultimately, prosperity".


The paper also defined a new concept, global investment attractiveness, "which is the cost of factor inputs relative to a country’s competitiveness".

Using the new metric, the authors rank the countries with respect to their global investment competitiveness:

The unpleasant bit is that in 2010, a year after we began the process of 'competitiveness improvements' that has stalled since around mid 2011, we were ranked just 24th. The pleasant bit... we still made it into top 25.

And in terms of other comparatives, here are few charts:


Oh, the naughty, naughty authors did get some things right: "In the case of Ireland, we used GNP instead of GDP because of the size of dividend outflows to foreign investors".

And here's what they had to say in terms of their analysis of the Global Investment Attractiveness scores (GIA): "Countries with high GIA tend to experience a strong positive growth, including China and India (with growth rates above 8% and 4%, respectively).  In contrast, countries with low GIA tend to experience a high contraction in output with growth rates below the median value, including Italy, Spain, Ireland, and Venezuela, among others."

Now, wait, is that really the neighborhood we (Ireland) are in? You wouldn't think so from our policymakers/IDA/EI/Forfas/ESRI/CBofI/... statements.

13/8/2012: Euro area ABS markets


Here's a good post on what is happening in the European Asset Backed Securities markets: link.

So much for the hopes of a short-term credit demand & supply recovery... 

Friday, August 10, 2012

10/8/2012: What's driving trade surpluses in Ireland?


Here's a question I asked myself recently: Given Irish exports are so heavily dominated by the MNCs, and given that the MNCs operating from Ireland are primarily concerned with transfer pricing and tax optimization (entering as negative factor to our overall trade), does our exports growth (positive contribution to our trade balance) really determine change in our trade balance?

It's a cheeky question. You see - Government policy in effect says "To hell with domestic enterprises, let's put all our bet for a recovery on exports". And furthermore, the policy also says that "Ireland will remain solvent as long as we can generate growth in our external surpluses". Of course both of these strategic choices imply state reliance on MNCs to increase our external balances surpluses, i.e. trade surplus.

So here are two charts (caveat to first chart - obviously estimated relationships are just illustrative, rather than conclusive, since we have few observations to consider as consistent data from CSO covers only 1997-2011 annually, but strangely enough the quarterly data - not suffering from same limitations - confirms annual data results):


The conclusions are rather interesting and worth much deeper exploration:

  • Imports growth explains more of the variation in trade surplus growth than exports expansion
  • Exports growth explains negligible amount of variation in trade surplus growth
  • Growth in profits repatriation by MNCs out of Ireland relates stronger (almost 27 times more) to  trade surplus growth than either imports or exports.

So more questions should be raised than answers given in the end...

Thursday, August 9, 2012

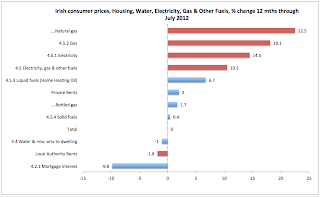
9/8/2012: Rip-off Ireland roars again in July

Latest consumer price indices are out for Ireland. Headline number for annual comparatives is moderate inflation at 2.0% in HICP metric and 1.6% on CPI metric. M/m we have deflation.

Alas, the headlines do not tell the whole story. Much is revealed in the following three charts which, in summary, show that most of inflation, including double-digit rampant inflation, is concentrated in state-controlled or state-set prices (marked in red).


You can see that even when it comes to energy, state-controlled prices (e.g. electricity and natural gas) are ahead of inflation driven by virtually identical underlying oil and gas prices (other hydrocarbons-linked fuels).

The above, of course is consistent with the State policies that have prioritized extraction of rents from the private economy in order to close fiscal gap. The State is doing this even though Irish Government is aware that we face a deleveraging crisis among our households and companies. In other words, prioritization of the policy is clear - skin consumers to save the Exchequer and to hell with households barely capable of making ends meet.

Don't think that this is not a prescription for an economic disaster. Killing off private economy to sustain public sector's lack of real reforms as well as to sustain exceptionally costly measures to underwrite Irish financial sector meltdown is not a good thing to do. But, hey, 'international investors' seem to approve.

Wednesday, August 8, 2012

8/8/2012: Updating 2012-2017 forecasts for Russia

Updating my outlook for Russian economy:

First a table summarizing my outlook and IMF forecasts for key macro variables (note: IMF forecasts are as of July 2012, updating WEO database from April 2012).

Second, two significant trends that will dominate Russian macroeconomic themes in near- and medium-term future:


Both charts above are based on IMF data and projections.

The key to both is understanding that the underlying capital dynamics suggest strong capital investment contribution to the GDP and that much of this will be driven by the private sector. This implies strong growth potential in core capital equipment, construction and manufacturing sectors.

However, my estimates of public investment are above those for the IMF, based on two factors:

  1. Last Presidential elections have been dominated by the rhetoric concerning modernization and re-structuring of key Russian sectors and the economy overall. Coupled with accelerating depreciation of infrastructure stocks, this suggests elevated public investment in years to come.
  2. Recent portests against the Government have clearly been met with a complex response that includes strong recognition by Moscow that accelerated development of the quality-of-life infrastructure and structural reforms in the economy cannot be postponed. This too suggests that the Federal authorities will likely accelerate public investment.
As the result, my projections for private investment remain in-line with those by the IMF, but public investment projections are likely to be ahead of those by the IMF by some 1-1.5% per annum in 2013-2014, rising to 2% over IMF forecast post-2015.