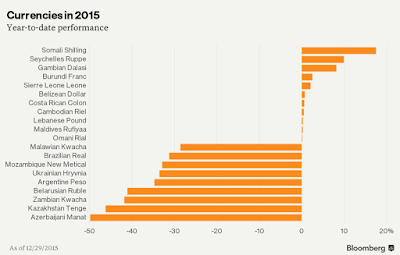
Two charts from Pictet neatly illustrate the ongoing bonds markets correction:
My two cents on what's going on in the markets today:
Wednesday opening last week at the cusp of FOMC statements, US 10 years were yielding ca 2.15%. and 4 trading days later, these were at 2.61% or 41 bps up. 30 years are up from the nadir of 2.83% on may 2 to 3.56% currently.
And what about the other QE-infused or enthused market? In just over 3 weeks, FTSE 100 is down 846 points, from 6,875 on 22 May.
Equities and bonds are moving same way? Why?
Because of three factors:
1) When bonds go down, with them goes down capital. Mandated investment vehicles and banks take a bit of a shower.
2) When US or other advanced economies bonds take a shower, Emerging Markets take a bath because of liquidity pull out to cover leveraged losses elsewhere.
3) When EMs and bonds tank, capital-backed leverage falls, so liquidity falls in the advanced markets too, dragging down all risk assets.
These are the tripartite consequences of a liquidity trap, whereby intermediated short-term funding underpins investment activities. Put differently, when humans have less cash (real economy slow recovery, coupled with tax and financial repression), while banks and other institutions have more cash (including, for the latter, via access to banks leverage against Central Banks funding), markets become correlated, even where hedges existed before, correlations turn positive. Where there is contrasting access to the same asset via both financial paper and physical or real assets (e.g. gold vs gold coins), the two diverge, with financialised asset moving in synch with other financial assets, while real/physical asset moving in the opposite direction.
Thus, Brazil's 30-year bonds (dollar-denominated) are down now more than 25% in recent weeks, and instead of flowing into safe havens or rather 'safer hells', the cash is being tucked away into reduced leverage, leading to the US bonds compression down and UK gilts erasing all gains made since October 2011 (when QE2 kicked in).
The only thing that behaves predictably so far is VIX, which has gone from low-flat around 13.6-14.0 between March 24th and May 24th to over 20 average since June 20th through today. Short term VXX index is up from 18.03 on May 17th to 22.81 today.
Not quite panic, but pressure… and pressure is a trigger. And FOMC, and the rest of the Impossible Monetary Dilemma, are triggers too. The point is, given the recent drama in bond markets and equities and EMs, triggers are dangerous in trigger-happy times. When you have lots of capital tied up in 'safe assets' and lots of leverage tied up on top of that capital, pulling the rug from underneath capital quality leads to accelerating cascades across the board.
This is bad news for strategies over the short-term, as traditional allocations based on previously stable relations between asset classes are broken down. Gold co-moves with equities and bonds and currencies. The good news: once financialisation of the long positions is unwound, leverage is reduced and repricing of 'bubble'-like assets (aka financialised assets as opposed to real assets) is finished, the stable relations will return. In the long run, we all are… well, in the long run.


