Showing posts with label #COVIDRussia. Show all posts

Sunday, August 23, 2020

23/8/20: COVID19 Update: Worldwide Cases and Deaths


Updating latest data for COVID19 pandemic - comments in charts

New cases and deaths: daily counts


Key trends in thee above:

  • Global number of daily new cases was on an upward trend through July 2020. Since the start of August, however, new daily cases additions have been flat at the levels close to the prior peak trend (< 260,000 per day).
  • In the last 30 days, average number of new cases stood at 258,816, with the current 7-days average at 252,383.
  • Week-to-date, daily case numbers ranked within top 10 in 1 day, and in 11-25th place in 4 days. 
  • Overall, there are some indications in the more recent data that the trend in new cases will likely moderate toward 220-225,000 per day in the next 7-10 days. Such a moderation will not, in itself, be sufficient to mark the end of the first wave of the pandemic.
  • Death rates have peaked in mid-April, but the extent of subsequent declines is largely artificially contrasted to past higher rates, due to: 
  1. Delayed reporting, especially in April, primarily in Europe (nursing homes deaths);
  2. Lags between new cases arrivals and deaths;
  3. Shift in new cases to younger demographics; 
  4. Improved detection/testing;
  5. Shift in the pandemic intensity toward countries with different reporting methodologies.

  • In July, average growth in death cases was +5.79%. August-to-date, the average is -2.66%. Last 7 days average is -4.42%. 
  • However, deaths are still running at high rates. 30-days average is 5,882 deaths per day and 7-days average is 5,663 deaths.

Trend growth rates:

  • New daily cases growth rates are moderating. July average daily growth rate in new cases was 10.35%. This fell to 0.65% in August (to-date).
  • In July, average growth in death cases was +5.79%. August-to-date, the average is -2.66%. Last 7 days average is -4.42%. 

Two summary tables of stats: G7+ and BRIICS:


Recent divergence in deaths counts dynamics from the new case counts dynamics can be indicative  of:

1. Improving rates of detection (earlier detection) of cases 

2. Learning from treating COVID19 patients 

3. The pandemic working through a decreasing density of older population impacted by the disease (due to increasing numbers of detections amongst younger patients)

4. Younger demographics of the new geographical concentrations of COVID19, and

5. Differences in cases and deaths recordings from the early stage of the pandemic (countries with deaths recorded on a primary cause basis, as opposed to COVID19 attribution in the presence of virus).


Tuesday, August 18, 2020

18/8/20: COVID19 Update: Worldwide Cases and Deaths


Updating World counts and major cases through August 18, 2020 (ECDC timing):


First, top countries by case numbers (> 25,000 total cases) (color coding legend in the second part of the table):


Next, dynamics of new cases:

Some moderation in new cases growth rate (7-day average trend is flat, with early signs of possible reversal downward after months of increases).

And dynamics of daily deaths counts:

Hopefully, the gentle drop in the trend (14 days moving average) is going to be sustained from here on.


Wednesday, August 5, 2020

4/8/20: COVID19 Update: Worldwide Cases and Deaths


Global deaths and case counts charts through ECDC data as of 4/07/2020:


Summary of the above:
  • Some improved dynamics in death counts since July 31, 2020 indicate potential moderation in COVID19 deaths going forward.
  • Notably, we are still in the first wave of COVID19 deaths, which suggests that any moderation in daily deaths counts in August-September is subject to risk of re-acceleration later on in the Fall.
  • No significant signs of improvements in daily new cases counts, supporting cautionary interpretation of the current death counts moderation,
The world is clearly not out of the woods yet on the first wave of the pandemic.

Summary tables for countries with > 25,000 cases:


Note: countries with more than 500,000 cases are highlighted in red.

Wednesday, July 29, 2020

29/7/20: COVID19 Update: Russia and BRIICS


An infrequent update on Russia COVID19 stats:

Daily Cases and Deaths:


Russia is failing to arrest the new cases curve and the deaths curve, with both series running at elevated levels through July. Thee decline in new cases around the end of June was also associated with a drop in daily deaths. Since the opening up of the restrictions in advance of the July referendum vote, Russian COVID19 cases and deaths have shown disruption in the prior positive trends. Last 7-days average new cases are running at 5,741, which is statistically indistinguishable from the prior 7-days average of 6,197. Similarly, current 7-days average of 132 is materially indistinguishable from the prior 7-days average of 138.

I noted in late June that Russia is rushing into relaxation of restrictions and this is a mis-guided policy decision that seem to have nothing to do with the pandemic dynamics. It appears that my analysis was correct.

Mortality Rates: 

Russian mortality rates are rising, and are now firmly close to the average of the BRIICS economies:


Amongst all countries with more than 25,000 cases (58 countries & EU27), currently, Russia ranks

  • 22nd highest by the number of COVID19 cases per capita
  • 32nd highest by the number of deaths per capita of population
  • 44th highest by the mortality rate (deaths per 1,000 COVID19 cases)
  • Cumulatively, across all three categories of metrics, Russia scores within the 95% confidence interval for the mean score for the group of 58 countries and the EU27.

Monday, July 13, 2020

13/7/20: COVID19 Update: Russia


Russia continues to report slowly declining numbers of new cases, while official death rates are trending up:


The above numbers confirm what I have been saying for some time now: relaxation of constraints in advance of the constitutional referendum vote was too fast, too early to achieve a meaningful control over the pandemic numbers.

One controversial statistic reported by the Russian authorities is the death rates (see more on this here: https://trueeconomics.blogspot.com/2020/07/30620-covid19-update-russia.html). Russian reported mortality rates have finally rose to the levels within the 95% confidence interval of the mean for BRIICS economies:


Tuesday, July 7, 2020

6/7/20: Updated: 2Q 2020 Composite and Services PMIs for BRICs


As promised earlier (https://trueeconomics.blogspot.com/2020/07/3720-services-composite-pmis-q2-2020.html), here are the BRIC Services and Composite PMIs for 2Q 2020 with updated Global PMIs. Note: my charts show quarterly PMIs, derived from the Markit's monthly data.

Services sectors:

As the above shows, 2Q 2020, Services sector growth in India and Russia lagged Global sector activity.

Manufacturing:

India, Russia and Brazil manufacturing sector activity lagged Global activity in 2Q 2020. The same three BRIC economies also lagged Global Composite PMI development:


Per Markit release, here are the main developments in Global PMIs on monthly basis:


Manufacturing Index Summary:


There are robust forward expectations in all sectors of the Global PMIs, per above. Input prices are rising, but output prices continue to contract, albeit at shallower rates. Employment is still falling in both sectors. New business is still contracting, albeit at a slower rate, with exports declining sharper than domestic orders.


Overall, the numbers are still indicating ongoing contraction through June for BRICs and for the Global economy.

Looking at monthly PMIs, China and Brazil posted above 50.0 readings in June for Manufacturing, and China also posted a highly robust growth signal for Services. Brazil posted deeply contractionary June Services PMI reading, while Russia shows contraction ongoing (but at a shallower rate than in May) in both sectors. India posted continued decline in Manufacturing and a sharp continued contraction in Services. These numbers put a question mark over the prospect for a V-shaped recovery. April 2020 marks the trough of PMIs-signalled growth in the BRICs. We now have second month in a row of rising PMIs readings, but the indices are still below 50 line. On a quarterly basis, however, 1Q 2020 marks the BRICs recession in terms of PMIs signals (Composite country indices), with 2Q 2020 posting shallower rates of decline compounding 1Q 2020 drops.

Friday, July 3, 2020

3/7/20: Services & Composite PMIs Q2 2020: BRIC


Note: charts below are not updated for full 2Q 2020 data on Global Services and Composite PMIs, which are yet to be reported for June and thus cover April-May period only. I will update these later.

Starting with Services sector activity:


BRIC Services index fell from a deeply recessionary 44.9 reading for 1Q 2020 to 40.9 in 2Q 2020, signalling accelerated rate of contraction in the sector across the four emerging markets economies. 1Q 2020 is now the second lowest quarter of index performance on the record, with 2Q 2020 coming in as the worst quarter on the record.

China was the strongest performer, with 2Q 2020 index at 52.6, four quarters high, and statistically in a relatively robust growth territory. Historically, this reading is consistent with GDP growth of 4-4.5 percent.

Russia recorded the second strongest reading, albeit at sharply recessionary 32.0 in 2Q 2020, down from the already recessionary 47.7 in 1Q 2020. 2Q 2020 is the lowest reading on record for Russian Services sectors. So being second wins no prizes.

Brazil Services PMI fell from a sharply recessionary 45.9 in 1Q 2020 to an even more depressing 30.3 in 2Q 2020. Needless to say, 2Q 2020 is the worst reading in Brazil Services PMI history.

India Services PMI has been signalling an outright collapse of economic activity in 2Q 2020, having fallen to 17.2 against 1Q 2020 reading of 54.1. The economy is literally paralysed.

In the entire history of BRICs PMIs, there has been only one other instance of two consecutive sub-50 readings - in 4Q 2008 and 1Q 2009, when the two-quarters average of the index was 47.7. Current index reading has !Q-2Q 2020 average of 42.6.

Given the above and the Manufacturing PMIs (covered here: https://trueeconomics.blogspot.com/2020/07/1720-manufacturing-pmis-q2-2020-bric.html), BRICs Composite Indices (note: I am using Markit data and relative GDP weights for each economy) have been woeful as well.


Brazil Composite average for 1Q 2020 was at 46.9. This fell to 31.8 in 2Q 2020. A recession in 1Q 2020 has accelerated dramatically into 2Q 2020 across all sectors of the economy.

Russia Composite average in 2Q 2020 was at 32.6, marginally better than that of Brazil, and well below already-recessionary reading of 47.7 in 1Q 2020. This, too, signals accelerating collapse of the economy.

India Composite index was in the expansionary territory at 54.8 in 1Q 2020 and it fell to an abysmally low 19.9 in 2Q 2020, indicating that the country economy came to a standstill in April-June. This is the lowest Composite index reading on record for any BRIC economy.

China Composite index fell from 52.6 in 4Q 2019 to a contractionary 42.0 in 1Q 2020, before recovering back to 52.6 in 2Q 2020. If treated symmetrically, this means that the Chinese economy did not fully recover to pre-crisis growth rates in 2Q 2020, but has made some progress on the path to recovery. There are multiple caveats that apply to this analysis, however, so treat it as purely directionally-indicative, as opposed to a measure of actual magnitudes.

As noted earlier, I will update these charts in subsequent posts, once we have Global PMIs reproted.

Wednesday, July 1, 2020

1/7/20: COVID19 Update: Three Charts on COVID19 Developments in Major Emerging Markets


Via Danske Bank Research, three really neat sets of visualizations for abating COVID19 crisis dynamics in major emerging markets:


Note: the number of tests per capita in Russia is in part explaining the lower death rates from COVID19 there. Russia runs earlier testing and interventions, leading to longer stays in hospitals, higher hospitalization rates with lower ICU use rates, allowing for earlier interventions. However, Russia also produces death statistics for COVID19 that are different in methodology to the EU27 standards. Specifically, Russia claims to carry out more autopsies in cases of all deaths, allowing it to attribute deaths to primary causes, e.g. cardiac failures, that may have COVID19 as underlying trigger.

1/7/20: Manufacturing PMIs Q2 2020: BRIC


BRIC economies reported their June manufacturing PMIs, so we can update Q2 2020 data. Here is the chart:


Despite improving PMIs in all BRIC economies through June 2020, quarterly readings remains deeply recessionary in all BRICs except for China.

  • Brazil Manufacturing PMI averaged 40.6 in 2Q 2020 down from 1Q reading of 50.6. Brazil Manufacturing sector growth was slowing down from the start of 4Q 2019 and was showing anaemic growth (statistically, zero growth) in 1Q 2020 before COVID19 restrictions kicked in. June 2020 monthly reading rose, however, to 51.6 - signalling pretty robust growth on a monthly basis for the first time since the end of February. Some good news, but not enough to lift 2Q 2020 average above 50.0 mark.
  • Russia Manufacturing PMI remains below 50.0 in June, as it did consecutively since the end of April 2019. This marks 14 months of continued contraction, only accelerated by COVID19. Quarterly PMI for 2Q 2020 is deep under water at 39.0 - the worst reading in history, matching that of the lows of the 2009 recession in 1Q 2009. June monthly uptick to 49.4 is still leaving Russian Manufacturing index below zero growth mark of 50.0. 
  • India Manufacturing PMI rose from 30.8 in May to 47.2 in June 2020, but remains well below zero growth line. Quarterly index is now at 35.1 for 2Q 2020, which is an all-time low. 
  • China Manufacturing PMI was the only BRIC index to reach into positive growth territory in 2Q 2020, at 50.4. Statistically, this reading is indifferent from zero growth conditions in the sector, however. 
Overall, GDP-shares weighted BRIC Manufacturing index is at 45.0 in 2Q 2020, down from 49.1 in 1Q 2020. Not as bad as 4Q 2008 - 1Q 2009 readings of 43.1 and 43.7, respectively, but bad. Still, BRICs as a group managed to sustain less manufacturing decline than the Global Manufacturing index which collapsed to 43.6 in 2Q 2020 from 48.4 in 1Q 2020.

30/6/20: COVID19 Update: Russia


Russia is going to the voting booths and the country is - by a mile - nowhere near being ready to relax COVID19 restrictions. This is risking tragic consequences in the near future.

Cases and deaths are still high. For deaths, this holds even if we do not correct for Russian reported death rates, influenced by hell knows what - different methodology (yes), shoddy local reporting (may be), lags in reporting (probably), Kremlin conspiracy (probably not, but who knows) and so on.


Correcting Russian data on reported deaths is hard, primarily (in my opinion, due to different methodologies in reporting - link below). At the upper tail end of the arguments for adjustment (https://www.themoscowtimes.com/2020/06/10/moscow-sees-58-mortality-spike-in-may-as-russias-low-virus-deaths-questioned-a70532 and https://www.theguardian.com/world/2020/jun/04/st-petersburg-death-tally-casts-doubt-on-russian-coronavirus-figures) we have Moscow and St Petersburg cases in May (peak contagion and deaths growth month in the most severely impacted region in Russia with massive population density). So ca 60% estimate for understatement in Moscow most likely runs at around 45 percent for Russia as a whole. Which would roughly be in line with my model.


Notice, even with adjustment (which yields mortality to-date 44% higher than reported), Russia death rate from COVID19 remains relatively low (see comparatives to BRIICS below).


Key takeaway: Russia is not ready to relax COVID19 restrictions beyond modest local restrictions easing. The country is most certainly not ready for allowing in-person voting.

Sunday, June 28, 2020

28/6/20: COVID19 Update: Top 50 Countries


Here are summary tables of stats for COVID19 pandemic for top 50 countries by cumulative number of cases, plus EU27:

First a 'heat map' legend.


Friday, June 26, 2020

25/6/20: COVID19 Update: Global Pandemic Rates


Summary of global, G7, and BRIICS case and deaths counts and rates:


25/6/20: COVID19 Update: World Cases and Deaths


As explained in the charts: although geography of cases and deaths continues to shift to Latina America and Africa, Western nations are starting see pockets of increased cases. This is happening during the summer season in the Northern Hemisphere, making current increases more worrying.


The pandemic has not gone away. And any 'normalization' in these circumstances must be taken with extreme caution. Which is, currently, being abandoned more than adhered to.

Saturday, June 20, 2020

20/6/20: Russia COVID19 Update: Too Early For Going Back To Normal


Russia is taking a page from the U.S. book on 'How Not to Do Pandemics' entering a major restrictions relaxation stage too early:


New cases numbers are running slightly (statistically not significantly) below the trend, but are still trending at an alarming rate (chart above). In the week through 20/06/2020, Russia averaged 8,234 new cases per day which is only slightly below 8,798 average for the week through 13/06/2020. 7 day average for deaths at 179.6 in the week through 20/06/2020 is above the same for the 7 days through 13/06/2020 that stands at 169.6.

Both, actual and adjusted death rates per official case are still moving up:


In simple terms, Russia is not ready to go to a more relaxed restrictions regime, yet.

20/6/20: World COVID Data Update: The Theory of Back to Normal


Relaxation of the Covid19 pandemic restrictions is gaining momentum worldwide, with clusters of renewed concerns over the 'second peak' or 'second wave' dynamics. The problem is that global pandemic numbers remain extremely worrying:

Total new cases are hitting all-time highs:


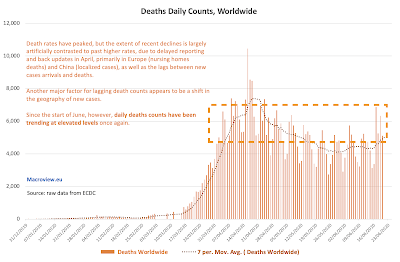
The orange box represents, roughly, the range of earlier data that triggered the lockdowns. It is clear that worldwide numbers are sustainably above that range. The 7-day running average is horrific and trending up at an accelerating rate. The slope of the current 7-day moving average is now similar to what we observed in the peak period of contagion in Europe.

Total daily deaths are also on the rise, once again:


Once again, the orange box related current deaths to the European lockdowns initiation deaths. The 7-day moving average is on the rise, once again.

Yes, on per-capita basis, the pandemic has moderated, primarily due to different geographies of concentration of new cases and new deaths. However, European lockdowns periods coincided with more robust testing in Europe and in advanced economies in Asia, while current period of globally spiking cases and rising deaths is coincident with less robust public health systems in less developed countries, implying that current numbers are most likely coming from much larger underestimates of actual cases and deaths.

Friday, June 12, 2020

12/6/20: Russia COVID19 Update


Updating data for Russia on cases and deaths:


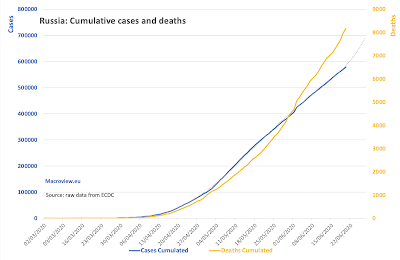
Russian cases trends remain uncomfortably high and showing no indication of a significant moderation. In the last seven days, new case counts cumulatively fell from 70,920 in the period through 05/06/2020 to 61,328 in the period of the seven days through 12/06/2020. Note: I am using ECDC data based on European time of reporting. While notionally, this shows a decline in the number of new cases reported over the seven days period, this decline is not significant enough to herald abatement of the pandemic pressures, nor is it sustained over the longer period of time, yet. 

Omitting the aberrational outlier in the new cases reported on 02/06/2020, current daily new cases counts are very narrowly in line with the daily counts reported starting from May 17, 2020.

In other words, daily cases data does not support a proposition that Russia should be lifting pandemic containment measures at this time.

Death counts are also relatively stable, and once again omitting the reporting outlier on 02/06/2020, Russia's death counts on the daily basis continue to run within the range that has been established since 21/05/2020. 

Here the death rates (adjusted and unadjusted) for per-1,000 cases basis:


Russia continues to report lower per-case death rates than BRIICS peers. In fact, amongst the countries with more than 10,000 cases recorded (50 countries with the highest case numbers), Russia's current death per 1,000 cases rate ranks 44th, with just 6 other countries reporting lower rate. In contrast, Russia ranks 19th highest in the group in the number of cases per 1 million population, and 28th highest in death rate per 1 million population. Interestingly, on the combined ranks measure across three metrics, Russia is statistically 'average' within the group of 50 countries heaviest hit by the pandemic. The same stands for the median (given that data is severely non-Gaussian, we have to consider both, and more).