Sunday, May 17, 2015

17/5/15: Irish Merchandise Trade: 1Q 2015


Irish trade in goods statistics - the ones responsible for the tax-induced economic dizziness in the National Accounts over 2014 - are back at posting more absurd numbers.

Take a look at data through March 2015:

  • 1Q 2015 imports of goods stood at EUR14,819 million which represents an increase of 10.5% y/y and 18.6% cumulative rise over the last two years. Relative to 2000-2007 period average, Irish imports of goods are up 3.8%. These are pretty large numbers, even allowing for currency valuations. 
  • 1Q 2015 exports of goods from Ireland stood at EUR24,957.6 million, which represents an increase of 17.4% y/y. Yep, apparently Irish exports outputs are growing at a rate that implies doubling of the entire export capacity every 4 years, plus a month or so. No, seriously, folks - at this rate of building manufacturing facilities and logistics parks to accommodate all this stupendous growth, there won't be any cranes and construction crews left in the entire UK and probably none in France either. All would have been busy adding new land to Ireland.
  • Now, we can compute % change in exports per 1% change in imports as the latter are often inputs into production of the former. Even recognising that imports of goods are also growing on foot of improving domestic demand, current exports elasticity with respect to imports is the third largest - lagging behind only two out the last 25 years: 1992 and 2004. What happened back in 1992? Ah, yes, new FDI in ICT manufacturing sector pushed Irish exports by 16% y/y in one year off a low base. It took couple of years thereafter for imports to catch up with this tremendous 'value creation' by stuffing computers and software disks into boxes. And in 2004? Well, that arrived on foot of abysmal 2003, when exports sunk and trade surplus went into largest y/y decline on record. So here we have it: the miracle of Irish exports growth: more of 1992 (tax arbitrage) and less 2004 (post collapse bounce).


Now, take a look at some dizzying numbers for March:


As the above shows, March marked the third highest value of goods exports for any month on record. Year on year, imports of goods were up 14.21% in March after posting 12.08% growth in February. Meanwhile, exports of goods rose 20.85% y/y in March after posting 16.92% growth in February. Trade balance rose 32.61% y/y in March having grown 24.21% in February.

Put frankly, even Google's big data analysts would struggle connecting these numbers to any tangible reality.

Chart below shows shorter range for dynamics.


16/5/15: Russian Trade in Goods: 1Q 2015


Per BOFIT latest data, exports of Russian gas were down 10% y/y in 2014 with total of 175bn cubic meters (bcm) of gas exported. exports to Ukraine were down 44% to 15bcm, to Europe and Turkey down 9% to 126bcm. Russian LNG exports stood at around 14bcm in 2014, virtually unchanged on 2013.

Meanwhile, the latest figures for external trade, covering 1Q 2015 show exports of goods down 28% y/y (predominantly due to price effects - ruble devaluation and lower prices charged). Volume of exports actually rose across several categories, including crude oil (+13% y/y in volume), petroleum products (+24% y/y in volume), as well as exports of copper, fertilisers and grain. Share of oil and gas in overall exports remained largely unchanged at around 2/3rds.

Biggest volume of exports went to the EU, as usual, although value of exports shipped to the EU fell by roughly 1/3rd. Overall, EU received about 1.2 of Russian goods exports with APEC taking 20%.

On imports side, the opposite holds: APEC became the largest supplier of goods to the Russian market as imports from the EU dropped 44% y/y in 1Q 2015 more sharply than the overall imports decline of 37% y/y. Imports from China fell by 1/3rd, but China remained the largest single supplier to the Russian markets with 20% share of overall Russian imports of goods.

Ireland's bilateral trade in goods with Russia also suffered in 1Q 2015. Per latest CSO data, released this week, Irish merchandise exports to Russia totalled EUR78mln in 1Q 2015 against EUR157mln in 1Q 2014 - a 50% drop y/y. Irish merchandise imports from Russia totalled EUR52mln over the 1Q 2015, down only 1.6% y/y. As the result, trade balance (merchandise trade only) has deteriorated significantly: in 1Q 2015, Irish trade surplus vis-a-vis Russia stood at EUR104mln, this has now declined to EUR26mln (a drop of 75% y/y).

It is worth noting that in 2008-2009, Irish merchandise exports to Russia declined 30% y/y over 1Q-4Q period.

Friday, May 15, 2015

15/5/15: Irish Construction PMI: April Stronger PMI, but Overall Activity is Weak


Irish Construction Sector PMI for April was released by Markit earlier this week. Here are the main points:

Overall Activity Index in Irish construction rose to 57.2 in April from 52.9 in March, bringing index back to the levels of January 2015. Current 3mo average is at 54.0 against 3mo average through January 2015 at 61.2, showing a clear slowdown in activity growth over most recent three months.


All three components of the index posted increases in April, with Civil engineering Activity index reaching above 50 marker (to read 51.0) for the first time since January 2015.


It is worth noting that Construction Sector PMIs have been pretty much out of touch with actual construction sector activity. Current readings on PMIs side signal blistering growth in activity and this is sustained, on average from the start of Q2 2013. Yet, Irish construction sector remains the second worst performing sector in the EU since the start of the crisis:


You can see the disconnection between PMIs (these are quarterly averages) and Construction sector actual performance setting in post Q2 2013 here:


15/5/15: Monetary Titanic & Bubbles Troubles


Food for thought this morning - two links:

Note, first link above cites low worker productivity. Here's a slide from my recent (this week) presentation on same: 

And here is my view on the Irish property bubble (in development, but not yet fully manifested):


What is interesting about the Irish property markets is that whilst price and activity levels are not yet at concern points, the rates of increases in commercial rents and declines in yields, and rates of rises in residential property prices in Dublin are clearly fuelling a massive hype by real estate agents and the media. This is hardly consistent with a 'healthy' market.

I will be speaking about the financial valuations bubbles, focusing on M&As and strategy for avoiding these, next week at http://rebel.alltech.com/ so stay tuned for slides on that next week.

15/5/15: Greece on a Wild Rollercoaster Ride


Greece has become a BitCoin of Europe in terms of volatility, and, man, things are soaring and crashing on a daily basis now. Here are three snapshots of Greek Credit Default Swaps:

End of last week:
Mid-week this week:
Closing yesterday:

Meanwhile, the entire financial system of Greece is now on a weekly timeline courtesy of the ECB approvals of ELA:
One move by ECB down on ELA or laterally on collateral requirements, and the house of cards can come crashing.

Note: Sources: CMA and @Schuldensuehner.

15/5/15: New Financial Regulation: Part 8: An Overconfidence Bias Awaits


My latest blog post on European Union innovations in financial regulation, continuing coverage of the European Banking Union is now available here: http://blog.learnsignal.com/?p=181

Thursday, May 14, 2015

14/5/15: Expert Insight: Q1 results: Estonia


My contribution (and others') to economic outlook analysis for Estonia, via Euromoney Country Risk http://www.euromoneycountryrisk.com/Analysis/Expert-insight-%E2%80%93-Q1-results-Estonia

Here are the jpgs of the article:


14/5/15: The Happiest Deflationary Consumers of Ireland... April 2015 Data.


Good thing Consumer Confidence is booming in Ireland, cause otherwise we might get a wind that domestic demand for goods and services is going nowhere:


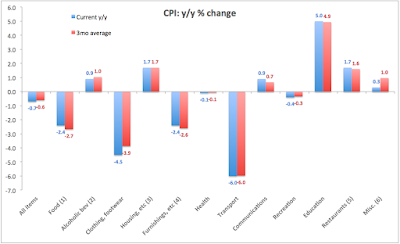
Now, how would we get such an idea. you might ask? Well, simples.com : take a look at consumer prices:

Spot the trend? That's right: CPI was down 0.7% y/y in April and down 0.6% on average over the last 3 months.

And in case you want to see what 'sustains' at least some semblance of non-totally-collapsing prices? Why here it is:

Well, the only reason we are not a complete basket case come inflationary dynamics is thanks to tobacco and alcohol (up whooping 26.5% over the pre-crisis average thanks to tax extraction by the State), and electricity and rents (pushing housing, water, electricity, gas etc up 7.1% over the pre-crisis levels - you might also call that tax extraction, for much of these increases goes to fund semi-states and quangos and soon-to-come Irish Water), Health (where much of the 'savage cuts' were just something masking the actual hikes in cost of services to those of us who pay for them), and Education (where state extraction of funds was so rampant as outpace by a factor of 10 overall inflation in the economy), and Restaurants & Hotels (where the cut in Vat did nothing to alleviate price pressures on consumers), and a bunch of state-related and regulated prices that went into Miscellaneous category.

And so just as with retail sales, deflation is now consistent with rising consumer confidence. Happiness attained, at last. Just never ask what happens to demand when prices (imported from the rest of the Euro area) start creeping up across all sectors... that is something polite Irish economy forecasters don't want to talk about...

Wednesday, May 13, 2015

13/5/15: Dublin Commercial Property Market 1Q: No Fireworks, yet...


CBRE's commercial property report for 1Q 2015 is worth reading. If only for the surprising sub-trends that go largely unnoticed in the overall frothy markets.

Let's start with the summary: "Office take-up in Dublin during Q1 2015 reached 38,359m2 in 64 individual lettings." And, "the highest number of lettings in a quarter since Q1 2008".

So we have a handy chart:

Do tell me this is somehow a sign of 'strong' performance - 1Q 2015 lettings are lower than 1Q 2013 and 1Q 2014.

"15 of the 64 transactions signed in Q1 were to US companies with a further 39 lettings to Irish companies"

Which is good, because up until recently, main new signees were MNCs and Irish public sector. But… "There were no large lettings of over 4,645m2 (50,000 sq. ft.) completed in Q1." Wait, there were no large lettings completed in 4Q 2015 either, as I recall. Which means no large lettings in at least 6 months.

"62% of office take-up in Q1 occurred in Dublin City Centre" which is lower than in 1Q 2014, but higher than in 1Q 2013. Which suggests no clear trend in terms of pick up outside Dublin City Centre. Actually, ex-Dublin City Centre, lettings completed are the lowest for 1Q period compared to 2013 and 2014.

"The overall rate of vacancy fell to 11.27% down from 11.84% at the end of 2014. The Grade A vacancy rate in Dublin 2/4 at the end of Q1 2015 was 1.78%." And "prime office yields now 4.75%". Which suggests that while the prime market is clearly over-heating, secondary market is not.

"2 of the ten largest lettings completed in Dublin during Q1 were expansions, while 5 were relocations and 3 were lettings to new entrants." Which is an improvement on 4Q 2014 when there were no new entrants at all.

So I dare say there is not that much of a 'revival' going on, compared to where we are relative to the pre-crisis activity. It is probably more accurate to describe 1Q 2015 as steady, gradual and potentially risky recovery. Cautious, except when it comes to pricing Grade A prime location properties - the trophy treasure of MNCs and Public Sector and Semi-States.

Tuesday, May 12, 2015

12/5/15: Behold the Digital (Paper) worth EUR415 billion


Yes, EU has a new proposal for a new White Elephant, named Digital Strategy and costed at EUR415 billion: https://euobserver.com/digital/128602...

And yes, unveiling it, the forward-looking modernist commissioner for everything Digital had to carry into the hearing a pile of... papers...


You can't make this up... but you can (if you are an EU Commissioner) make up a EUR415 billion new 'Lisbon Agenda'... this time for a Digital Union... to out digitalise every other Digital Economy in the world... using pencils and binders...

12/5/15: European Bonds are Set to Continue their Decline


Things are getting ugly in the bond markets. Bund 10 year is already up ca 7bps, while Italy is up 9bps.

Here's yesterday close for the 'peripherals':

Source:  @tradeweb

And Italy, Spain, Portugal on a longer view:

Source: @Schuldensuehner 

Meanwhile, Germany...

Source: @Schuldensuehner 

Meanwhile, the theme of investment flows (ETFs) rotation is may be starting, although European ETFs are seeing record inflows, breaking USD500 billion mark in April:

Monday, May 11, 2015

11/5/15: Frightening: Only 10.3% of Board Seats in Ireland are Held by Women


Just came across a startling or [better descriptor] - frightening - statistic:

Source: http://www.catalyst.org/knowledge/2014-catalyst-census-women-board-directors

Yes, the issue of causes for each country performance in this metric is complex.

But there is no excuse for Ireland's corporate culture in this: it goes without saying that women residing in Ireland (be they of Irish or foreign nationalities) are educated, trained and have comparable experience, aptitude to work, career aspirations and human capital to be exactly on par with men, even after we adjust for maternity leave and family formation.

10.3% women share on Irish boards is simply out of any tangible relation to the modern, competitive enterprise culture we want to continue building here.