Showing posts with label euro area recession. Show all posts

Tuesday, October 30, 2012

30/10/2012: Eurocoin signals continued recession in October


Euro area economy did not improve significantly in September-October, according to the leading composite indicator eurocoin published by the CEPR and Banca d'Italia.


Per eurocoin,

  • October growth reading stood at -0.29%, statistically indistinguishable from -0.32 and -0.33 recorded in September and August, respectively. 
  • October marks thirteenth consecutive month of contraction being signaled by eurocoin
  • Crucially, 3mo MA is now at -0.313 which is the same as 2008-2009 average (-0.31). 6mo average is at -0.23.
  • We are now into the fourth month of statistically significant sub-zero readings.


As charts below show, ECB remains in the operating range where inflationary target is not consistent with Taylor Rule target.


And here's a chart from Morgan Stanley Research showing PMI-based indicators are also pointing South:


Tuesday, August 7, 2012

7/8/2012: Once forgotten Growth & Jobs Plan


So, by now we all have forgotten that little bit of June-July newsflow that promised a Compact for Growth to help the EU recover from the euro area-induced depression. And for a good reason - whole thing was a complete fudge. The problem is - this was supposed to be the second half of the EU policy equation. If the entire half of that equation is really a pure fake, what confidence can we have in the validity or sustainability of all other euro area commitments delivered at the last summit of June?

Answer - none.

Now, here's the reminder of the June 'growth fudge'. Alongside the euro area council, the European Commission singled out the European Investment Bank as the core instrument for stimulus measures - which in reality, given EU Commission's total lack of economic policy imagination amounts to public works and infrastructure investments. On July 31, the EU Commission issued a paper covering EU construction sector and calling for the sector to become the core driver of its grandiose scheme to kick-start the euro area economies. Let's keep in mind - the construction sector accounts for just about 10% of total GDP in the euro area, while being responsible for the lion's share of total losses in the euro area banking sector and for the majority of debts in the private sector that currently hold the economies of the euro area hostage.

Back on June 30th, the EU agreed a 'new' stimulus package worth €120 billion - the Growth and Jobs Pact. This 'new' measure, of course consisted of €55 billion of already allocated in the budget, but will be diverted from such worth-while activities as building EU's 'social(ist) / green / nano / smart / knowledge-filled economy' to EU's 'bricks-and-mortar economy'. Of the remaining €60 billion, only €10 billion will come from actual funds, which will be 'leveraged' by EIB (read: more debt) to raise up to €60 billion in funding which the EIB can then lend out to the 'struggling' economies for the purpose of building 'stuff'. There's a problem, Roger, as some would say. Last year, EIB has managed to lend out just €61 billion on the foot of raising €76 billion. In other words, apparently, EIB sees not enough worthwhile investment opportunities to allocate funds it already has. Back in 2010, EIB lent out €72 billion. But with the EU Commission plans, the bank should simply double its lending overnight. 

Despite the fact that by EIB's own admission (see annual report) the levels of lending in 2010 were 'exceptional' and the bank would like to return back to 'normal' lending volumes.

Recap the above: EIB is already lending at 'exceptional' levels and would like to scale this lending back, and EIB would have to double its lending capacity to deliver on EU Commission plan.

Now, what can possibly go wrong with this?

Friday, June 29, 2012

29/6/2012: Eurocoin June 2012: Rotten Readings

Eurozone's latest lead growth indicator Eurocoin (CEPR and Banca d'Italia) has hit a new low for the year in June.


In June the €- coin index declined from -0.03% to -0,17%, indicating a further worsening of cyclical economic difficulties. The decline is due principally to the markedly worse results of opinion surveys of firms and households and, to a lesser extent, to trends in share prices.


Charts below:

My forecast, consistent with eurocoin data is for growth in Q2 of -0.25-0.37% in GDP, as per below:


The monetary policy remains stuck in 'ineffective' mode:


Rotten to the core!


Saturday, January 28, 2012

28/1/2012: Eurocoin for January 2012

The latest leading indicator for euro area growth -Eurocoin - for January continues to signal recessionary dynamics, albeit at moderating rates of decline.

January Eurocoin rose to -0.14 from -0.20 in December 2011. Here are some charts:


Eurocoin is now in the negative territory for four consecutive months. 3mo MA is at -0.18, 6mo MA at -0.07, crossing into negative for the first time since the last recession. In January 2011 the indicator stood at +0.48. Quarterly rate of growth is now at -0.17 implying annualized contraction of -0.56%.

There is now, due to persistent negative reading, more consistency in eurocoin and ECB repo rate, but inflation-growth remain unbalanced when it comes to applying Taylor rule to ECB rate policy.


All in, the rates decision based on the leading indicator performance should be to stay put and await more significant moderation on inflation side. Mild bout of inflationary recession is still on the cards for the euro area for Q1.

Friday, December 30, 2011

30/12/2011: Eurocoin December 2011: recession + inflation

Eurocoin - euro area's leading indicator of growth environment - posted another disappointing month in December. December reading came in at -0.20, same as November with 'stabilization' accounted for by improvement in surveys-based indicators for industrial and services firms, offset by material deterioration in actual demand indicators. Core Q4 2011 forecast for euro area growth now moved to -0.2, dangerously close to establishing a full-blown statistical contraction in the economy. More significantly, current growth and inflation conditions pairing pushed ECB policymaking into a proverbial straight jacket corner: rates consistent with inflation remain in the region of 3-times higher than current rate, while rates consistent with growth conditions are about right for the current 1.0% rate.

Charts below illustrate.


3mo MA for Eurocoin is now at -0.18, against 6mo MA of +0.03. YOY Eurocoin is down 141% and the indicator remains at the lowest level since August 2009. Annualized growth rate is forecast is running at -0.798% and 6mo MA annualized growth rate is running at +0.117% (also the worst performance since August 2009).


Friday, November 25, 2011

25/11/2011: Eurocoin signals recession for the euro area

And so the euro zone is now most likely in a recession. That's right, the R word is back.

Today, CEPR released its composite leading economic indicator for November - eurocoin - and the measure has posted it second consecutive monthly negative reading on foot of six consecutive monthly declines. Here are the details.

Eurocoin fell to a recessionary -0.20 in November 2011, from -0.13 in October and +0.03 in September.  The 3mo MA is now at -0.1 and 6 mo MA declined to +0.148. A year ago, the indicator stood at +0.45. Chart below updates, including eurocoin-consistent forecast for growth.
The following charts show the ECB decision-making inputs:


So ECB rates consistent with current growth are in the range of 1.0-1.5% - basically bang-on the current rate. However, inflation remains sticky and all indications are it will come in at around 2.7% in November, suggesting that rate expectation is for no change at beast (optimal rates consistent with this rate of inflation is in the neighborhood of 4%).
The ECB dilema continues.

Monday, October 31, 2011

31/10/2011: Stagflation on Europe's doorsteps

Euro area preliminary inflation estimate came in today with October reading at 3.0%. This is the second month in a row with inflation anchored at 3.0% and coupled with the signs of a recession (see charts below showing eurocoin leading growth indicator for October at -0.13, signaling contraction in economic growth) we are now in the stagflationary territory.

 You can see the dramatic deterioration in inflation-growth dynamics year on year in the chart above. The chart below shows updated 'optimal' inflation-consistent zone for ECB rates at over 4.0% against the current rate of 1.50%.
The above suggests that the ECB is now boxed into the proverbial stagflationary corner - lowering rates to improve growth outlook will risk pushing inflation even higher, while hiking rates or even staying put at current rates risks continuing deterioration in growth fundamentals.

Monday, October 3, 2011

03/10/2011: Euro area PMIs & Industrial Production - September

So for a poor start of the week, Monday data on manufacturing across the euro area continues to push the stagflationary growth scenario.

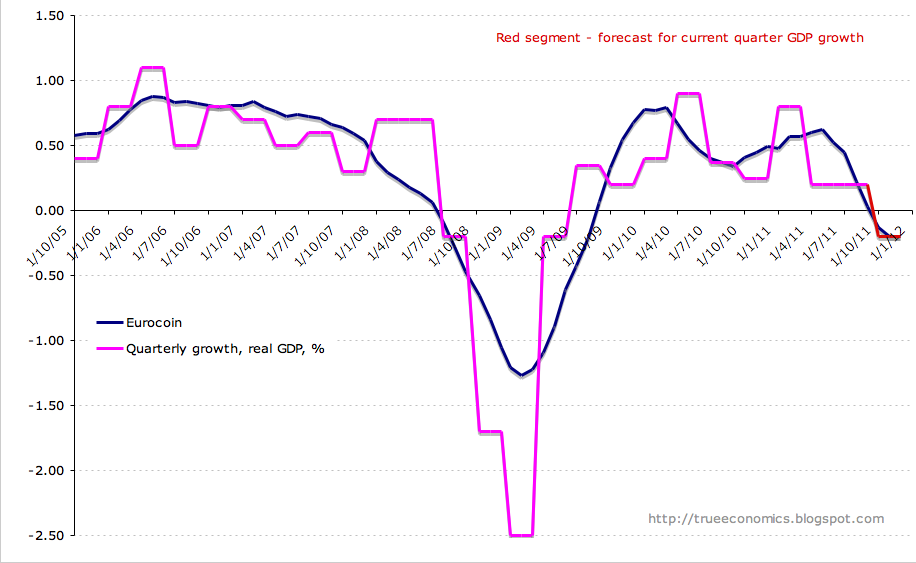
First, the eurocoin leading economic indicator came in at another contraction in September - see details here.

Second, gloomy PMIs readings across the entire euro area are, not surprisingly, confirming slowdown and contrasting the UK (although not too-cheerful 51.1 reading, on a foot of a 49.4 revision in August, with UK new export orders sub-index falling to 45.0 from 46.9, reaching the lowest level since May 2009):
  • Euro area overall PMI at 48.5 in September against 49.0 in August, marking the worst monthly reading since August 2009. Output sub-index at 49.6 against 48.9 in August and new orders sub-index at 45.2 in September, down from 46.0 in August, lowest reading since June 2009. Rate of output contraction slows but new orders drop at fastest rate for over two years. PMIs fall in all countries except Italy. Steepest declines seen in Greece and Spain.
  • German September PMI for manufacturing is at (barely expansionary) 50.3 from 50.9 in August and at the lowest level since September 2009.
  • French September PMI-M fell to 48.2 from 49.1 in August. Now, recall that France posted zero growth in Q2 2011 when PMIs were above expansion line.
  • Italian PMI-M up at 48.3 from 47.0 in August, implying that manufacturing is shrinking at a slower pace than before, but shrinking nonetheless.
  • Spanish September PMI for manufacturing is at 43.7 down from 45.3 in August - both depressing readings signaling accelerating and deep contraction.
  • Greece: 43.2 in September, down from 43.3 in August
So manufacturing activity overall is followed now by new exports fall off as well:


All of this has been building up for some months now. The latest Eurostat data (through July 2011) shows already nascent trends of weaknesses on manufacturing and broader industry sides:
Manufacturing:
New orders (lagging series in terms of signaling slowdown):
Capital goods (leading indicators):

And finally, overall industrial production:
Things are now looking structurally weak, rather than temporarily correcting.