Showing posts with label Irish construction industry. Show all posts

Thursday, September 27, 2012

27/9/2012: Planning Permissions, Ireland, Q2 2012


Planning Permissions for Q2 2012 were published today for Ireland, offering basically continuation of the trend established the end of 2010 which marks slower rate of decline in overall planning permissions. Chart below illustrates:


Total number of planning permissions rose 9.03% q/q in Q2 2012 to 3,672 (still 13.48% down on Q2 2011 and 78.8% down on peak).

In Q2 2012, overall number of planning permissions in Ireland for new dwellings dropped to 942 from 957 in Q1 2012 (-1.57% q/q), which is down 25.47% y/y and down 87.5% on peak. In contrast with new dwellings, other new construction permissions rose from 695 in Q1 2012 to 828 in Q2 2012 (up 19.14% q/q and up 14.84% y/y), which is still down 86.7% on peak.


Annual rates of change clearly show that the slowdown in the rate of decline is now persistent over two quarters for total number of planning permissions, while there is an acceleration in the rate of decline in the planning permissions for new dwellings.


Average square footage relating to new permissions granted is now moving sideways since Q3 2011, suggesting there is really no life in the market for new construction, even in the potential pipeline of work planned.

Sorry to say this, but no good news here.

Friday, June 29, 2012

29/6/2012: Irish Planning Permissions: Q1 2012

After 5 years of continued destruction in the construction sector in Ireland, one simply has to re-test the accepted paradigms that things can continue falling indefinitely. I mean, yes, there's a bound to how far down new construction permits for new dwellings can go, but... who would have thought it might be a zero?

Here are the latest stats on approved Planning Permissions in Ireland for Q1 2012. Not a pretty sight - be warned.

In Q1 2012, number of new planning permissions for new dwellings stood at 957 - a new all-time low for Q1 figures, up 0.2% on Q4 2011, but down 25.1% year on year. Compared to peak, the number of new dwellings being planned in Ireland is now down 87.3%.

Other New Construction permits rose to 695 in Q1 compared to 681 in Q4 2011, but Q1 figure this year is the lowest of all Q1 readings in history. Y/y permits are down 0.7% and compared to the peak, they are down 88.8%.

Extensions approvals rose from 1,312 in Q4 2011 to 1,339 in Q1 2012, marking another historical low for Q1 figures, down 18.2% y/y and now 74.3% below their peak.

Alterations and Conversions permits rose to 377 from 335 in Q4 2011 and are now at a new historical low for Q1 readings. Y/y permits dropped 6.9% and relative to peak they are down 55.0%.

Thus, total construction permits awarded are now at 3,368 in Q1 2012, new historical low for Q1 readings, but up on 3,283 in Q4 2011. Y/y all construction permits are down 16.2% and reltive to peak they are off 80.6%.

These are ugly numbers, folks.

Charts to illustrate:


Monday, May 14, 2012

14/5/2012: Irish Construction Sector PMIs for April 2012

The Irish Construction PMI published by the Ulster Bank posted another massive fall, declining to 45.4 in April, from 46.7 in March. This is the sharpest rate of decline in the sector since October 2011. 


Breakdown by sub-sector:
Which means that
  1. Housing sector activity is now sharper than overall activity, for the first time in seven months and is sharpest since September 2011
  1. Commercial sector activity is on shallower decrease path in April than in March, but nonetheless, there is no improvement, despite the claims by our development agencies and reports by some real estate houses that MNCs are literally falling over each other trying to build massive new facilities. 

Wednesday, April 11, 2012

11/4/2012: Irish Construction Sector PMI for March

Irish construction PMI for March 2012 (published by Ulster Bank) posted a 58th consecutive monthly contraction with a reading of 46.7 against 45.8 in February 2012. In other words, construction sector activity has now been below 50.0 reading every month since June 2007.


Commercial sector activity showed accelerating decline at 47.4 in march 2012 against 49.1 in February 2012. This puts to a test some of the assertions made in recent months by sector analysts and in the media that commercial construction activity is showing a rise on the foot of robust FDI investments.


Engineering sector activity - primarily driven by public projects - was showing decline at 37.0 in march, slower rate of decrease than consistent with 35.6 reading in February. Housing sector activity remained on a relatively constant rate of decline at 42.3 in March compared to 42.4 in February.


Desperate reports of some analysts have decided to focus "positive" attention on allegedly broadly unchnaged new orders sub'index and improved business sentiment. However, actual data release stated that (emphasis and commentary mine):

  • New orders were broadly unchanged in March, having declined solidly in the preceding month (thus unchanged in March means unchanged from the losses sustained previously). Some firms indicated that small contracts had been secured during the month, but others indicated that a reluctance among clients to commit to projects had prevented a rise in new orders. (If this is a net positive, I should be probably joining the Russian Ballet)
  • Business sentiment was at its highest since January 2007 in March and, as such, was the strongest since the current downturn in activity began (in June 2007). Exactly 46% of respondents  predict that activity will increase over the next 12 months, with signs of improving economic conditions and a forecast rise in new orders supporting optimism. (Alas, the Ulster Bank release fails to give us any data on business sentiment sub-index. In fact, this is the only indicator missing in the charts supplied by the Markit note).


What no report that I have seen so far mentions is that, per Ulster Bank-Markit note: Construction sector "workloads remained insufficient to generate a rise in employment in the sector during March. That said, staffing levels decreased at a rate that was much weaker than seen throughout much of the current downturn." So employment continues to drop. And profit margins are also continuing to fall: "The rate of input cost inflation accelerated for the third consecutive month in March, and was the fastest since April 2011. Higher prices for fuel and other oil-related products were reported by panellists."

On the foot of this information, and presumably with an aid of some tealeafs floating in a cuppa, one respectable analyst concluded (emphasis and commentary mine): unchanged new orders and unverifiable "spike" in business sentiment "...may tentatively signal that the Irish market is approaching stabilisation, albeit at a very depressed level." Ok, then, Bolshoi School is recruiting for Junior Infants... I am off for an audition.

Thursday, March 15, 2012

15/3/2012: Irish Industrial production & Turnover for January 2012

Industrial production & turnover figures are out for January 2012. CSO headline: "Industrial Production increased by 0.7% in January 2012".behind the headline, things are not so rosy. Here are the details.

Industrial production index for Manufacturing rose in volume terms from 109.6 in December 2011 to 110.3 in January 2012 - that's on of the ca 0.7% increases mom. Series are extremely volatile, so stripping short-term effects:

  • Yoy index is down 0.18%
  • Compared to same period in 2007 index is down 3.35% - implying that with all records busting exports, industrial production volumes in Manufacturing remain below pre-crisis levels.
  • Compared to 2005, manufacturing activity is only 10% up
  • Comparing 3mo average for Nov-2011 - January 2012 to 3mo average for Aug 2011-Oct 2011, the index is down 7.5%
  • Comparing last 3mo average to same period a year ago, the index is down 2.9%
Still, good news, index did not fall in January.

All Industries index increased from 107.5 in December 2011 to 108.3 inJanuary 2012 - the core 0.74% rise, but:
  • Yoy index is down 0.5% and it is down 4.2% on January 2007
  • Comparing 3mo average for Nov-2011 - January 2012 to 3mo average for Aug 2011-Oct 2011, the index is down 7.4%
  • Comparing last 3mo average to same period a year ago, the index is down 3.2%
  • In 7 years, Industrial output rose by just 8.3 cumulative in volume
Modern Sectors fared much better - in monthly terms the index went up 4.9% in January 2012, and year on year the index is up 4.1%. That said:
  • Comparing 3mo average for Nov-2011 - January 2012 to 3mo average for Aug 2011-Oct 2011, the index is down 9.5%
  • Comparing last 3mo average to same period a year ago, the index is down 3.2%
  • In 7 years, Industrial output rose by just 27.2% and since January 2007 the index is up 8.5% cumulative in volume
So some shorter-term pain, but overall, nice performance. Of course the trend (as shown in the chart below) is clear-cut and strong.

Traditional sectors continued to take the beating: down from 88.7 in December to 82.2 in January - a mom drop of 7.4% - the steepest in 4 months. The things are bad:
  • Yoy volume of production in Traditional Sectors is down 8.2%
  • Comparing 3mo average for Nov-2011 - January 2012 to 3mo average for Aug 2011-Oct 2011, the index is down 6.1%
  • Comparing last 3mo average to same period a year ago, the index is down 4.2%
  • In 7 years, TraditionalSectors volume fell 18% and since January 2007 the index is down 22.9% cumulative in volume

Relative contribution of Traditional Sectors to the economy compared to Modern Sectors is shrinking and the rate of contraction accelerated in January 2012, as shown in the chart below:


Things are worse on the turnover indices side with price deflation took bites out of the value of our economic activity:

  • Manufacturing sectors turnover fell from 107.8 in December 2011 to 98.1 in January - a decline of 9% mom. It is now down 3.8% yoy and 14.3% below January 2007. The index is down 2% on 2005. Over last 3 months the index actually up on average 2.8% compared to 3mo average for August-October 2011 and 5.0% above the index reading a year ago, back in November 2010-December 2011.
  • Other broader sector - Transportable Goods Industries turnover also fell mom - down 8.8% and is down 3.9% yoy. The pattern of changes is pretty identical to that in Manufacturing.
Looking forward, New Orders index for all sectors came in at a disappointing 98.5 - the lowest reading since April 2011 and 3.7% below January 2011 levels. The index is down 8.9% yoy and 15.8% on January 2007. The historical trend remains firmly downward, but shorter-range trend since january 2010 is strongly up. 


Yoy, New Orders declined 1.9% in Food Products (mom decline of 5.7% in January), rose 5.0% in Beverages (mom rise of 1.2%) and increased 5.5% in Chemicals and Chemical products (+2.7% mom). There was a huge fall off in New Orders in Basic Pharmaceutical Products and Preparations - down 6.9% yoy and 26.4% mom. Computer, electronic and optical products are down 4.3% yoy and 1.2% mom. Do note the patent cliff sighted above - dramatic - and will translate into trade figures as well. Please keep in mind - Government has been saying they have prepared for this.We shall see once trade data & QNAs come in for H1 2012.

So some headline improvements, but overall, weak data.

Wednesday, December 21, 2011

21/12/2011: Irish Planning Permission Q3 2011


In Q3 2011, there were 2,512 planning permissions granted for dwelling units, compared with 4,641 units for the same period in 2010, a yoy decrease of 45.9 %.

However, overall, Q3 2011 number of new dwellings approved stood at 1,271, up 0.55% qoq and down 22% yoy. Relative to peak in Q2 2004, the number of new dwelling units approved declined 83.2% in Q3 2011.

Per CSO: 
  • Planning Permissions were granted for 1,887 houses in the third quarter of 2011 and 2,817 in the third quarter of 2010, a decrease of 33.0%. 
  • Planning permissions were granted for 625 apartment units, compared with 1,824 units for the same period in 2010, a decrease of 65.7%.
  • Total floor area planned was 969 thousand square metres in the third quarter of 2011. Of this, 48.0% was for new dwellings, 29.7% for other new constructions and 22.3% for extensions. The total floor area planned decreased by 31.4% in comparison with the same quarter in 2010.
  • Planning Permissions for new buildings for Agriculture rose to 194 this quarter. This compares to 132 permissions in the same quarter of 2010.
More detailed analysis of CSO data shows that total number of new permissions rose 4.76% qoq in Q3 2011 from 4,244 in Q2 2011 to 4,446. However, Q3 2011 total number of permissions was down 16% yoy and down 74.4% on the peak attained in Q3 2007.

Charts below illustrate:


Saturday, July 9, 2011

09/07/2011: Construction Activity : Ireland 1980-2010

Rummaging through the Federal Reserve database, I came across a fascinating set of numbers on the number of construction permits issued in Ireland. These are based on index with 100=2005 level of activity.
  • By the end of 2010, new dwelling construction activity has fallen from the high of 102.4 attained in 2004 to the low of 15.3.
  • Year on year, 2010 activity was down 56.8%. 2010 marks a decline of 80.7% on 5 years ago, 80.6% decline on 10 years ago, 56.4% decline on 15 years ago, 26.1% decline on 20 years ago, 8.5% rise on 25 years ago and 58% decline on 30 years ago.
  • The only sustained decline period - other than current - was 1983-1996 period, when activity dropped from 35.2 in 1983 to the trough of 12.8 in 1988 - 4 years of decline and the cumulative drop of 63.6% (much more benign that the current drop of 85.1% to the end of 2010). The recovery in that contraction took over 13 years.
So we had a cycle of over 17 years and if one were to count 1981 as a peak with 1982-1983 as a temporary bounce, then the last cycle took 19 years to unwind. Good luck to anyone still hoping for a return to "normal" unless your normal is pre-boom average activity at 51-52 or roughly a half of the construction activity in 2004-2005.

Here's the chart:

Friday, June 10, 2011

10/06/2011: Industrial turnover and production - April 2011

Industrial Production and Turnover data was released today for April, indicating the overall activity in the manufacturing sector and the broadly defined sources of this activity.

In line with this, I went back and linked - re-based - 2006 and 2007 CSO data to current base to show some comparatives to pre-crisis dynamics.

Here are the highlights:
  • Manufacturing activity was up 4.09% on annual basis, compared to April 2010. Monthly increase was 2.24%. However, Manufacturing activity was down 1.44% on 3 months ago and 4.16% on April 2007 (pre-crisis). The seasonally adjusted volume of industrial production for Manufacturing Industries for the 3mo period to April 2011 was 1.8% lower than in the preceding 3mo period
  • All industries activity was up 1.32% mom and 2.67% yoy, but down 2.095% on 3 months ago and down 5.33% on April 2007.
  • Modern Sectors posted a volume increase of 2.52% yoy and 1.41% increase mom. The activity in Modern Sectors is up 4.79% on April 2007, but is down 2.4% on 3mo ago.
  • Traditional Sectors activity was up 1.39% yoy and 1.15% mom, but down 0.57% on 3mo ago and a whooping 18.05% on April 2007.
  • It is interesting to note that Modern Sectors are positively correlated with Manufacturing output to the tune of 0.772 for the full sample (January 2006-present), but this correlation grew to 0.863 for the sub-sample covering the crisis (since January 2008) and continues to grow today - up to 0.926 for the sub-sample since January 2010.
  • In terms of Modern Sectors influence on All Industries volumes, the same relationship holds, with full sample correlation of 0.713 rising to 0.812 for the crisis period and to 0.887 for the period since January 2010.
  • The predominant role of Modern Sectors in driving Irish Industrial production is contrasted by a very modest role played by Traditional Sectors, where correlation with All Industries has declined from 0.416 in the full sample since January 2006, to 0.290 in the sub-sample covering the crisis since January 2008, to 0.142 for the sub-sample since January 2010.
Chart to illustrate:
Of course, the driving factors discussed above imply that:
  • The collapse of construction and real estate investment exposed the extreme degree of indigenous industries dependence on these areas of economic activity;
  • MNCs-dominated modern sectors, free of constraints of domestic demand, have been experiencing strong recovery. Manufacturing has regained pre-crisis peak of 109 (attained in 2007) back last year (reaching index reading of 110.1 for the year), which also pushed All Industries index a notch above pre-crisis peak. Modern Sectors have shot to new historic highs in 2010, reaching 124.7 index reading, compared to pre-crisis peak of 111.2 attained in 2007. It is worth noting that Modern Sectors have recovered from the recession back in 2009, having posted volume of production index reading of 112.7 - above the pre-crisis peak.
  • These trends continued in April 2011, as CSO notes, since "the most significant changes [in Volume of Production Indices] were in the following sectors: Basic Pharmaceutical products and Preparations (+11.3%) and Beverages (9.9%)... The “Modern” Sector, comprising a number of high-technology and chemical sectors, showed an annual increase in production for April 2011 of 2.6% and a increase of 1.4% was recorded in the “Traditional” Sector.
Next, consider turnover indices:
  • Turnover in Manufacturing sector in April registered index activity at 95.9, which is 3.01% above March activity and 3.45% above April 2010 activity. However, turnover is 4.29% below that recorded 3 mo ago and 14.40% below April 2007. The turnover in April was also lower than the turnover in any of the months from May 2010 through February 2011
  • Turnover in Transportable Goods Industries posted index reading of 95.4, which was up 2.69% mom and 3.02% above April 2010 reading. The index was down 4.6% on 3 mo prior to April 2011 and 15.22% below April 2007 reading.
  • This suggest that output sales conditions have improved mom (monthly changes in turnover exceed change in volumes), but are still down yoy.
Chart to illustrate:
Lastly, the above chart also shows new orders activity which has risen from 90.7 in March to 95.9 in April for all sectors. However, new orders activity remains slowest for any month since the end of April 2010 through February 2011. New orders index is therefore up 5.73% mom (good news) and 3.79% yoy (also good news), but it is still down 4.39% from 3 mo ago and is down 15.52% on April 2007.

Sunday, October 3, 2010

Economics 3/10/10: Construction sector - destruction continues

Nothing exemplifies the collapse of the Celtic Tiger than the fate of our indigenous 'flagship' sectors: Banking and Construction. The two fates, linked at the hip, got some very different treatment in the media this week. Banks received all the attention, yet Construction suffered a total neglect. Yet, last week CSO published Q2 2010 data for Construction sector.

Undoing any damage to the Construction sector's reputation as the 'leading newsflow' sector of Ireland Inc, let's update the data. Here are the charts, most of which, as often is the case, speak for themselves.

First volume and value in all sectors ex-Civil Engineering:
Next: Civil Engineering:
Interestingly, if you recall, since Budget 2009, this Government has consistently claimed that Ireland is getting a significant stimulus in the form of public investment - which, of course, in Government's parlance always means 'building stuff'. In fact, even after the imposition of the latest cuts in the Budget 2010, Civil Engineering spend (ok, investment) declined at the rates greater than the Government has planned for.

Residential and Non-Residential:
To see the real extent of our crisis in the Construction and Building sector, compare ourselves to the European counterparts:
And what about our previous claims that we don't belong to PIIGS?
What's amazing, of course is that despite this massive contraction, our housing and property markets continue to free-fall while employment in the sector continues to contract.

Monday, August 9, 2010

Economics 9/8/10: Ireland's Construction PMIs

This morning brought with it another bunch of wonderfully optimistic statements from the Irish 'experts' on business cycles.

Let's take in the facts:
  • Ulster Banks’ Irish Construction PMI data released today showed moderating decline in Irish construction activity in July. PMI increased modestly from 44.9 in June to 45.0 in July which still means a contraction in activity.
  • However, at 45.0 the 'improvement' in terms of slower rate of decline is within margin of error, at least one based on time series residuals (Ulster Bank won't tell us what the real underlying margin of error in PMI surveys for the sector is).
  • So on the surface, contraction in activity is now "the slowest in three years". Which of course is only a natural statistical property - after 3 years of destruction raging across the sector, you'd get an asymptotic curve to 'stabilization', aka the bottom. This has absolutely nothing to do with any pending improvements.
  • Residential sub-sector was the weakest, showing accelerating drop-off to 40.8 in July, from 45.4 in June. So housing continues to fall off the cliff.
  • Commercial and civil engineering sub-sectors posted an 'improvement' in July - with the rate of collapse slowing from 45.8 to 46.0 (another statistically insignificant change) and to 43.6 form 38.4 respectively (clearly a statistically significant number). Again - the 'good news' here is a slowdown in the rate of the fall off, no real improvement.
The real spin stuff was, actually, in the interpretations concerning future expectations: "Future sentiment remained strongly positive in July, and improved slightly since the previous month, as over 40% of respondents expect activity to be higher in twelve months’ time."

You see, should the question have been 'Do ou expect any improvement in activity 10 years from now?' the 'improved' sentiment would have probably been even stronger.

Virtually identical analysis was presented by the Ulster Bank itself (here). Ulster Bank chief economist Simon Barry told the Irish Times that "index showed that conditions in the Irish construction sector remained “very tough”, with firms continuing to cut back sharply on their employment levels... [But] 'Looking forward, the July survey picked up a further improvement in confidence among Irish construction firms,' Mr Barry said. The rise in new business would provide “added encouragement”, he noted... 'As heartening as this development is, the increase is very modest indeed and it is probably more an indication of possible stabilisation in the sector at very weak levels rather than a strong recovery anytime soon.'"

This type of interpretation omits a very simple economic reality: after 38 months of contraction, the firms still remaining standing in for the survey are those that survived so far into the downturn. These same firms might have higher expectation of surviving into the near future as well. In other words, the entire PMI survey component suffers from survivorship bias. This bias may (or may not) be significant for several reasons:
  1. Surviving firms might be biased on the optimism side because they expect to pick up a greater share of future public spending on construction due to declined competition. In other words, survivors might be looking forward to having an increased market share of a shrinking economic pie. Surely that wouldn't be indicative of 'stabilization'.
  2. Surviving firms might also be collectively biased in their responses to the survey, if they have individual incentives to do so. For example, a number of Irish construction firms are currently under continued pressure from their banks. If each one of those firms were to make a signal to their lenders that 'things are going to improve soon, just wait a little longer', the resulting bias can be significant enough to induce higher optimism readings on the survey side. This is a significant enough effect in other sectors using surveys of expected future conditions to invalidate entire indices. One classical example involves surveys of expectations for future direction in Forex markets.
  3. Surviving firms might also be selected on the basis of their actual exposure to the Irish market. For example - two leading surviving firms in the Irish construction sector are Kingspan and CRH. CRH derives only 4% of its revenue from Ireland and Kingspan's share of revenue accruing to Ireland is 7%. If firms are indeed selected into survivors group by their lower exposure to the Irish market, the question is then whether the expectations data they report is purely based on their perception of future trading conditions in Ireland or whether it is 'contaminated' by their reading of other markets.
What (1) and (3) above really suggest is that before we engage in interpreting the future expectations we need to rigorously check for a number of classical biases that might be present in the data. Only economists unaware of the hazards of interpreting survey based gauges of expectations would make the basic mistake of taking the number at their face value and interpreting them directly.

Alternatively, for a more crude correction, the survey results should not be interpreted independent of the quantitative data from contemporaneous PMI reading. In other words, one can make a conclusion that 'It is likely that in the near term there will be improvements in trading conditions in the sector' only if there are some contemporaneous signals of improvements and only if these signals are statistically strong enough.

This, of course is hardly the case, given that PMIs contemporaneous reading increased by just 0.1 from 44.9 to 45.0 - an increase that appears to be well within the margin of error.

Thursday, July 1, 2010

Economics 1/07/10: Left behind by the 'turning' Ireland

Stephen King's traditional plots involved mundane occurrences of banal middle-class lives punctuated by the extraordinary events that completely reshape the world around the protagonists: a family fight in the foreground broken apart by zombies invading the entire town in the bay windows of the family room behind warring spouses.

The last two days in statistical releases from Ireland have a similarly absurd quality, juxtaposing dynamic foreground (QNA's assertion that Ireland is 'out of the recession') with a macabre background (Live Register data for June) that, one intuitively knows, will inevitably come to dominate the entire plot.

Today's data on Building and Construction sectors output for Q1 neatly fits the 'invading zombies' framework: per CSO's release today, Q1 2010 output for the sector has fallen 34.1% yoy, while the value of production decreased 34.8% in the same period.

Clearly, yesterday's turn of the corner greeted us with a blank wall, as far as the road to real recovery goes.

Per CSO: "The fall in the volume of output largely reflects declines of over 48% and over 32% respectively in residential building work and non-residential building work. Output in civil engineering fell by over 18%".

Over the same period of time, output in the building and construction sector fell by just 7.8% in the EU27 and 9.9% in the Euro area. Sweden (+3.4%), Finland (+1.6%) and the UK (+1.2%) posted increases. The largest decreases were in Latvia (-43.4%), Lithuania (-42.9%) followed by Ireland. which means that we managed to beat off Spain for the dubious prize of being the worst performing advanced economy in the world when it comes to construction sector bust.

Makes you wonder - what the Live Register look like when the 110,000 odd workers remaining in the sector finally finish work on the few remaining sites still left from the boom?

Friday, June 19, 2009

Economics 19/06/2009: IMF on NAMA and Construction Data

Per Reuters report (here), IMF is about to publish long over-due Consultation Paper on Ireland.

IMF, allegedly, will recommend Ireland "retain the option of including additional types of loans, such as residential mortgages, in its "bad bank" scheme for housing bad debts".

This if proven correct will open NAMA to an additional downside of some €30-40bn in stressed residential property loans, which cannot be foreclosed or enforced for political reason. A costliest form of rescuing the ordinary homeowners, as compared with directly repairing their balancesheets via cash/assets injection. It will completely politicize NAMA. Hence, I will be revising my NAMA cost estimates upward in days to come.

The Indo reports that the IMF had calculated that Ireland's "structural deficit", which excludes the impact of economic fluctuations on revenues and spending, could be as much as 10 percent of Gross Domestic Product (GDP), or 18 billion euros ($25 billion). Brilliant. If proven right, IMF will be bang-on with my estimates from December 2008 and full 1.8 percentage points ahead of DofF numbers.

"It (the IMF) will endorse the widespread view that most of the correction must now come on the spending side, rather than through more tax rises," the Irish Independent wrote. Now, recall that Brian Lenihan and his adviser, Alan Ahearne, told us that no serious analyst was sugegsting, at the time of the Mini-Budget of April 2009 that the Government should focus more heavily on spending cuts, and thus, per Lenihan, huge tax increases in April budget were justified. Of course, many analysts, ncluding myself, replied that this was a lie back at the time. Now, IMF is falling behind our view.

Now, two things worth mentioning before the report is out.

First, a birdie told me that the IMF was 'convinced' by the Government to delay publication of its report until after the local elections.

Second, another birdie told me that the report was less watered down than usual, because the usual 'consultative' process where by the Governments get to vet some of the IMF's recommendations and analysis in rounds of bargaining broke early in April/May.

I am looking forward to this report...

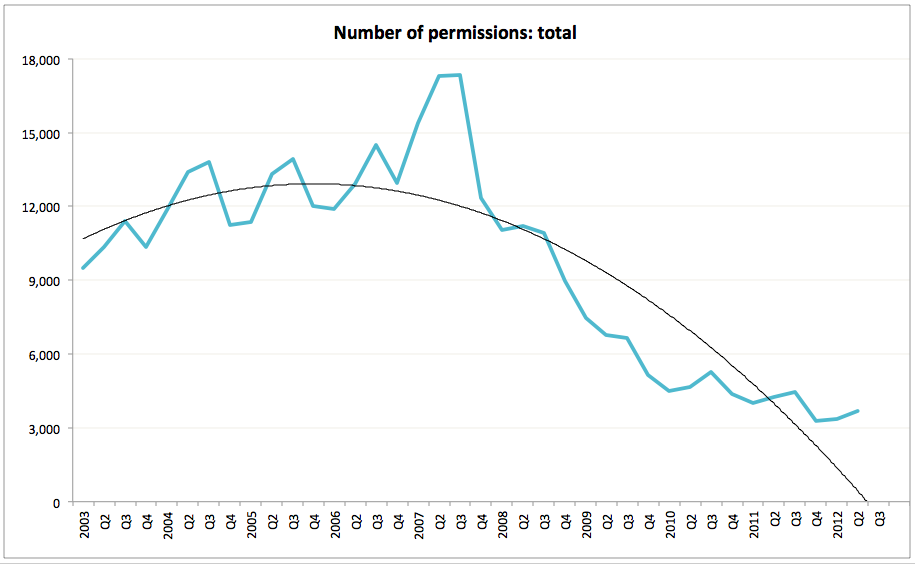
CSO data on Production in Construction and Building sector:
When a picture is worth a 1,000 words...
No signs of 'bottoming out' or 'Green Shoots' above Q1-Q2 2009 are dire and getting worse for the private building sectors. But what about the so-much touted 'Fiscal Stimulus' on our Brian-Brian-Mary 'Public Investment' side?
None! all is dead on Civil Engineering growth side, courtesy of a lie that is our public investment stimulus.
And things are getting much worse with time across the entire Residential and Non-Residential Building sectors.
But do spot an odd one out...

Friday, March 20, 2009

Rates of decline, degrees of (construction sector) misery

Earlier today (here), I gave some figures from the CSO data release on planning permissions. Here is what I wrote:

"Also per CSO release, the number of dwelling units approved was down 22.4% in year to the end of Q4 2008. In Q4 2008, planning permissions were granted for 10,375 houses as opposed to 13,135 in the Q4 2007, a decrease of 21%. Only 3,392 planning permissions were granted for apartment units, compared with 4,598 in Q4 2007, a decrease of 26.2%. The total number of planning permissions granted for all developments was 8,977, as compared to 12,330 in Q4 2007, a decrease of 27.2%. Dire stuff once again. I will do the detailed analysis of the sectoral decline dynamics in a follow up to this post."

So, as promised here are some graphs illustrating the dire state of affairs in construction industry.

First chart below shows two things:
  1. Numbers of permissions granted (annual totals) for main categories of dwellings and in total - these are now clearly falling at the fastest annual rate;
  2. Total area of all construction projects applied for is also falling at the fastest rate of decline.
Now, the next chart shows total number of permissions granted per quarter. Here, the most dramatic trend is also found in 2008, most specifically in Q3 and Q4 2008, when quarterly rates of decline in total number of permissions granted were the steepest for any quarter since Q3 2000. And the rates of decline are accelerating, relative to Q1-Q2 2008.
Lastly, more detailed quarterly date below, by each broader category of permits. I also included trend lines for the period of peak-to-present contractions, showing that Q4 2008 dynamics were consistent with generally accelerating deterioration in all categories of permits, save for 'Other'. This means that we can expect this category to actually fall further and faster in months to come.
So here you have it, for construction industry - there is no bottom in sight, yet...