Showing posts with label Global economy. Show all posts

Tuesday, April 11, 2017

10/4/17: BRIC Composite PMIs 1Q 17: Not Keeping Up With Global Growth


In two previous posts, I have covered the 1Q 2017 data for Manufacturing PMIs and Services PMIs for BRIC economies. Both indicators provided little hope that world's largest emerging economies are generating a positive growth momentum consistent with stronger global economic growth.

The same is confirmed by the Composite PMIs:

Brazil's 1Q 2017 Composite PMI came in at 46.7, up on 46.1 in 4Q 2016, but still below the stagnation line. In simple terms, Brazil's Composite PMIs have now signalled negative growth for 12 consecutive quarters. Improved 1Q 2017 reading is consistent with continued and strong contraction in the economy, albeit a contraction that is less pronounced than in previous quarters.

Russia's Composite PMI posted a reading of 56.7, marking the strongest growth performance for the economy since 4Q 2006. Predictably, given both Manufacturing and Services PMIs as discussed in above-linked posts, Russian economy has outperformed in 1Q 2017 global economic growth momentum and is currently the strongest BRIC economy for the fourth consecutive quarter.

India's Composite PMI came in at 50.8, up marginally on 50.7 in 4Q 2016. This marks the second consecutive quarter of Composite PMI readings for India that are statistically indistinguishable from the stagnation line of 50.0. There is little good news in the data from India, where the fallout from the disastrous de-monetisation campaign by the government has been taking its toll.

Chinese Composite PMI stood at 52.3 in 1Q 2017, down from 53.1, but still the second highest since 1Q 2013. In simple terms, this means that the Chinese economic growth is not accelerating off 4Q 2016 dynamics, suggesting that the economy has now exhausted any momentum gained on foot of a massive credit bubble expansion in modern history.

Chart below illustrates the dynamics:


As shown above, Russia is the only BRIC economy currently generating upward supports for global growth.

When we consider individual sectoral indices, as shown in the chart below, BRIC Manufacturing sector is now pushing global growth momentum down, while BRIC Services sector is co-moving with the global growth, but provides no positive momentum to global economic expansion:

Finally, using monthly data (100=zero growth) for the BRIC economies index of economic activity (computed by me based on Markit and IMF data), the chart below shows just to what extent does Russian growth momentum dominates rest of the BRIC economies dynamics:


In summary, BRIC economies remain negative contributors to the global economic growth, with BRIC economies posting overall positive, but weak growth across the two key sectors.

10/4/17: BRIC Services PMI 1Q 2017: Another Weak Quarter


Yesterday, in my analysis of BRIC Manufacturing PMIs for 1Q 2017, I showed that 51.1 for 1Q 2017, BRIC Manufacturing PMI average came down marginally on 51.2 in 4Q 2016, although up on 49.2 reading for 1Q 2016. Russia was the only economy posting Q1 2017 Manufacturing activity in line with Global Manufacturing dynamics and BRIC as a group were exerting downward pressure on global manufacturing sector.

The news, therefore, were not great for the global manufacturing economy (stalled growth momentum in 1Q 2017), and for the BRIC economies.

Looking at Services PMIs next:

Brazil's Services PMI for 1Q 2017 averaged at 46.4, which is somewhat better than 44.5 average for 3Q 2016 and 4Q 2016 and stronger than 40.0 average for 1Q 2016. In simple terms, Brazil's Services activity continued to shrink and shrink rapidly in 1Q 2017, although the rate of contraction moderated. All in, Brazil's Services PMIs have now been in sub-50 territory for 10 consecutive quarters, two quarters shorter than Brazil's Manufacturing sector. The long-running and deep recession in Latin America's largest economy is continuing, although there are some very fragile signs that it might come to an end in the foreseeable future, as both Manufacturing PMI (at 49.6 in March) and Services PMI (at 47.7 in March) are showing signs of recovery.

Russia Services PMI for 1Q 2017 came in at a blistering pace of 56.8, up on already significant growth in 4Q 2016 at 54.6 and significantly above 1Q 2016 reading of 50.0. All in, this is the fourth consecutive quarter of Services PMIs above 50.0, with all four quarters reading statistically significant for positive growth. Russia is leading BRIC contribution to global growth in both Manufacturing and Services sectors, judging by PMIs.

Indian Services PMI was at 50.2 in 1Q 2017, which not statistically distinct from zero growth marker of 50.0, but up on 49.3 in 4Q 2016. In 1Q 2016 the Services PMI averaged 53.6 which was positive for growth. Indian economy has been hitting some trouble waters for the last two quarters, something I remarked upon in the post covering Manufacturing PMIs linked above. While Services are showing signs of stabilisation, the recovery is not yet evident in the data and is lagging Manufacturing sector performance.

China's Services PMI reading in 1Q 2017 disappointed those who hoped that 2016 credit explosion would set stage for a robust economic growth recovery. With Manufacturing PMI growth signal stuck at the same level in 1Q 2017 as in 4Q 2016, Services PMI reading for 1Q 2017 was actually below the 4Q 2016 reading (52.6 vs 53.0). Given that the index never once slipped below 50 in the history of the series, as well as given the moments of the underlying distribution, 52.6 reading is statistically indistinguishable from zero growth conditions. Thus, although posting the second strongest, amongst the BRIC economies, PMI reading for 1Q 2017 after Russia, Chinese Services sector was a relative negative for global growth momentum.

Chart and table below summarise some of the dynamics discussed earlier:


In summary, as shown above, global PMIs are supported to the upside only by Russian Services PMI dynamics, with Chinese Services PMIs providing virtually no momentum to global Growth, and both India and Brazil contributing negatively. Overall, thus, BRIC economies remain weak and under-perform global growth.

Thursday, February 9, 2017

8/2/17: BRIC Composite PMIs: Russia Sustains Growth Momentum in January


Having covered January PMIs for BRIC economies for manufacturing sector (http://trueeconomics.blogspot.com/2017/02/2217-bric-manufacturing-pmis-russia.html) and for services sector (http://trueeconomics.blogspot.com/2017/02/2217-bric-manufacturing-pmis-russia.html), let’s update data for Composite PMI indicator.


Overall, only one BRIC economy - Russia - provided solid support to global growth in January, with China providing a slight downward momentum and India and Brazil leading to a significant downside momentum.

Brazil’s Composite PMI continued to signal severe contraction at 44.7 in January, tanking deeper into a recessionary territory compared to December 2016 reading of 45.2. This makes 23rd consecutive month of contraction. Brazil registered recessionary PMIs in both Services and Manufacturing and in both sectors, January readings were no better than December. In simple terms, there is no light in the end of Brazil’s recessionary tunnel, yet.

Russia Composite PMI posted a robust upward improvement, rising from an already fast-paced 56.6 in December 2016 to 58.3 in January 2017, marking 12th consecutive month of above 50 readings and the highest Composite PMI level on record. Impressively, both Services and Manufacturing sectors PMIs rose in January, compared to December.

Chinese Composite PMI posted a significant slowdown in growth from 53.5 in December 2016 to 52.2 in January. Still, the index remains above 50 mark for 11th month in a row. Chinese Manufacturing PMI declined substantially in January, while Services posted a very modest drop. Importantly, Chinese Manufacturing PMI has now dropped below statistically significant above-50 reading, after just one month at the level close enough to being almost statistically significant.

Third month of sub-50 readings in Services PMI and anaemic 50.4 reading in manufacturing meant that India’s Composite PMI remained below 50.0 marker for the third consecutive month, posting 49.4 in January compared to 47.6 in December. Despite index improvement (signalling slower rate of economic activity contraction), Indian economy remains in recessionary dynamics, courtesy of the completely botched self-inflicted policy mayhem - the misguided demonetisation.

Table below summarises the most recent movements in Composite PMIs

Chart below shows Composite PMIs for BRICs (quarterly basis) against the Global Composite PMI, showing that the current global growth trend is still being supported by the BRICs, with primary positive impact coming from Russian figures.


The following chart summaries the sheer magnitude of Russian growth momentum compared to BRICs-ex-Russia:


However, the good news is that despite slippage in India and extreme weakness in Brazil, overall BRIC’s contribution to global growth continues to trend upward, albeit with some significant moderation since mid-4Q 2016:


Tuesday, February 7, 2017

7/2/17: BRIC Services PMIs: Supporting Global Growth


BRIC Services PMIs for January signal continued expansion on world’s largest emerging economies.

Brazil Services PMI remained at a disappointing 45.1 in January, same as in December 2016, implying relatively steep rate of economic contraction in the sector. This marks 23rd consecutive month of sub-50 readings for the indicator, almost on par with 24 months-long sub-50 readings run for Manufacturing. Current 3mo moving average for Services PMI is at 44.9, marginally up on 44.0 3mo average for the previous period and on 44.5 3mo average through January 2016. Current 3mo average for Services is in line with the 45.1 3mo average for Manufacturing. Both sectors are signalling continued steep decline in the economy battered by 2 years of recessionary dynamics and no signs of a light at the end of that tunnel.

In contrast to Brazil, Russia Services PMI posted another steep acceleration in growth, rising from 56.5 in December 2016 to 58.4 in January 2017, the highest reading in 102 months. As a reminder, Russia’s Manufacturing PMI reached 70-months high in January at 54.7. Russian services sector now posted 12 consecutive months of above 50 readings, implying that Russian recession is now over (with Manufacturing PMI reading above 50 for 6 months in a row). 3mo moving average through January is at blistering 56.5, up on already solid 3mo previous at 53.1 and significantly up on 48.2 3mo average through January 2016.

Chinese Services PMI posted a slight moderation in growth from 53.4 in December 2016 to 53.1 in January, with current 3mo average at 53.2, up on 52.2 average for the previous 3 months’ period and on 51.3 3mo average through January 2016. Chinese Services PMI has never registered a sub-50 reading in its history.

India Services sector PMI continued to post sub-50 readings for the third month in a row, coming in at 48.7 in January, compared to 46.8 in December. On a 3mo average basis, January reading is at 47.4, which stands in sharp contrast to the sector fortunes in the previous 3 months period (53.7 average) and compared to January 2016 3mo average at 52.7.

Table below summaries both Manufacturing and Services PMIs for the BRICs:


Chart below shows dynamics in monthly Services PMIs


While the second chart shows current 1Q 2017 performance in quarterly data context.


Key point of the above chart is the strong co-movement between Global PMI and the Russian and Chinese PMIs for the sector. As I noted back in September, this is a strongly positive sign of global economy gaining some much needed growth momentum.

Clearly, Russia leads growth momentum within BRICs, with China providing supporting uplift. India and Brazil act as major drags on global growth across the Services sector.

Note: I covered BRIC Manufacturing PMIs in an earlier post here: http://trueeconomics.blogspot.com/2017/02/2217-bric-manufacturing-pmis-russia.html.

Friday, January 27, 2017

27/1/17: U.S. GDP Growth is Down, Not Quite Out...


So President Trump wants U.S. economy growing at 4 percent per annum. And he wants a trade tussle with Mexico and China, and possibly much of the rest of the world, or may be a trade war, not a tussle. And he wants tariffs on imports from Mexico to pay for the Wall. And all of this is as likely to support his 4 percent growth target, as a crutch is to support a two-legged sheep.

Take the latest U.S. GDP figures. The latest preliminary estimates for the 4Q 2016 U.S. GDP growth came out today. It is pretty ugly. The markets expected 4Q GDP print to come in up 2.2 percent, with some forecasters being on a much more optimistic side of this figure. Instead, q/q growth (preliminary estimate) came in at 1.9 percent. This puts full year 2016 growth estimate at 1.6 percent which, if confirmed in subsequent revisions, will be the one of the two lowest rates of growth over 2010-2016 period. In 2015, FY growth was 2.6 percent.

The key reason for the drop in growth that everyone is talking about is net exports. In 4Q 2016, net exports subtracted 1.7 percentage points from the U.S. GDP, which is the largest negative impact for net trade figures since 2Q 2010. This was ugly. But less-talked about was a rather not-pretty 1 percentage point positive contribution to GDP from inventories which was the largest positive contribution since 1Q 2015. And more: inventories overall contribution to 2016 FY growth was higher than in both 2014 and 2015.

Quarterly GDP Growth and Contributions to Growth
Source: ZeroHedge

Good news: business investment rose, adding 0.67 percentage points to overall growth, and private sector equipment purchases rose 3.1 percent. Good-ish news: (after-tax) disposable personal income rose 1.5 percent in real terms on an annualised basis, but this marked the lowest growth rate in income over 3 years. Slower rate of growth in personal income over 4Q 2016 was down to “deceleration in wages and salaries”. Structurally, this suggests we might see some capex growth in 2017, while wages and salaries growth slowdown is likely to give way to more labour costs inflation, consistent with headline unemployment figures. If so, 1.6 percent annual growth can shift to 2-2.2 percent range.

Adding a summary to the above, BEA report notes:  “The increase in real GDP in 2016 reflected positive contributions from PCE [private consumption], residential fixed investment, state and local government spending, exports, and federal government spending that were partly offset by negative contributions from private inventory investment and nonresidential fixed investment. Imports, which are a subtraction in the calculation of GDP, increased.” In other words: borrowed money-based personal spending, plus borrowed money-based government spending, borrowed money-based property ‘investments’ were up. Capacity investments were down.

So, about that 4% target figure, Mr. President... time to hire some Chinese 'state statisticians' to get the figures right?..


In a final caveat: this is the first print of GDP growth and it is subject to future revisions.

Friday, January 6, 2017

6/1/17: Euromoney Country Risk Review 2016


Euromoney article on "Country risk review 2016: Populism is risky" quoting, amongst others, myself: http://www.euromoney.com/Article/3650139/Category/0/ChannelPage/207410/Country-risk-review-2016-Populism-is-risky.html.


5/1/17: Global Growth Upside: More BRICs, less B


Back at the end of 3Q 2016, I contributed a chart to +Business Insider feature covering most important trends that analysts' keep an eye over. You can see the chart here: http://trueeconomics.blogspot.com/2016/09/22916-most-important-charts-in-world.html.

The key to global growth, in my opinion, will be recovery led by the emerging markets, and in particular - by world's largest emerging economies, the BRICs.

That was then, and this is now:


Observe the global growth trend implied by 4Q Composite PMIs:

  1. We have a second quarter uptick in global growth. What was fragile bounce back from the 2Q 2016 low of 51.1 to 3Q 2016 reading of 51.7 is now a robust push up in growth terms to 4Q 2016 reading of 53.4 - the strongest growth signal since 3Q 2015. 
  2. Two of the BRICs economies: Russia (4Q composite PMI average at 55.4) and China (4Q 2016 composite PMI average of 53.1) are leading the above trend.
  3. India is on a surprise downside, most likely attributable to series of policy errors (including demonetization), which (for now) is not yet a new trend to the downside. Should Indian economy get back to its 'normal' running order, BRICs contribution to global growth will pick up and global PMIs will be supported even further to the upside.
  4. Brazil, however, is a long term worry. Latin America's largest economy is in deep trouble, dragging down both BRIC growth prospects and the strength of the overall emerging markets growth.
What are the headwinds to watch?
  1. China is the obvious one. Current level of activity, including that signalled by the PMIs, is simply too exposed to monetary and fiscal stimuli, and, thus, highly risky. 
  2. Russia is another concern. Russian recovery from the recession is still fragile and requires continued confirmation, especially in Manufacturing sector. On the brighter side: improving commodities prices, and better prospects for monetary easing (due to significant decline in inflation pressures) are offering some hope forward. On the darker horizon, however, political cycle (2018 Presidential election) and geopolitical climate (elevated risks vis-a-vis Russian relations with the West and ongoing geopolitical rebalancing in Central Asia, Asia-Pacific, Eastern Europe and Middle East) present higher risks to the downside to growth.
  3. Brazil is simply a basket case that will have to go through a painful process of structural deleveraging and political re-balancing. However, as the rate of contraction in Brazil's economy moderates over time, BRIC's growth momentum will also improve as a group.
So keep a closer eye on those PMIs coming in 1Q 2017.

Thursday, January 5, 2017

4/1/17: BRIC Services PMIs: 4Q & FY 2016


I posted my analysis of BRIC quarterly Manufacturing PMIs here: http://trueeconomics.blogspot.com/2017/01/4117-bric-manufacturing-pmi-4q-2016-and.html.

Now, let’s look at Services sector. Table below summaries latest data


Brazil Services PMI for 4Q 2016 came in at 44.5, unchanged on 3Q 2016 and marking rapid rate of contraction in the country’s Services economy. This is 9th consecutive quarter of sub-50 readings, and 12th consecutive quarter of PMI readings statistically at or below 50.0 mark. Services recession continues to be worse than Manufacturing recession for the seventh quarter in a row.

Russian Services PMI ended 2016 with a bang. 4Q 2016 reading averaged 54.6, up on 3Q reading of 53.8. FY 2016 average is solid 52.9, which is a big contrast to 48.5 FY average for 2015. This is the strongest rate of quarterly average growth since 1Q 2013. Overall, dynamics in the Services sector support the view that Russian Services economy has now moved solidly out of the recession and into broad expansion. To translate this into overall economic outlook for growth, however, we need at least one (preferably two) quarters of above 52 readings in Manufacturing.

Chinese Services PMI also gained strength in 4Q 2016, ending the last quarter at an average of 53.0, up on 3Q 2016 reading of 51.9. FY 2016 average reading for the sector is robust 52.2 which is marginally better than 52.0 average for the the FY 2015.

India Services posted a surprising rapid contraction, falling for 4Q 2016 to 49.3 from 52.9 average for 3Q 2016. This marks the first sub-50 reading since 2Q 2015 and is hard to interpret as anything but a volatility induced by monetary reforms and a couple of other policy blunders. Still, 2016 FY average for the sector is at 51.8 which is virtually unchanged compared to 51.7 average for FY 2015.

Looking at the trends:


1) Russian rate of Services sector growth is now on par with pre-crisis period (2013 and earlier). China is taking second place in terms of Services growth momentum, albeit its expansion is both weaker than Russian, and sustained by superficial means (monetary and fiscal stimuli - not present in Russia).

2) India is on a sharp volatility down, which needs to be confirmed if we are to talk about general weaknesses in the economy.

3) Brazil remains the sickest of all BRICS, confirming the same positioning in country Manufacturing.

4) Again, tracing out longer term trends, Russian general slowdown set on around 2Q 2013 in Services has now been broken to the upside. While Chinese Services continue to trend along shallow growth line, and India’s trend (highly volatile) is suggesting some weaknesses in growth. Brazil’s Services weaknesses (turned decline in 4Q 2014) that started around 4Q 2012 - 1Q 2013 is still pronounced.

Monday, November 14, 2016

13/11/16: Oil Prices: Still in the Whirlpool of Uncertainty

This is an unedited, longer, version of my article for the Sunday Business Post covering my outlook for oil prices.


Traditionally, crude oil acts as a hedge and a safe haven against currencies and bond markets volatility. Not surprisingly, during the upheaval of the U.S. Presidential election this week, when dollar went into a temporary tailspin, equity markets sharply contracted and bonds prices fell, all eyes turned to the risk management staples: gold, oil and, on a more exotic side of trades, Bitcoin. Gold and Bitcoin did not surprise, staunchly resisting markets sell-offs and gaining in value. But oil prices tanked. The old, historically well-established correlation did not apply. Instead of rising, U.S. oil futures fell in the immediate aftermath of Donald Trump’s surprise victory, and then, in line with the stock markets, futures rose. Within the day, U.S. crude futures prices were back at USD45.27 a barrel on the New York Mercantile Exchange, while Brent rose back USD46.36 marker. More broadly, the S&P 500 Energy Sector Index rose 1.5 percent within 12 hours of the election results announcement.

This breakdown in historical patterns of correlations between crude and financial assets prices underlines the simple reality of the continuous oil markets slump: we are in the new normal of systemically low oil valuations underpinned by the very same driving forces that precipitated the crude price collapse from over USD100 per barrel to their mid-to-high 40’s today. These forces are three-fold, comprising reduced demand for energy, reduced demand for oil as a source of energy, and increased supply of oil.

Prices and Stocks

Currently, oil prices are rebounding from the eight-week lows, but prices remain sensitive to any signals of changes in demand and supply. The reason for this is the excess stockpile of oil stored in tankers, ground facilities and at refineries. Most recent U.S. federal data showed oil stockpiles swelling well ahead of the markets expectations, as producers continue to pump oil unabated.

U.S.-held inventories of oil were at 2.43 million barrels at the beginning of November, based on the data from the U.S. Energy Information Administration. American Petroleum Institute puts total stocks of oil in storage and production at 4.4 million barrels - more than 1 million barrels in excess of the seasonally-adjusted forecast for demand. And at the end of October, the U.S. posted a 34-year record in weekly increases in crude and gasoline stocks - at 14.4 million barrels.

The U.S. is no exception to the trend. OPEC recently revised its outlook for oil price recovery for the next three years based on the cartel’s expectation that current levels of production will remain in place for longer than anyone anticipated. Per OPEC latest forecast, we won’t see oil hitting USD60 per barrel until 2020. Only twelve months ago, OPEC forecast for 2020 was USD80 per barrel.

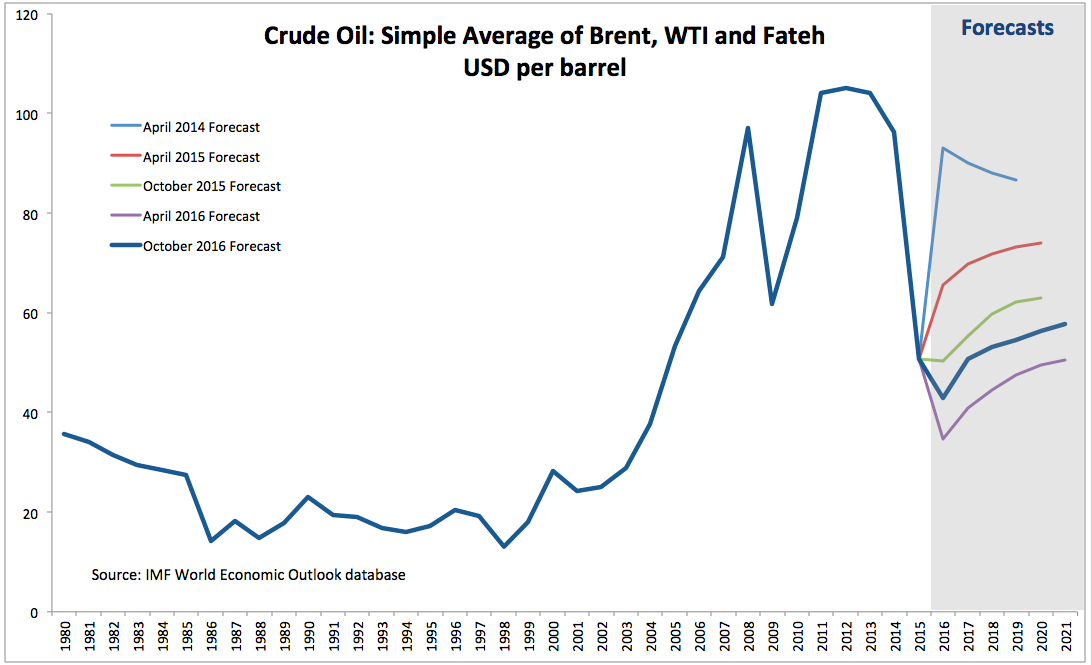
Similar forecasts revisions were produced a month ago by the IMF. In its World Economic Outlook forecast, the IMF revised its outlook for 2016 crude prices from USD50.54 per barrel forecast in October 2015 to USD 42.96 per barrel. 2017 full year price forecast moved from USD55.42 in October 2015 to USD50.64 in October 2016. If in 2015 the IMF was predicting oil prices to hit USD60 marker by mid-2018, today the Fund is projecting oil prices remaining below USD58 per barrel through 2021.


Both, the OPEC and the IMF forecast lower global economic in 2016 and 2017. The IMF outlook is based on world GDP expanding by just 3.08 percent in 2016 and 3.4 percent in 2017, well below post-Crisis average of 3.85 percent and pre-crisis average of 4.94 percent. OPEC forecast for oil prices is based on similarly pessimistic growth outlook for 3.4 percent average growth over the next six years, down from 3.6 percent forecast issued in October 2015.

Alternative Energy: Rising Substitutes

As demand for energy in general remains weak, alternative sources of energy are starting to take a larger bite out of the total energy consumption. Solar power capacity has almost tripled in the U.S. over the last 3 years. Renewables share of the U.S. power supply rose from around 4 percent of total power generation in 2013 to 8 percent this year, on its way to exceed 9 percent in 2017. Solar energy supply is now growing at a rate of almost 40 per annum, spurred on by the Federal solar tax credits, extended by the Congress in early 2016. In Germany, following the Government adoption of Energiewende policies — a strategy that aims to move energy supply away from oil and uranium — renewables now provide almost 30 percent of electricity, on average. And Gwermany’s upper chamber of parliament, the Bundesrat, has passed a resolution calling on the EU to create a system of harmonised taxation and vehicle duties that can ensure that only emission-free cars will be registered in Europe by 2030. On the other side of the spectrum, in the OPEC member states and Russia, renewables energy production is currently standing at below 5 percent of total energy demand. While the number is relatively low, it is rising fast and countries from Saudi Arabia to United Arab Emirates to Russia - all have significant ambitions in terms of lifting non-oil based energy output. In Abu-Dhabi, a recently approved solar energy project will deliver electricity at a cost below coal-fired power plants, at 2.42 US cents per kilowatt-hour, setting world record for the cheapest solar energy supply. Dubai plans to get 25 percent of its energy needs from renewables by 2030. The target is to reach 75 percent by 2050. Even Iran is opening up to use of renewables, with wind and solar investments in 2016-2017 pipeline amounting to close to USD12 billion. In Jordan, just one wind farm - a 38-turbine strong Tafila - is supplying 3 percent of country electricity, since production began in 2015.

All-in, globally, estimated 7 percent of oil demand decline over the last 5 years is accounted for by energy sources substitution. The key drivers for this trend are new environmental agreements, putting more emphasis on alternative energy generation, local environmental pressures (especially in China), and the desire to shift oil production to export markets, away from domestic consumption. Another incentive is to use clean power to reduce domestic subsidies to fossil fuels. According to the IMF report published earlier this year, Middle East, North Africa and Central Asia account for almost one half of the total worldwide energy subsidies. Since the onset of the oil price shock, UAE, Egypt, Oman and Saudi Arabia have been cutting back on fossil fuels subsidies and bringing retail prices for energy closer to market standards.

The second order effect of the above changes in energy composition mix is that moving away from subsidised fossil fuels improves markets transparency and reduces corruption. It also compensates for declines in oil prices in terms of exports earnings.

Drilling at These Prices?

As slower global growth and increasing substitution away from fossil fuels are suppressing demand for oil, supply of the ‘black gold’ is showing no signs of abating. Per latest OPEC statement, oil producers, especially in North America, surprised markets analysts by failing to curb production volumes in response to weak prices.  OPEC members have been running production volumes near historical records through out the 3Q 2016. And in the U.S., the Energy Department raised its production forecasts for both 2016 and 2017. However, U.S. crude output this year is unlikely to match the 2015 levels - the highest on record since 1972. All in, the Energy Department now estimates that 2016 average daily production will be around 8.8 million barrel per day (bpd), which is lower than 9.5 million bpd delivered in 2015, but more than forecast for 2016 back in September. Likewise, for 2017, the Energy Department revised its September forecast from 8.57 million bpd to just over 8.7 million bpd in October. Through the second and third quarters of 2016, North American drillers actually increased drilling activity as prices improved relative to late 2015. The number of active oil rigs operating in the U.S. is now up by more than 130 compared to May counts and the rate of new rigs additions is remaining high, rising to 2 percent last week alone.

Russia and Iran

A combination of stagnant or even declining demand, and expanding production means that the only change in the flat trend in oil prices over the next 6-12 months can come only from a policy shock on the supply side. For OPEC, Iran and Russia such a shock is unlikely to happen. Majority of oil exporting economies have either fully (as in the case of Russia and Iran) or partially (as in the case of Saudi Arabia) adjusted their economic policy frameworks to reflect low price of energy environment.

I asked, recently, Konstantin Bochkarev of Forex-BKS, who is one of the leading financial markets analysts working in the Russian markets for a comment on the current state of play in Russian economic policies in relation to oil prices. In his view, “It looks like the worst is over for the Russian economy in terms of adaptations to low oil prices, Western sanctions, geopolitical risks and other challenges of last two years. Sub-50-55 USD oil or even $40 is the new reality and it doesn’t scare any more. On the other hand low efficiency of the economic policy in Russia (due to a lot of constraints like the lack of reforms and the will to change anything before the President election in 2018) means that there’s rather huge cap for the Russian GDP growth which can be limited by 1%-1.5% at 40-55 USD oil.” Overall, “the «crisis policy» which was rather successful during this recession and led to the stabilization of the macroeconomic situations. The recapitalization of the Russian banking system, free float of the Russian ruble, higher interest rates, the transparency of the CBR policy and rather tight budget policy. All these measures finally led to 6% inflation by the end of 2016, rather sufficient decrease in volatility of the Russian ruble and less correlation with oil prices.” And moving away from the petroleum-dominated economy has had even deeper impact. Per Bochkarev, “Oil can’t solve all your problems any more whether it’s 40$ or 100$, because changing social and business environment, external and internal challenges demand something more than budget without deficit or stable cash flow. Still low oil prices can accelerate changes in the Russian economy and society and lead to some necessary reforms or unpopular measures.”

In a sense, Russian experience shows the direction that many oil exporting economies are heading in the age of low oil prices: the direction of accelerated fiscal and monetary responses and gradual structural economic reforms. In some areas, Russia took its medicine first and in a larger dose, but other big producers, including Iran and Saudi Arabia, as well as UAE are also traveling down the same path.

As an aside, it is worth noting that Iranian production is growing ahead of expectations. Per Bloomberg report:  “Output at the fields west of the Karoun River, near Iran’s border with Iraq, rose to about 250,000 barrels per day from 65,000 barrels in 2013, the Oil Ministry’s news service Shana reported Sunday, citing President Hassan Rouhani at a ceremony to formally open the project. Iran had expected to reach that output target by the end of the year, Mohsen Ghamsari, director for international affairs at the National Iranian Oil Co., said in September.” (http://www.bloomberg.com/news/articles/2016-11-13/iran-pumps-more-oil-as-saudi-minister-calls-for-opec-output-cuts)

Since the easing of the sanctions, starting with end of January 2016, Iran’s output rose from just around 2.82 million bpd to ca 3.65 million bpd.

Russian producers are also hardly feeling a pinch. According to Bochkarev, “Tax system plays a much more important role in the Russian oil companies production decisions than the rise or fall in oil prices. Whether oil is $40 or $100 per barrel majors are generating generally the same financial results. Besides almost oil majors are stable even at $30 oil. The decreases in oil prices are easily compensated by the fall in the ruble exchange rate. So cost control or cost cutting plays much more important role in other sectors of the Russian economy.”

Still, Russia and Iran might be heading into a direct competition in the European markets, where geopolitics and legacy contracts are changing the playing field away from simple price competition. This new - since January 2016 - competitive dynamic may be a longer term, rather than a current issue, however, according to Bochkarev. “It doesn’t look like that Iranian oil is huge challenge for Russian majors next several years. Numerous consumers who stopped buying the oil from Iran due to sanctions made some changes to their refinery or productions lines and equipment. So Iran has to offer some kind of bonus or lower oil prices to make them return to its oil. Probably it’s much easier for Iran to deal with China, India and other countries in Asia in order to find export markets for its oil. Iran can try to restore market share in Europe but the other hand of such policy can be lower oil prices or necessary discounts. LNG Imports from the US as well as the bigger role of Qatar and Iran in the future are already evident in European markets. The unique status of Gazprom is probably now a matter of the past but the more competitive market can finally make Gazprom more competitive.”

Trump Cards

Which means that economic policies shocks that can alter the current flat growth trend for oil prices are unlikely to come from the OPEC+ countries. Instead, the key to the near-term future variation in oil price trend will most likely come from the U.S. The markets are still assessing the full impact of Mr. Trump’s victory on his foreign and energy policies - the two key areas that are likely to alter the supply side of oil equation, as well as his economic policies that might influence the demand side and inflation. Starting with the latter, if - as promised during the election - the new White House Administration deploys a significant infrastructure and spending stimulus across the U.S. economy, we can expect both the demand for oil to firm up, clearing out some, but not all of the excess supply currently available in the markets. A stimulus to the U.S. growth is also likely to trigger higher inflation. With oil generally being a historical hedge against inflationary pressures, the likely outcome of improved growth performance across the U.S. will be a rise in oil prices from the current range of mid-40s to mid-50s and upper-50s, slightly above the IMF forecasts for 2017 and well ahead of the current market prices.

On the other hand, President-elect has promised to shift Federal supports away from alternative energy toward ‘clean coal’, oil and gas sectors. If he gets his way, the impact will be more American oil flowing to exports and higher excess supply, with lower prices. Mr. Trump’s election is likely to see the Republicans-controlled Congress moving to approve more export-driven pipelines, reducing the cost of oil transport from shale oil rich regions, such as Ohio and Pennsylvania, as well as North Dakota, and increasing incentives to boost production levels. Beyond stimulating production of the U.S. oil, Trump Administration is also likely to green light Keystone XL pipeline that will connect Canadian oil sands to exports terminals in the Gulf of Mexico. This will further expand supply of cheaper oil in the global markets.


Combining the two factors, it appears that the current IMF and OPEC outlook for 2017 for oil prices may be rather optimistic.

Barring a significant surge in global (as opposed to the U.S. alone) growth, and absent supportive cuts to production by the OPEC and other major producing countries, in all likelihood we will see oil prices drifting toward USD52-55 per barrel range toward the second half of 2017. Until then, any significant repricing of oil from USD47-48 per barrel price levels up will be a speculative bet on strong economic growth uptick in the U.S.

Thursday, March 3, 2016

3/3/16: BRIC Composite Activity - February


On a cumulative basis (based on Composite PMIs for each country), the BRIC economies as a group have posted a very disappointing performance in February 2016.

Note: for this index, 100.0 is a zero growth marker.

Russian economy Composite Indicator posted a positive upside surprise, rising from a contractionary reading of 96.8 in January to a weakly-expansionary reading of 101.2. 3mo average through February 2016, however, remains below 100 line at 97.9, which is weaker than the 3mo average through November 2015 at 100.3. The details of Russian Manufacturing sector woes are covered here: http://trueeconomics.blogspot.com/2016/03/2316-bric-manufacturing-pmi-february.html, while details of Russian Services and Composite PMIs upside are covered here: http://trueeconomics.blogspot.com/2016/03/3316-russia-services-composite-pmi.html.

As a result, Russian economy acted as a factor pushing up BRIC rates of growth in February:


In contrast with Russia, Chinese Composite Indicator posted a significant contraction in February, falling from 100.2 (zero growth) in January 2016 to 98.8 (weak contraction) in February. On a 3mo average basis, the index is now at 99.3 for the period through February 2016, up marginally on 98.9 reading for the 3months through November 2015, but down on 102.4 reading for the 3mo average through February 2015. Details of Chinese Manufacturing PMIs are covered here: http://trueeconomics.blogspot.com/2016/03/2316-bric-manufacturing-pmi-february.html, while details of Services and Composite PMIs are covered here: http://trueeconomics.blogspot.com/2016/03/3316-china-services-composite-pmi.html.


India’s Composite Indicator fell from 106.6 in January to 102.4 in February, signalling major slowdown in the rate of economic expansion. 3mo average through February 2016 is at 104.1, reflecting robust growth in January, and up on 102.9 3mo average through November 2015, but below 105.3 reading for the 3 months period through February 2015. The weakness in the Indian economic growth is highlighted by comparison to the historical average, which stands at 109.5.

Per Markit: “February data showed that services firms and goods producers alike registered weaker increases in activity. …Falling to a three-month low of 51.4 in February, from 54.3 in January, the seasonally adjusted Nikkei Services Business Activity Index highlighted a softer expansion of output that was only marginal. Where growth was seen, businesses reported higher levels of incoming new work. Although new orders at services firms continued to rise in February, the rate of expansion eased to the weakest since last November as firms reportedly faced strong competition for new work during the month. A quicker increase in order book volumes in the manufacturing economy was insufficient to prevent growth of private sector new orders from easing to a three-month low.”

Conditions in Indian Manufacturing are covered in detail here: http://trueeconomics.blogspot.com/2016/03/2316-bric-manufacturing-pmi-february.html.


Meanwhile, Brazil remained the sickest economy in the BRIC group. Composite Indicator for Brazilian economy sunk to an all-time low of 78.0 from an already recessionary 90.2 in January. As the result, 3mo average for Brazil’s Composite Indicator was at 85.3, down on already extremely weak 86.6 recorded over the 3 months through November 2015 and on 100.1 3mo average through February 2015.

According to Markit: “The downturn in the Brazilian economy took a noticeable turn for the worse in February. Business activity, new orders and employment all fell at, or near to, the fastest rates since the combined manufacturing and service survey began in March 2007. Companies continued to link the adverse operating environment to the ongoing economic, financial and political crises. …Accelerated downturns were registered at manufacturers and service providers alike, although the slump at services companies was especially severe. At 36.9 in February, down from 44.4 in January, the seasonally adjusted Markit Services Business Activity Index posted its lowest reading in the nine-year survey history. Business activity has fallen in each of the past 12 months.”

Brazil’s Manufacturing PMIs were covered in detail here: http://trueeconomics.blogspot.com/2016/03/2316-bric-manufacturing-pmi-february.html.

The summary of changes in both manufacturing and Services sectors across all BRIC economies is here:


Thus, overall, global GDP-weighted BRIC PMI Indicator (computed by me) fell to 98.4 - signalling moderate or mild contraction, down from January reading of 100.6. The Index is now registering sub-100 readings in seven out of nine last months. Worse, BRIC economies last posted a statistically significant reading for growth back in December 2014. On a 3mo basis, 3 months average through February 2016 is at 99.1, which is basically unchanged on 3mo average through November 2015 (99.0) and significantly lower than the 3mo average through January 2015 (101.8). Starting with February 2015, the index has been averaging zero growth.


3/3/16: China Services & Composite PMI: February

China Services PMI fell to 51.2 in February, from January’s six-month high of 52.4, pointing to a much slower rate of growth than the historical series average of 55.0. This comes on foot of Manufacturing PMI registering an outright contraction in February, with the rate of reduction quickening to the steepest since September 2015 (details here: http://trueeconomics.blogspot.com/2016/03/2316-bric-manufacturing-pmi-february.html).

Services PMI 3mo average through February was 51.3, which is basically flat on 51.2 recored in 3mo period through November 2015 and lower than 3mo average through February 2015 (52.4).

Per Markit: “New business growth also slowed across the service sector in February after a solid rise at the start of the year. Furthermore, the latest increase in new orders was weaker than the long-run trend and only modest, with some panellists commenting on relatively subdued client demand. New orders continued to decline at manufacturing companies, and at a slightly quicker rate than at the start of 2016.”


After posting a weak stabilisation in January (at 50.1), the Composite PMI fell to a recessionary level of 49.4 in February, indicating “a renewed fall in total Chinese business activity in February… to signal a marginal rate of contraction.”
 On a 3mo basis, 3mo average through February 2016 was at 49.7, up on 3mo average through November 2015 (49.5) and down on 3mo average through February 2015 (51.2). Again, last six months we saw averages well below historical average (52.9).

Per Markit, “slower increases in both activity and new orders contributed to a weaker expansion of service sector staff numbers in February. Companies that reported higher staff numbers generally mentioned hiring new employees in line with new order growth. Job shedding meanwhile intensified across the manufacturing sector in February, with the latest decline in workforce numbers the sharpest since January 2009. As a result, composite employment fell at a rate that, though modest, was the quickest in six months.”

This clearly signals that troubles are not over for Chinese economy and also suggests that currently projected rates of growth for the world’s second largest economy are way off the mark. Composite PMIs have now posted sub-zero growth signals in five out of the last seven months, with one other month reading being basically consistent with zero growth. On a Composite indicator basis, China is now the second weakest economy in the BRIC group after Brazil, with Russia overtaking itm having posted a composite index reading of 50.6 in February. Over the last 12 months, the same situation prevailed in July-September 2015, and in November 2015 the two countries were tied for the second worst performance reading.

3/3/16: Russia Services & Composite PMI: February


Russian Services PMI came in with surprising upside that bucked the trend in Manufacturing (see links here: http://trueeconomics.blogspot.com/2016/03/2316-bric-manufacturing-pmi-february.html), posting 50.9 reading in February, up from 47.1 in January. On a 3mo basis, however, 3mo average through February remains below 50.0 expansion line at 48.6, which is actually poorer than 49.6 3mo average through November 2015, although much better than 43.7 3mo average through February 2015. In simple terms, February uptick in growth in Services is fragile, unconfirmed, and at this stage does not constitute a robust signal of economic stabilisation.

Per Markit: “Russian service providers reported a slight increase in their business activity levels during February, driven by an expansion in new orders. However, a rise in new projects could not prevent a further sharp deterioration in outstanding business in the sector. Meanwhile, job cuts were evident while price pressures continued to persist.” Still, “the latest increase ends a four month sequence of contraction. Panel members partly linked rising output to an increase in new export orders, the result of a depreciating rouble.”


Net summary is: February reading for Services is encouraging, but is not yet consistent with sustained stabilisation in the economy. 

This has been confirmed by the Russia’s Composite Output Index which also returned to expansion territory in February for the first time in three months. Per Markit: “however at 50.6, up from January’s 48.4, the latest upturn was relatively weak.” On a 3mo basis, the Composite index is still below 50 at 49.0, which is lower than Composite Index average for the 3 months through November 2015 (50.2) although strongly ahead of the abysmal reading for the 3mo period through February 2015 (46.2).

“A higher level of new business was reported by Russian service providers during February, the first increase in five months. However, the pace of
growth was relatively weak. Anecdotal evidence suggested that the expansion reflected the introduction of new products across the sector. Meanwhile, a slight rise in volumes of new orders were reported by manufacturers this month.”

Again, on the net, Composite PMI figures show the return to growth to be unconvincing at this stage. We will need at least 3 consecutive months of above 50 readings to make any serious judgement as to the reversal of recessionary dynamics in Russian economy.

Thursday, February 18, 2016

17/2/16: The Four Horsemen Of Economic Apocalypse Are Here


Recent media and analysts coverage of the global economy, especially that of the advanced economies has focused on the rising degree of uncertainty surrounding growth prospects for 2016 and 2017. Much of the analysis is shlock, tending to repeat like a metronome the cliches of risk of ’monetary policy errors’ (aka: central banks, read the Fed, raising rates to fast and too high), or ‘emerging markets rot’ (aka: slowing growth in China), or ‘energy sector drag’ (aka: too little new investment into oil).

However, the real four horsemen of the economic apocalypse are simply too big of the themes for the media to grasp. And, unlike ‘would be’ uncertainties that are yet to materialise, these four horsemen have arrived and are loudly banging on the castle of advanced economies gates.

The four horsemen of growth apocalypse are:

  1. Supply side secular stagnation (technology-driven productivity growth and total factor productivity growth flattening out);
  2. Demand side secular stagnation (demographically driven slump in global demand for ‘stuff’) (note I covered both extensively, but here is a post summing the two: http://trueeconomics.blogspot.com/2015/10/41015-secular-stagnation-and-promise-of.html)
  3. Debt overhang (the legacy of boom, bust and post-bust adjustments, again covered extensively on this blog); and
  4. Financial fragility (see http://trueeconomics.blogspot.com/2016/01/19116-after-crisis-is-there-light-at.html)


In this world, sub-zero interest rates don’t work, fiscal policies don’t work and neither supply, nor demand-side economics hold any serious answers. Evidence? Central bankers are now fully impotent to drive growth, despite having swallowed all monetary viagra they can handle. Meanwhile, Government are staring at debt piles so big and bond markets so touchy, any serious upward revision in yields can spell disaster for some of the largest economies in the world. More evidence? See this: http://trueeconomics.blogspot.com/2015/10/101015-imf-honey-weve-japanified-world.html.

To give you a flavour: consider the ‘stronger’ economic fortress of the U.S. where the Congressional Budget Office latest forecast is that the budget deficit will rise from 2.5 percent of GDP in 2015 to 3.7 percent by 2020. None of this deficit expansion will result in any substantive stimulus to the economy or to the U.S. capital stocks. Why? Because most of the projected budget deficit increases will be consumed by increased costs of servicing the U.S. federal debt. Debt servicing costs are expected to rise from 1.3 percent of GDP in 2015 to 2.3 percent in 2020. Key drivers to the upside: increasing debt levels (debt overhang), interest rate hikes (monetary policy), and lower remittances from the Federal Reserve to the U.S. Treasury (lower re-circulation of ‘profits and fees’). Actual discretionary spending that is approved through the U.S. Congress votes, excluding spending on the entitlement programs (Medicaid, Medicare and Social Security) will go down, from 6.5 percent of GDP in 2015 to 5.7 percent of GDP by 2020.

Boom! Debt overhang is a bitch, even if Paul Krugman thinks it is just a cuddly puppy…

Recently, one hedgie described the charade as follows: ”I like to use the analogy that the economic patient is riddled with cancer — central banks are applying a defibrillator, but there's only so much electricity the patient can take before it becomes a burnt-out corpse.” Pretty apt. (Source: http://www.businessinsider.com/36-south-four-horsemen-2016-2?r=UK&IR=T)

My favourite researcher on the matter of financial stability, Claudio Borio of BIS agrees. In a recent speech (http://www.bis.org/speeches/sp160210_slides.pdf) he summed up the “symptoms of the malaise: the “ugly three”” in his parlance:

  • Debt too high
  • Productivity growth too low
  • Policy room for manoeuvre too limited


Source: Borio (2016)

The fabled deleveraging that apparently has achieved so much is not dramatic even in the sector where it was on-going: non-financial economy, for advanced economies, and is actually a leveraging-up in the emerging markets:

Source: Borio (2016)

And these debt dynamics are doing nothing for corporate profitability:

Source: Borio (2016)

Worse, what the above chart does not show is what the effect on corporate profitability will interest rates reversions have (remember: there are two risks sitting here - risk 1 relating to central banks raising rates, risk 2 relating to banks - currently under severe pressure - raising retail margins).

Boris supplies a handy chart of how bad things are with productivity growth too:

Source: Borio (2016)

The above are part-legacy of the Global Financial Crisis. Boris specifies: Financial Crises tend to last much longer than business cycles, and “cause major and long-lasting damage to the real economy”. Loss in output sustained in Financial Crises are not transitory, but permanent and include “long-lasting damage to productivity growth”. Now, remember the idiot squad of politicians who kept droning on about ‘negative equity’ not mattering as long as people don’t move… well, as I kept saying: it does. Asset busts are hugely painful to repair. Boris: “Historically there is only a weak link between deflation and output growth” despite everyone running like headless chickens with ‘deflation’s upon us’ meme. But, there is a “much stronger link with asset price declines (equity and esp property)”, despite the aforementioned exhortations to the contrary amongst many politicos. And worse: there are “damaging interplay of debt with property price declines”. Which is to say that debt by itself is bad enough. Debt written against dodo property values is much worse. Hello, negative equity zombies.

But the whole idea about ‘restarting the economy’ using new credit boost is bonkers:
Source: Borio (2016)

Because, as that hedgie said above, the corpse can’t take much of monetary zapping anymore.

Hence time to wake up and smell the roses. Borio puts that straight into his last bullet point of his last slide:

Source: Borio (2016)

Alas, we have nothing to rely upon to replace that debt fuelled growth model either.

Knock… knock… “Who’s there?” “The four horsemen?” “The four horsemen of what?” “Of debt apocalypse, dumbos!”